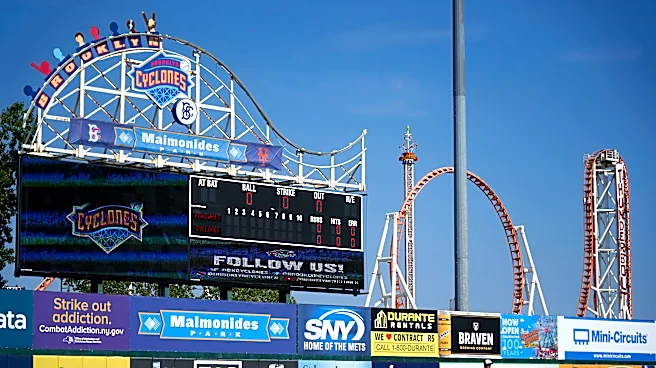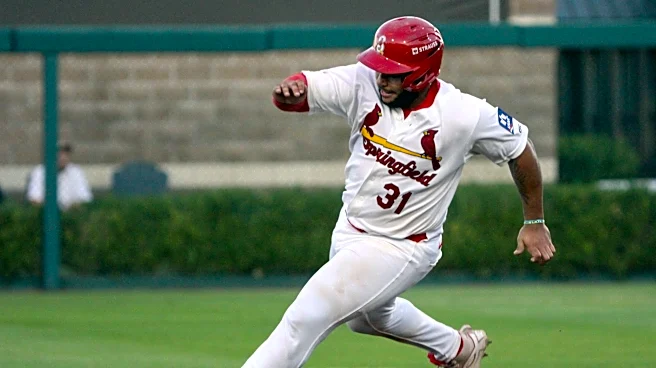



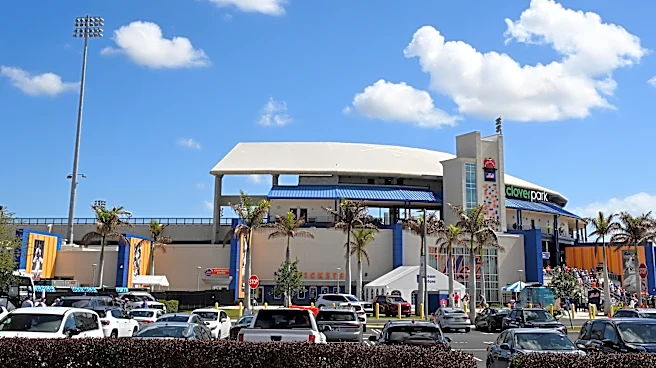
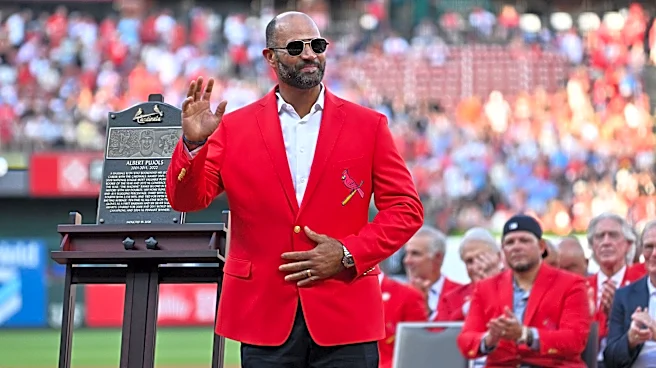
VEB points will be awarded to contributors who can identify the prospect on the opening screen. Hint…one of the most surprising break-out performances of the 2026 season, especially in regards to power.
What was going on in the minor leagues?
If you haven’t heard, power numbers are up throughout the minor leagues. Most notably, the power numbers are REALLY up in the levels AA back down through Low-A. AAA? Not so much. Almost flat-earth at AAA. The AAA league the Redbirds play in has seen only a .3% change in HR rate.
Baseball America (behind
a paywall) recently published on article on the very topic I’ve been monitoring for a bit. For those with BA subscriptions, you can read it here. If you don’t have a subscription, you can satisfy yourself with my high-level summary of their work (which as usual is very good – their work).

You can see from the data points above the MiLB scoring has hit a high point in 2026. The data is a little slim to determine if that ratchet up from 2024-2025 is extreme or if it just looks that way because those 2024 and 2025 years were down years. Regardless, scoring is up.

Sure enough, homerun rates follow a similar trajectory. Lots more, especially this year. Why? First, BA stripped out AAA runs and HRs and found that the AAA experience is not nearly as extreme as the other 4 MiLB levels. Suspicious? They naturally land on the different baseball being used as a likely culprit. Intuitive, but I’m not sure they convinced me of the leap from increased HR = increased runs = juiced MiLB baseball. I checked with some Cardinal folks and they too believe that while there may be something there, the jury is still out on what or how much.
Moving on, BA focused on actual batted ball data out of the Florida State League (FSL). Every team (except Daytona) has Hawkeye systems installed, so they get the proverbial Statcast data that is publicly available.
Authors Note: You guys have seen my prior articles on Cardinals and the Technology Revolution. Through my research for this article, I was able to confirm that the Cardinals now have Hawkeye installed at all affiliates except the Florida Complex League (if you’ve seen the backfield they play on, you’d understand why not there). Now that the FSL is done, some FCL guys will play at RDS and they will get some fine detail on those players.
Long story short, in looking at the FSL data, BA found that a lot of the unusual increase in homeruns fell into a group of batted balls I would consider mid-tier EV fly balls (95-105 mph) hit at an optimal trajectory, where the avg fly ball seems to travel about 5-10 feet farther this year, leading them to suspect the ball. This finding appears to account for about 50% of the increase in runs/HRs. More specifically, they found that mostly it was the pulled and opposite field fly balls that experienced the unusual HR increase, not so much balls hit to the deepest part. Stated succinctly, a fly ball pulled (or hit opp0) that travels 350 feet instead of 340 has a pretty high chance of changing from a deep fly to a wall-scraping HR. Unlike a ball hit to centerfield, where a 350 foot flyball looks an awful lot like a 340 foot fly ball and likely has the same result as last year. Good points.
That is my summary of BA’s fine work. If you want more detail, check it out in the link above.
I’ll add to this a little science. Two batted ball metrics that affect the balls flight are the Coefficient of Resistance (COR) and drag. Interestingly, one of the weird effects of drag is that some balls hit in that mid-tier EV mph range and hit at an optimal angle tend to generate a little extra lift at the end of their journey and have a tendency to float, so a not quite barreled fly ball may float a bit if it was hit at the optimal launch angle (think: between like 27 and 30 degrees). Not dissimilar to how an airplane wing generates optimal lift at the right attack angle – not too steep, not too shallow.
So the BA data may indeed be showing us a different ball, but it may also be showing us that the hitting instructional evolution around optimizing swing path is beginning to take hold at the lower minors and making the hitting experience down there more similar to the upper minors and MLB.
How does it affect evaluation of Cardinal prospects?
I spoke with Director of Hitting Dalton Hurd about this topic. They really evaluate players on their process, less so their results. Swing path, swing decisions, launch angle, etc., etc. are what they look at. In a sense, they value process over results. Not that you ignore results, but if the process is right, they expect good results. If one year the environment produces great (instead of good) results due to the ball or the weather or whatever, they can kind of wash that out by remaining focused on the process of hitting. Not quite said, but suggested, was the implication that better coaching, league wide, is likely contributing to better launch angles and higher EV.
For years, we’d look at stat lines of players in a place like Low-A (or previously High-A) Palm Beach, and we would have to remind ourselves that a .710 OPS by a 19-year-old really wasn’t that bad, because the run environment was harsh on hitters, particularly ones who hadn’t fully matured yet. We’d attenuate our evaluation due to the environment the player experienced. Now we look in 2026 and find that the run environment isn’t quite so harsh. Why? Well, the BA article says about 50% of the offensive increase is likely due to the baseball. But what about the fact that RDS fences were moved in after the 2024 season? Also, what about the overall reduction in players due to minor league contraction and reductions in the draft length?
I did do a wee little bit of research to see if Park Factors for a renovated RDS might be part of the equation. Pre-renovation, using 2023 numbers, run production in RDS is pretty much the same (RDS suppresses runs by about 10%) as it was in 2026. Interestingly, HR suppression improved quite a bit, from an abysmal 81 in 2023 to 94 (still below average) in 2026. Ball? Or park? Or hitters? Or all of the above?
I was reminded not to overlook that the minor leagues were compresses and the draft shorten. This could theoretically have the effects that: 1) the remaining group is by definition higher quality and you’d expect higher output and 2) don’t be shocked if you looked closely and found that some higher OPS, higher whiff guys are now coming up the system faster, instead of marinating in the Complex League longer. Higher OPS, higher whiff translate to higher EV and higher HR rates, which is what BA observed as the major eye catcher when looking at the data. Even if that player strikes out a ton. True outcomes and all…
We discussed a group of players who blazed through High-A Peoria at a time when the whole Midwest League was experiencing quite a jump in HR rates. This group will include some familiar names – Tai Peete, Won-Bin Cho, Rainel Rodriguez, Jack Gurevitch, Tre Richardson III. If you are a honk for “the MiLB ball is juiced”, you will have some trouble explaining how exactly the plethora of HRs hit by that group at Peoria seemed to follow them to Springfield and didn’t stay behind in Peoria to boost up the other players, as Peoria saw a drop in offense mid-season as those guys moved up. Notably, at the same time a weak Springfield offense saw quite a surge. Everyone I spoke with denied shipping pallets of juiced baseballs from Peoria to Springfield along with the players. Also, a juiced ball doesn’t explain how each of these phenoms struggled early after their promotion and then found the right adjustment to take off (again). It’s not like the AA league quit using a “juiced ball” for a couple of weeks to confound RainRod honks.
Hurd told me they really discourage players from trying to take advantage of environmental things (like a short porch of whatever) and just stick with the process. A good swing will produce good results. Good launch angle, good EV will produce good results over time. Trust the process, they say. He said in all five cases, each of those players had successfully made observable adjustments that explains their success. Not spoken, but by implication, this suggests a player seeing an increase in offense but is not advancing may be someone who isn’t really adjusting their approach but perhaps riding the wave that lifts everyone. I didn’t ask specifically, but one might think of Sammy Hernandez in this vein.
He did acknowledge that the ball could be having some effect, although he thought the jury is still out on how much. I gathered they somewhat ignore the unusual results because they are universal. If Cardinal hitters were NOT experiencing some extra oomph and everyone else was, they’d be more concerned about it. Also, they recognize there are so many uncontrollable factors involved in hitting and it could swing back the other way next year. So they focus on what they can control – the hitting process.
In the end, the story seems to be about trusting the hitting process, and that good process leads to good results (and advancement). And recognizing that much of hitting involves a lot of things the hitters can’t control like game time, temperature, humidity, pitch quality, the ball, etc.
A rabbit hole
One thing that came up that I haven’t yet had time to fully digest. Part of the hitting evolution involves where to contact the baseball relative to the plate. Since pulling the ball requires getting to the ball further out front (and going oppo allows for the ball to travel further), I think we’d have to look not only at whether pulled/opps hits are more likely to scrape over the wall, we’d need to know if more balls are being contacted well out front (close to 36” in front of the plate) and/or allowed to travel deeper in the zone (less than 30” for an opposite field direction).
Note: This little morsel is something I’ve been poking on since it seems to be something the Brewers have discovered that no other team has. The Brewers have a pretty strong tendency to allow the ball to travel and hit the ball oppo during most game situations. They essentially sacrifice power for OBP through scattering the ball to all fields and having increased contact, instead of selling out for pull side power. This approach defeats shifting, but also sags HR rates.
Fascinatingly, in high leverage situations, they revert more to pull side power. While their overall HR rate is very low by modern MLB standards, their close-and-late HR rate is average. Like they change hitting approaches mid-game. Interesting. It stands to reason that some of the data on MiLB runs is the opposite of this…most teams are selling out for launch angle with pull side power, and those slightly mis-hit, wall scraping HRs might well be the end result of that. This winter, I might try and dig into a data source that tells me how much MiLB hitters are trying to make contact well out in front of the plate. Getting pitch-by-pitch data on MiLB batters that would include contact point might be challenging, though. If only StL made that Hawkeye data available…