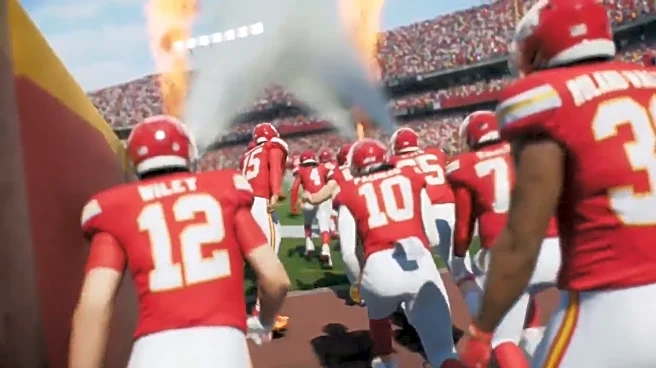
Since the Kansas City Chiefs have been on their bye week, I decided to compare our weekly Madden simulations to the real-life 2025 Chiefs to see how they stack up against each other.
| Simulation | Result | Error |
| Chiefs 30, Chargers 23 |
Chargers 27, Chiefs 21 |
26 |
| Chiefs 31, Eagles 17 |
Eagles 20, Chiefs 17 |
34 |
| Chiefs 24, Giants 19 |
Chiefs 22, Giants 9 |
20 |
| Chiefs 24, Ravens 23 |
Chiefs 37, Ravens 20 |
32 |
| Jaguars 31, Chiefs 20 |
Jaguars 31, Chiefs 28 |
16 |
| Chiefs 17, Lions 13 |
Chiefs 30, Lions 17 |
26 |
| Chiefs 35, Raiders 25 |
Chiefs 31, Raiders 0 |
50 |
| Chiefs 35, Commanders 17 |
Chiefs 28, Commanders 7 |
20 |
| Chiefs 31, Bills 25 |
Bills 28, Chiefs 21 |
26 |
As you can see, Madden
correctly predicted the winner in six of the nine games. Among the eight Arrowhead Pride contributors who have made predictions this season, no one has picked the winner more often. I also calculated the points of error* for each one of the Madden picks — just like we do for our weekly predictions. Madden has averaged 27.8 points of error, which is worse than all but one of our weekly panelists.
So Madden has been pretty good at picking the winner of each Kansas City game this season, but not very good at predicting the final scores of those games.
The Madden-simulated Chiefs entered the bye week with an 8–1 record. Madden’s predicted loss actually came true in Week 5, when the Jacksonville Jaguars scored exactly 31 points — just as the simulation had predicted. That simulation also came the closest to matching the 31-28 result — and was the only game this season in which the Madden prediction was closer than those made by all our AP panelists.
Of course, Madden also predicted three Kansas City wins that didn’t happen.
Let’s look at some season statistics.
Opponent Passing
- In the Madden simulations, the opposing quarterback has been sharp, with a 77% completion rate, 2,079 yards, 15 touchdowns and only two interceptions.
- In reality, opposing quarterbacks haven’t fared quite as well, recording a 71.5% completion rate for 1,763 yards, nine touchdowns and six interceptions. While still efficient, the turnovers and slightly lower yardage show that the real-life version hasn’t quite matched the Madden consistency.
Opponent rushing
- On the ground, the Madden simulation had the Chiefs surrendering 102 rushing attempts for 667 yards and eight touchdowns. That comes out to 6.5 yards per carry — though that number is inflated by quarterback runs. When isolating running backs, the defense allowed just 67 carries for 301 yards, a much more respectable 4.4 yards per rush.
- In real life, Kansas City’s run defense has faced a heavier volume, giving up 219 rushing attempts for 941 yards — a 4.3-yard average — and nine touchdowns. The numbers suggest the simulation slightly overstated the big-play runs, but otherwise accurately portrayed how opponents found occasional success on the ground.
Patrick Mahomes
- Through the simulated season, quarterback Mahomes has been nearly flawless, completing 86% of his passes. He’s thrown for 2,454 yards — an average of 272.6 per game — with 20 passing touchdowns and added 162 rushing yards and five scores on the ground.
- In reality, Mahomes’ numbers are still elite but a bit more human. He’s completed 64.6% of his passes for 2,349 yards (261 per game), tossing 17 touchdowns with five interceptions. On the ground, he’s been even more productive than the simulations expected, with 285 rushing yards and four rushing touchdowns.
Travis Kelce
- The tight end’s simulated season mirrors his usual dominance. Madden has had him hauling in 50 receptions for 646 yards — an average of 71.7 per game — and finding the end zone six times.
- In real life, his production has been slightly below the Madden projection — but still strong. Kelce has recorded 41 receptions for 540 yards (60 per game) and three touchdowns.
Isiah Pacheco
- Madden: 72 carries, 260 yards, 3.6 yards per carry, two rushing touchdowns and one receiving touchdown
- Actual: 78 carries, 329 yards, 37.1 yards per game and one rushing touchdown
Xavier Worthy
- Madden: 25 receptions, 324 yards, 12.96 yards per reception, two touchdowns
- Actual: 24 receptions, 256 yards, 10.7 yards per reception, one touchdown
JuJu Smith-Schuster
- Madden: 29 receptions, 347 yards, 11.9 yards per reception, two touchdowns
- Actual: 25 receptions, 291 yards, 11.6 yards per reception, one touchdown
Hollywood Brown
- Madden: 35 receptions, 338 yards, 9.6 yards per reception, three touchdowns
- Actual: 34 receptions, 389 yards, 11.4 yards per reception, four touchdowns
Rashee Rice
- Madden: 13 receptions, 147 yards, 11.3 yards per reception, two touchdowns
- Actual: 20 receptions, 215 yards, 10.8 yards per reception, three touchdowns
Tyquan Thornton
- Madden: 14 receptions, 179 yards, 12.7 yards per reception, one touchdown
- Actual: 14 receptions, 311 yards, 22.2 yards per reception, three touchdowns
Chris Jones
- Madden: 11 total tackles, six solo, three tackles for loss, five sacks
- Actual: 12 total tackles, five solo, two sacks
Nick Bolton
- Madden: 62 total tackles, 28 solo, eight tackles for loss, one interception, one forced fumble
- Actual: 72 total tackles, 32 solo, two pass deflections
George Karlaftis
- Madden: four sacks
- Actual: five sacks
At the end of the season, we’ll see how these comparisons change.
*To calculate a prediction’s points of error, the differences between the prediction and the actual score in point spread, home team score, and away team score are added together. For example, a prediction calls for a 17-10 Chiefs win. They end up winning 16-10, so there were two points of error: the point spread was off by one point, the Kansas City score missed by one point, and the opponent’s score was predicted correctly. But if the Chiefs lose the game 17-10, there were 28 points of error in the prediction: the point spread was off by 14 (the difference between +7 and -7), and both scores missed by seven.


