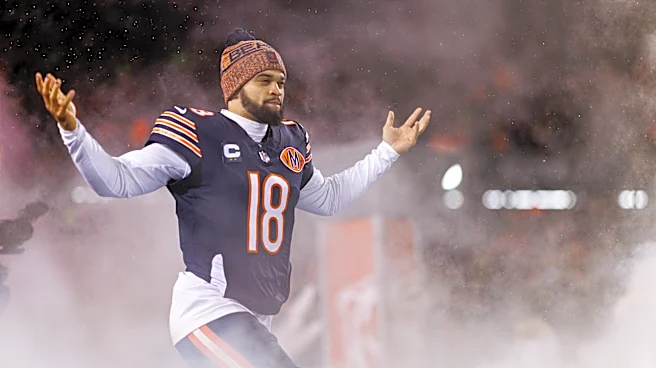


After a tumultuous 2024 season that saw the Bears cycle through 2 head coaches and 3 offensive coordinators while rookie QB Caleb Williams took an NFL-leading 68 sacks, the Chicago Bears spent the 2025 offseason setting up their young QB for success.
They brought in offensive whiz kid Ben Johnson as head coach, acquired veteran starters Joe Thuney, Drew Dalman, and Jonah Jackson for the interior OL, and spent high draft picks on TE Colston Loveland, WR Luther Burden, and OT Ozzy Trapilo.
The moves
paid immediate dividends, as WCG’s Gary Baugher Jr. pointed out in his excellent series highlighting Caleb’s growth from 2024 to 2025. In this series, we’re going to dive into Williams’ advanced statistical profile to see what he did well, where he struggled, and what areas have shown improvement and still need to be better.
For now, let’s start with a first look at Williams’ main efficiency stats, which you can view in the table below. Before I show the table, I want to briefly explain two of the all-encompassing metrics you might not be as familiar with:
- Success rate, with data from Pro Football Reference, is a measure of how often a dropback resulted in the offense gaining enough yards to be considered ahead of the chains (more detailed explanation here). This is a measure of consistency, with no consideration for big plays (ie a 4 yard gain and 40 yard gain on 1st down are considered the same).
- EPA, or expected points added, has data from RBSDM and measures how many expected points each dropback added based on the down and distance before and after the play (more detailed explanation here). This is quickly becoming one of the main metrics used to evaluate overall play and player value.
To put each of these stats into context, Williams’ rank for each stat compared to 32 QBs with 250+ pass attempts in 2025 is shown in parentheses, with the best, average, and worst of those 32 players shown as well. Values in the top 25% are highlighted in green, while those in the bottom 25% are highlighted in red.

A few thoughts:
- I’ll start with the bad: Caleb ranked towards the bottom in pretty much all of the metrics measuring consistency, which includes completion percentage, completion percentage over expectation (CPOE), and success rate. This is easily the largest area where improvement is needed, but it’s worth noting not everything here is as bad as it looks at first glance.
- Caleb was more hurt by drops than most QBs. Pro Football Focus (PFF) had the Bears with an 8.3% drop rate, which was the 3rd highest mark in the NFL (average 6.1%). Pro Football Reference (PFR) had Caleb with a 5.5% drop rate, the 4th highest mark in the NFL (average 4.4%). Depending on the source, that’s a 1-2% knock on completion % compared to expectation, which would bring Caleb about halfway back to a neutral CPOE.
- Of course, some would argue the high drop rate is because Caleb throws a ball that’s difficult to catch, but the evidence we have doesn’t back that up. In 2024, Caleb saw an average to below-average drop rate (3.8% per PFR, 5.8% per PFF). Ben Johnson also explicitly blamed the WRs for drops in his end of season press conference.
- Caleb also had a high rate of throwaways. Per PFF, 7.4% of Caleb’s passes fit this category, the 2nd highest mark in the NFL and nearly 3% more than the average QB (4.6%). This comes with keeping the sack rate so low, and an incomplete pass is much preferred to a sack. It also explains much of the difference between his completion percentage (7% below NFL average) and his CPOE (3.5% below expected).
- Still, as we’ll see in future parts of this series, Caleb’s accuracy was also a problem, and needs to improve to make the offense as a whole better. Caleb himself said this was his main focus for the offseason.
- Caleb was also below average in yards/attempt, though drops are a large factor here. According to Next Gen Stats, he lost the most yards on drops of any QB in the NFL in 2025. Bringing that to average would add about 0.4-0.5 yards/attempt, bringing him up to slightly above average there.
- Caleb was more hurt by drops than most QBs. Pro Football Focus (PFF) had the Bears with an 8.3% drop rate, which was the 3rd highest mark in the NFL (average 6.1%). Pro Football Reference (PFR) had Caleb with a 5.5% drop rate, the 4th highest mark in the NFL (average 4.4%). Depending on the source, that’s a 1-2% knock on completion % compared to expectation, which would bring Caleb about halfway back to a neutral CPOE.
- Still, there’s a lot of good to focus on:
- The biggest area of improvement is in sack rate, where Caleb went from arguably the NFL’s worst QB as a rookie to one of the best in year 2. We’ll look more in depth at this in part 4 of the series.
- Couple the low sack rate with a really good interception rate – a repeat trend from his rookie season – and you have one of the least mistake-prone QBs in the NFL. That has immense value that often doesn’t show up in statistics.
- Many QBs that avoid mistakes do so in a way that limits explosive plays, but Caleb also did quite well there. He produced an explosive pass (gain of 20+ yards) on 10.2% of his pass attempts and 9.2% of his total dropbacks (including sacks and scrambles). Both of those were 9th highest in the NFL, about 1% higher than league average.
- Producing big plays at a top-10 rate while being elite at avoiding negative plays is an extremely valuable combination. The two all-encompassing stats (EPA/dropback and adjusted net yards/attempt) both reflect this value.
- This might seem like a puzzling statement for EPA/dropback (data from RBSDM), given that Caleb ranked 26th of 32 QBs there, but a little more context is needed. X user @Chicagoguy23 (who you should definitely follow for Bears stats and analysis) broke down EPA values by different categories, and Caleb was quite good in the areas he could control (13th in pass EPA, 7th in scramble EPA). His overall EPA was brought down by ranking 29th in pre-snap penalties, 29th in QB sneaks, and 25th in botched snaps, all of which are not the fault of the QB.
- Looking at just the passing and scrambling EPA puts Caleb somewhere in the 10th-12th range, which matches adjusted net yards/attempt quite well. This is a stat from PFR that factors in passing yards, touchdowns, interceptions, and sacks to give an overall evaluation of how effectively a QB passes the ball.
Looking Ahead
So that’s our first glance. Overall, Caleb Williams was probably somewhere around the 10th-12th best QB in the NFL, with clear strengths (producing explosive plays, avoiding negative ones) but clear weaknesses as well (consistency and accuracy).
Throughout the rest of this series, we’ll look more in-depth at specific parts of his game. Here’s what’s coming up in each article:
- Part 2: Where and how effectively Williams threw the ball
- Part 3: How Williams did on different types of plays (play action, quick vs. slow developing)
- Part 4: How often Williams was under pressure, and who was to blame
- Part 5: How Williams performed under pressure
- Part 6: How Williams did against man and zone
Stay tuned!