
Thanks to the nflFastR project, Pro Football Focus and NFL NextGen Stats for the timely sources of data.
For those of you new to this, I will publish key QB stats each week judging how well the Colts’ QB performed.
Yes, O-Line, receivers, and play-calling impact these numbers but they are primarily QB measures. I will probably modify the charts throughout the season. Commentary will be brief but feel free to let me know in the comments that stats aren’t everything. (click charts for larger view)
It’s easy to write an analysis when everything’s going great. But when the wheels come off, you have to figure out why. And that “why” tends to divide fans into two groups: those who excuse a quarterback for a bad outing —and those who don’t. Consider me a “don’t” guy.
HOW WELL?
For the “not-the-QB’s-fault” camp — outside of the five turnovers, he played okay. He posted a 49.2% success rate, which is a bit above the NFL average and ranked 15th for the week. However, in my clearly-not-so-humble-at-all opinion, quarterbacks are responsible for their turnovers and they are EPA killers. So, it’s no surprise that Jones’ -0.16 EPA per play ranked 29th this week.
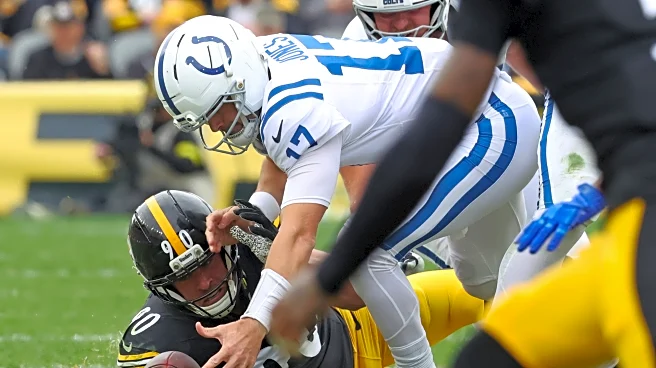
Yes, pressure led to strip sacks, but maybe recognize the pressure and do something about it? And sure, the tipped-pass interceptions were flukes, but maybe throw over the free blitzer bearing down on you? And defintiely don’t throw the ball straight to a defender . . . twice.
My point is that plenty of quarterbacks have faced pressure in games this season — but, most of them didn’t turn the ball over five times. What’s the saying: “Once is happenstance. Twice is coincidence. Three times is bad bounces, I guess. Four times is, ummm, playing on grass(?). But five times? Maybe, that’s on you.”
It wasn’t just EPA that tanked this week — yards per play dipped down as well. Still, Jones managed the 16th-ranked pass play conversion rate, so he was able to somewhat move the chains until turnovers ended the drives.
HOW FAR?
His completion rate (adjusted to include pass interference) dropped below 65% for the first time this year. That’s still not terrible… as long as it’s your teammate making the catch. His 7.1 yards per attempt is below average, but not significantly so. Other than the picks, those are all kind of “okay” numbers.

He maintained an above average depth of target and depth of completions.


TO WHO?
For the 2nd week in a row, Pittman and Pierce had big days, nearly matching each other in total receiving depth as both went over 100 yards. Warren had an off day with 5 catches for 26 yards.

Pittman has taken the lead over Warren in total yards, with both still vying for 1,000-yard seasons.

The per target value was basically below average for everyone this week. Part of that is fewer completions, but also just lower value throws.

This game didn’t dent the next graph much, as Colts receivers still average strong value per target.

HOW ACCURATE?
Accuracy took a nosedive this week, as Jones posted a below-average CPOE for only the second time this year. His completion rate also fell below league average for the first time as a Colt.

HOW FAST?
Time to throw dropped significantly and that was in reaction to the pass rush and not play design.

TO WHERE?
Wow, that’s a lot of landmines. The 10–20 yard range was the sweet spot for Jones — and even then, it wasn’t all that sweet.

The season heat map still looks good though.

DASHBOARD
mouseover definitions: epa/d, median EPA gain in similar game situation (down, distance, etc.)”>arsr, 3 yards to gain in game-neutral situations”>edp, opd, pr%, tip, ttt, adot, ay/c, yac, yacoe, yd/c, ac%, cpoe, aypa, scr%, ta%, sck%, aa%, aay, ny/d, ny/p, 1st%, td%, to%, 0″>qbsr epa/p, adj/p
So here’s the lowdown:
- Despite Jonathan Taylor being contained, the ground game was still fairly efficient, racking up first downs and a Daniel Jones TD— but game script forced the Colts to lean heavily on the pass (9th ARSR, 2nd EDP).
- Contrary to conventional wisdom, Jones didn’t face higher-than-average pressure overall. Now, before you call me an idiot and say this is why no one should pay attention to numbers — I’m not saying he wasn’t hurried. He was pressured enough to take five sacks, but for the most part, he was getting the ball out quickly to avoid it (21st PR%, 12th SCK%, 23rd TTT). Had he taken his usual time to throw, that pressure rate would’ve been much higher — so clearly, the O-line wasn’t playing as well as it normally does, and Jones didn’t have the time in the pocket he’s used to.
- Still, he pushed the ball downfield, but his completion rate dipped and receivers didn’t add much after the catch — resulting in a below-average yards-per-attempt (5th AY/C, 20th AC%, 19th AYPA).
- Outside of the sacks, he didn’t scramble or throw the ball away leading to a low abandoned rate (25th SCR%, 23rd TA%, 22nd AA%). So, he was still trying to make pass attempts, even though he had little time to do so.
- Still, despite all of that, his 5.9 net yards per play ended up around the 40th percentile. Obviously not good, but also not terrible.
- A decent conversion rate kept the ball moving, but the turnovers killed too many drives before they could reach the end zone (16th 1st%, 1st TO%, 21st TD%).
Those turnovers are really the sole reason why his success looked okay, yet his value per play was abysmal (15th QBSR, 29th EPA/p). It’s even more clear when looking at his efficeincy curve for the week.
mouseover definitions: ay<, dp%, ay/c, yac, yd/c, ac%, aypa, drp%, aypa, ta%, ypa, sck%, ny/a, scr%, ny/d, car%, ny/p, 1st%, any/p, td%, any/p, to%, any/p, epa/p, opd, adj/p
You can see that passing depth wasn’t the issue, but there was a steep drop due to limited YAC (5th in air yards per completion to 17th in total yards per completion) and another decline from incompletions (17th YD/C to 22nd adjusted yards per attempt). After that, his efficiency held fairly steady until adding the impact of first downs lifted him to 16th in adjusted net yards per play — which shows that, before accounting for turnovers, he was playing okay. But those five turnovers caused a precipitous drop to 29th in EPA per play.
For those who don’t want to blame Jones, it’s fair to say he didn’t have enough time to run the offense the way he wanted — and the ball definitely didn’t bounce our way a few times. I 100% agree with that, buuuuuut… it’s not like he was playing lights-out and a few fluky plays derailed what would’ve been a great day. When good quarterbacks face pressure and bad luck, they minimize mistakes and make things happen. Jones did not.
Does this mean that, going forward, our offense is doomed unless the O-line plays at a top-10 level? No. As a Colt, Jones has been very good under pressure prior to this game, so this might just be a one-of-those-days situation. But it still doesn’t absolve him of blame. Along with plenty of other players, he had a bad day.
Does this game change my opinion of him? Not really. Turnovers are fluky and a poor predictor of future ones. If they regress to the mean — which is almost a certainty — Jones should be fine. Maybe he won’t continue to be a top-five efficiency QB, but this offense doesn’t need him to.
For now, I still have him ranked as the 4th most efficient QB on the year.