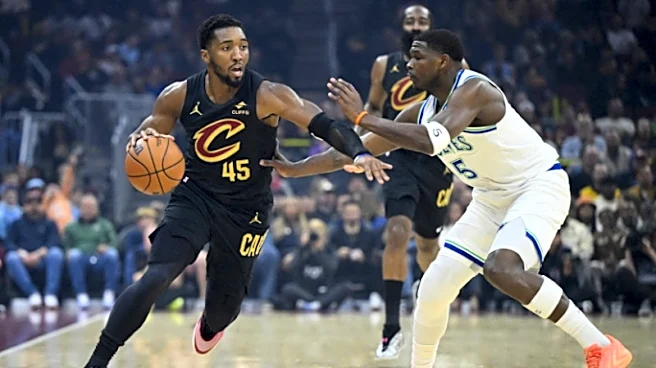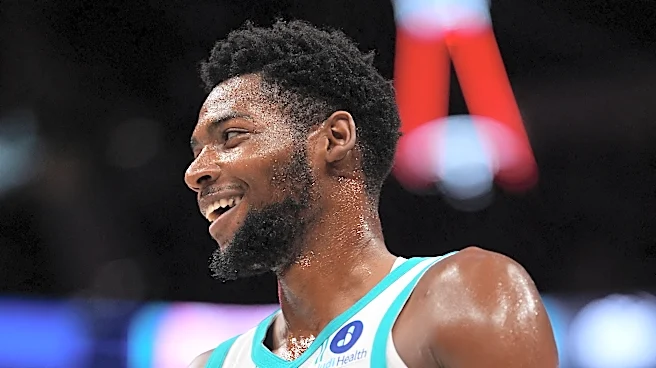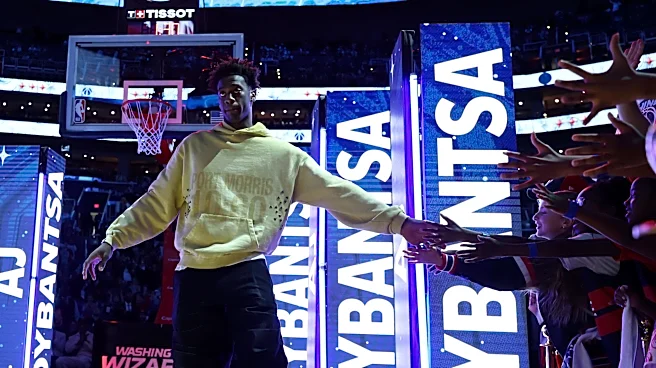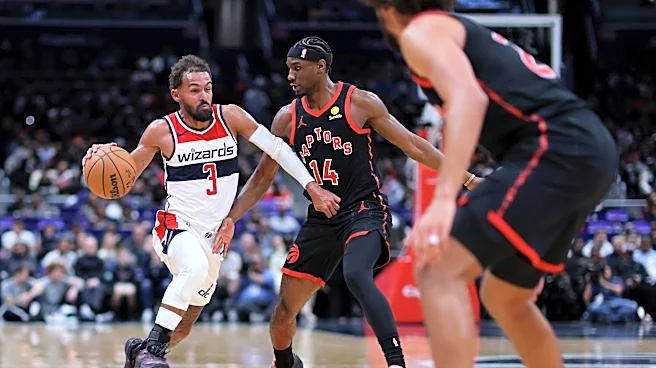


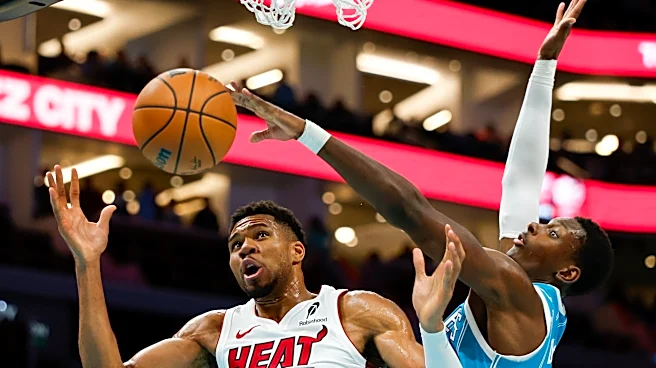
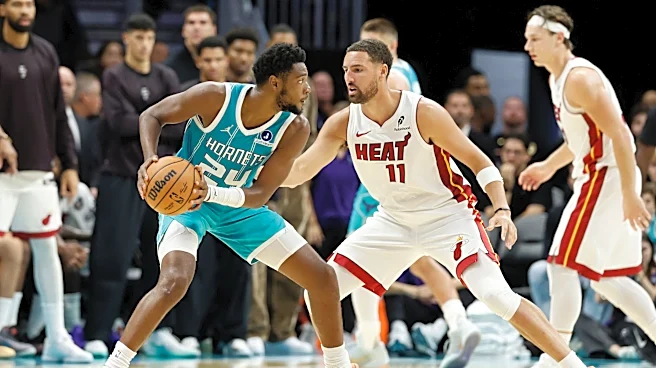

The Wizards couldn’t keep Moussa Diabate from getting offensive rebounds or Brandon Miller from scoring from everywhere, so they lost to the Hornets in Charlotte despite solid games from Anthony Davis and Trae Young.
Diabate grabbed eight offensive boards in the first half and finished with 11 for the game — a new career high. After a few bad possessions early with Bilal Coulibaly on him, Miller torched the Wizards from all over the floor — at-rim, mid-range, and threes. He finished with 39 points
— a new career high.
As for the Wizards, Davis was pretty good, notching 29 points and 10 rebounds on solid efficiency. He had trouble containing Diabate, and communicated effectively on defense.

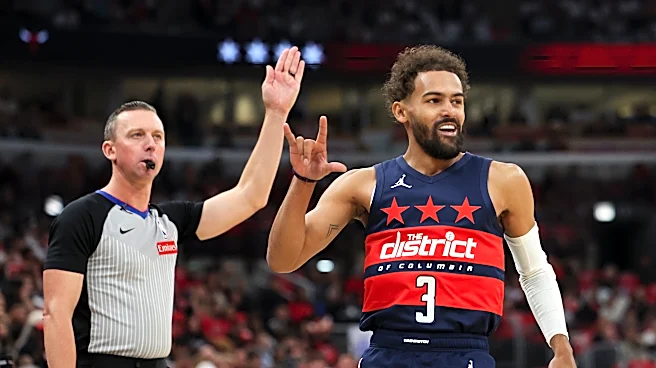
Young was crafty and effective for the most part, though he turned down a few threes he’d normally take. His passing threat was significant — looking at a teammate had Charlotte defenders jumping out of his way and leaving him open for layups.
One highly annoying development: going for a rebound, Justin Champagnie landed on Naz Reid’s foot, and suffered what appeared to be a significant ankle or foot injury.
From the notebook
- It’s only four games, but I’m not sold on the Wizards shot selection.
- One play annoyed me — Davis turned down an open three with a late closeout. Instead of side-stepping into a truly wide open three (which is a fundamental in today’s game), Davis took a dribble and stepped in for a long two, which he missed.
- I have no data to back this up, but my impression from watching Bub Carrington for two full seasons and the start of his third is that he’s terrible at throwing lobs. He tried one to Coulibaly in the fourth quarter that would have been a simple turnover with any other teammate. Coulibaly skied to deflect the pass off the backboard, grabbed the carom, and threw it off a Charlotte player while falling out of bounds.
- The coaching staff’s decision to start doubling Miller in the final minutes of the game, helped stall Charlotte’s offensive attack and get Washington back in the game. The Hornets countered with Reid hitting an open three, and then countering by bring Grayson Allen one pass away. The Wizards couldn’t help off Allen (a superb three-point shooter), and Miller immediately scored.
Four Factors
Below are the four factors that decide wins and losses in basketball — shooting (efg), rebounding (offensive rebounds), ball handling (turnovers), fouling (free throws made).
The four factors are measured by:
- eFG% (effective field goal percentage, which accounts for the three-point shot)
- OREB% (offensive rebound percentage)
- TOV% (turnover percentage — turnovers divided by possessions)
- FTM/FGA (free throws made divided by field goal attempts)
Stats & Metrics
PPA is my overall production metric, which credits players for things they do that help a team win (scoring, rebounding, playmaking, defending) and dings them for things that hurt (missed shots, turnovers, bad defense, fouls).
PPA is a per possession metric designed for larger data sets. In small sample sizes, the numbers can get weird. In PPA, 100 is average, higher is better and replacement level is 45. For a single game, replacement level isn’t much use, and I reiterate the caution about small samples sometimes producing weird results.
POSS is the number of possessions each player was on the floor in this game.
ORTG = offensive rating, which is points produced per individual possessions x 100. League average so far this season is listed in the Four Factors table above. Points produced is not the same as points scored. It includes the value of assists and offensive rebounds, as well as sharing credit when receiving an assist.
USG = offensive usage rate. Average is 20%. Median so far this season is 17.7%.
ORTG and USG are versions of stats created by former Wizards assistant coach Dean Oliver and modified by me. ORTG is an efficiency measure that accounts for the value of shooting, offensive rebounds, assists and turnovers. USG includes shooting from the floor and free throw line, offensive rebounds, assists and turnovers.
+PTS = “Plus Points” is a measure of the points gained or lost by each player based on their efficiency in this game compared to league average efficiency on the same number of possessions. A player with an offensive rating (points produced per possession x 100) of 100 who uses 20 possessions would produce 20 points. If the league average efficiency is 115, the league — on average — would produced 23.0 points in the same 20 possessions. So, the player in this hypothetical would have a +PTS score of -3.0.
Players are sorted by total production in the game.