


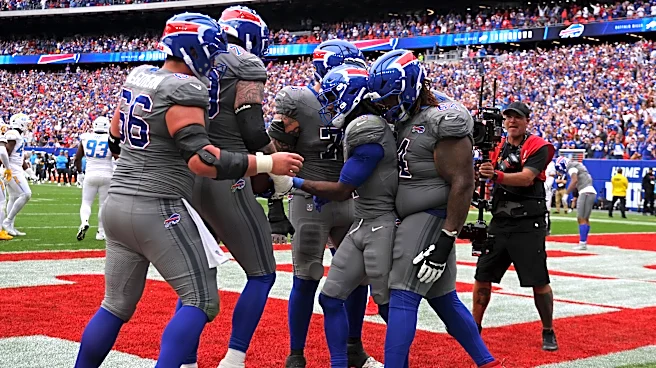
After allowing 31 points in their first two games, the Buffalo Bills finally had a respectable outing on defense against the Los Angeles Chargers by allowing 6.9 points less than the league average of 22.9. That said, questions still abound regarding the Bills’ D because, well… it’s very well possible the Chargers just. kinda. suck. Sure, allowing 16 points is a good thing, but it’s also the highest total anyone has allowed Los Angeles so far this year.
If Buffalo’s defense then is a movable object,
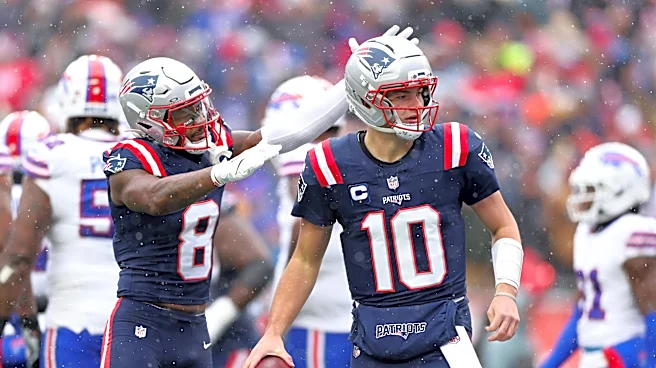
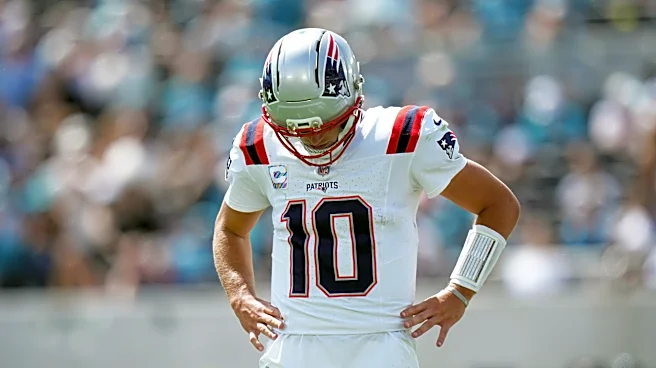
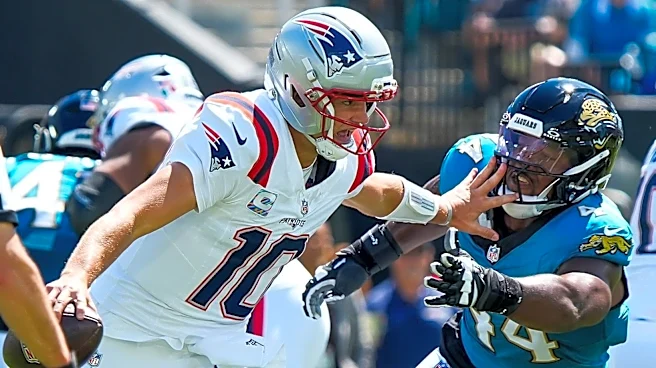
it should come as no small comfort then that so far their next opponent has been a very stoppable force on offense. The New England Patriots are tied with the Miami Dolphins as the worst offense in the league at 12 points per game scored. That’s juuuuuuuuust over half the league average.
Speaking of average offense, the Patriots offense has gotten within a field goal of it with their 20 point effort in Week 2 vs. the Pittsburgh Steelers (their only win so far). Buffalo managed 24 points in a game where they handed over the ball faster and more often than Halloween candy.
This intro is already too long; in this matchup of potential futility, who has the edge?
Weakness vs. Weakness: Analyzed
Before we begin with the stats, let’s take a trip down memory lane. Remember when I used to do math videos each week? HA! That was weird. Let’s do a call back to one, to explain my “rule of four.”
If you’re too stubborn to give me clicks on the ol’ YouTube here’s a very brief breakdown. Top ten lists for NFL teams can take a hike. The top ten of a 32 team distribution is over 30% of the sample size. Guess what? The bottom part of your top ten is thoroughly average and should be treated like it.
The rule of four is based around a Bell Curve distribution and, while not absolute, provides a good rule of thumb to separate teams into groups. Groups of fours, hence the name. In the 32 team distribution for a stat my rule of thumb says the top four are the “elite” teams. The next four can be considered “good” or more accurately “better than average.”
Average is a bit tricky as “average” should never be considered a single point. In fact, in most groupings the “average” cluster is the largest group by far. If you multiply four by four, you get sixteen. The middle sixteen teams are average. The next group of four are the “bad” or “worse than average” team, and the final group of four are the “terrible” teams.
Or to visualize…
1 – 4 = Elite
5 – 8 = Good
9 – 24 = Average
25 – 28 = Bad
29- 32 = Terrible
Got it? OK, let’s begin then…
The Buffalo Bills’ Defense
We’ll start with my favorite stat, points per drive. The Bills allow 2.52 points per drive, which ranks 25th. That squeaks into the “bad” grouping. They allow a scoring drive about 45% of the time and are 23rd in the league so “average.” To clarify, I don’t mean to insinuate there’s no difference between a rank of 23 vs. a rank of 10; but on gamedays you shouldn’t expect a lot of predictive validity in that stat. The 23 can likely be expected to hang against the 10.
The Bills have an average takeaway rate with a rank of 17 and narrowly hit average with a rank of 24 in yards allowed per drive. There’s not a single major stat I can find where the Bills reach the “good” level. The closest is sack rate where their 8.18% lands at ten.
On the flip side, there’s a few more “bad” stats and even some dabbling into “terrible.” Their interception rate is 26th, they’re 30th in first downs allowed per game; and the 27th ranked passing yards per game shows that their decent sack rate hasn’t precisely resulted in stopping the passing game of their opponents.
Is there any signs of life from this group? Why yes! Let’s check out play direction charts courtesy of the NFL.


If you’re new to these charts, they show play direction-based rankings and stats and are almost as high up the information I love to look at as per drive metrics. What do they show for Buffalo?
In the rushing game, they’re actually good at limiting the overall gain when runs are to the left guard or right end. This comes with the sample size caveats as we’re only three weeks in, but it does suggest that opponents will have varying success depending on where they try to fit a run in.
In the passing game it looks like attacking the short middle of the field and short right is gonna get you some yards with abysmal rankings of 30 in completion percentage in both. Now that does offer a bit of a confounding variable. They’re 28th and 32nd in yards allowed in those zones, but higher completion percentages eliminate “zeros” from the stats and naturally lead to higher per gain averages. In other words, you still expect big gains there, but a lot of it is due to the ball not hitting the turf in those areas.
All of that makes it shocking that the Bills (so far) have been one of the best teams (fourth) defending the short left side of the field. Now the chart ranks them similarly in the deep middle part of the field, but I hesitate to call that real with only six attempts in that direction so far.
The Patriots’ Offense
In what is essentially a “woe is me” contest, are the Patriots’ numbers on offense any better than the Bills on defense?
Remember how I said the Patriots were tied in points per game with the Dolphins as worst in the league? Let’s use points per drive as the tiebreaker. On a per opportunity basis, who is more futile? That would be the Patriots. At 0.97 points per drive, they comfortably trail Miami at 1.29 which is a huge gap. That 0.32 difference is tied for the largest gap between two teams in the league. And that tie is with the gap between the first and second place teams (49ers and Cowboys). For reference, league average is 2.10 points per drive.
The Patriots are also in last place in percentage of drives ending with a score at 23.3% (average is 39%). No one has turned the ball over more either with over 1/4 of their drives ending with a turnover. Which helps explain how they’re 16th in yards gained per drive. They move the ball, then hand it over. With turnovers potentially normalizing, this does suggest that perhaps the Patriots will improve at some point as a heads up.
Back to trashing them though…
They’re 28th in sacks allowed, 28th converting 3rd downs, and worst in touchdown rate in the red zone. Put in very candid terms, they’d need a big jump just to reach average. What do the play direction charts say though? Is there a spot of the field that’s their bread and butter?


I’ll repeat the disclaimer of low sample sizes, but New England has been shockingly successful in running off the left tackle (7th) and guard (1st). They’re also fine right up the middle. A single outlier here can skew things at this point in the season but an outlier in that direction still means they did something well.
In the passing game the data so far shows a wealth of mediocre. When you’re not truly all that good anywhere, you don’t necessarily need to be all that terrible either to put yourself in a bad place. That said, the hit “good” on completion percentage for deep middle passes and flirt with “good” on passes short right.
Interestingly, on those short right passes the average gain is 30th in the league. With such a high completion rate and such a **** average gain, that translation means that the short right passes are veeeeeery short. The deep middle passes to some extent are the same story; pairing the 8th best completion rate with the 19th best average gain.
The Final Straw
What does this all mean? First and foremost I don’t think it’s remotely a stretch to say that if we really are making this a game of who can throw the bigger pity party, it’s the Patriots. The data has them in the bottom four or eight in many areas. The Bills are more consistently dabbling in the realm of average despite some weaknesses.
If there’s one potential concern it’s hinted at above. The Pats’ incredibad stats are likely a major function of their turnover rate. They could literally gameplan to be deliberately less explosive to remove risk and come out way ahead overall. The sack rate improving could go a long way too, but as noted hereon Buffalo Rumblings, the offensive line for New England shouldn’t be expected to rebound this week.
On the flip side, the Bills have been OK in takeaways and nearly above average in sack rate. They show signs of life against a very blatant (at the moment) Achilles heel for New England. What’s been put down on paper through three weeks is pretty straightforward for this game. Unless one team or the other shifts drastically, despite defensive woes in Buffalo the Patriots’ offense is much, much worse.