Well, here we go. My first swing at the weekly recap for the season. Over the years, we’ve tried a few different versions of this thing. Center of the Sun had a good run, first steered by Rod Argent before
I took my shot at it. Suns Weekly followed after that.
This time around, we’re calling it Seven Days of Sun. Because that’s what this is, a look back at the last seven days in Suns basketball. (Man. How do I come up with these things?) And while this October has been wetter than I can ever remember, seven days of sun still feels like the standard forecast in Phoenix.
I’ve been wrestling with how to approach it this year, what stats to follow, and how to make sense of it all.
Last season, I rolled with Tracking 40, a column that measured how the Suns’ three-point volume and accuracy connected to their success. Spoiler alert, it didn’t. The numbers looked good on paper, but the wins didn’t follow. That’s basketball for you. The math never tells the whole story.
This season, I’m turning my attention to the possession game and how they were generated. Head coach Jordan Ott has been clear that extra possessions lead to better odds of winning, so I’ll be watching possession, rebounding, and turnover differentials, and how this team tilts the numbers in its favor. It might end up being another exercise in futility, but at least it’s an entertaining one.
So that’s the plan. A season-long experiment in chaos, data, and desert optimism. My goal is to make sense of how this team defends, attacks, and hopefully learns to capitalize on every extra chance they can create. Whether it works or not, we’ll find out together.
Now, let’s get into the Week 1 recap.
Week 1 Record: 1-2
vs. Sacramento Kings, W, 120-116
- Possession Differential: -3.8
- Turnover Differential: -2
- Offensive Rebounding Differential: +9
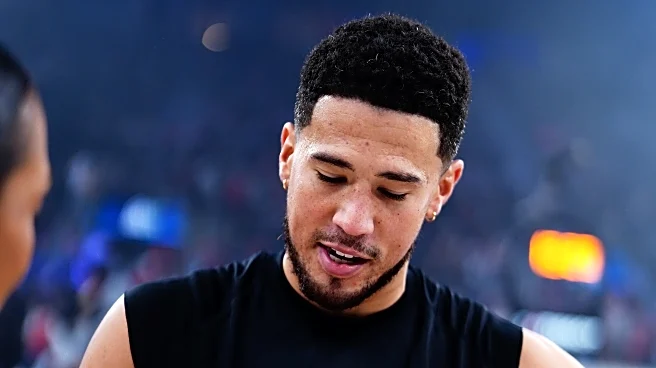
The Suns opened their season with a win that was more grit than glamour, rallying from a 20-point hole to take down the Kings. Devin Booker carried the offense, the team pounded the paint while the threes refused to fall early.
Jordan Ott’s crew finally cracked Sacramento’s defense by sticking to the plan: attack inside, kick out, and keep grinding. The shot chart was ugly, but the energy was real. The Mortgage Matchup Center was rocking again, and for one night, vibes and effort were enough.
Sure, the Kings had more possessions, but the Suns owned the glass when it mattered. Eighteen offensive rebounds turned into 28 second-chance points, six more than Sacramento managed with 22 (+6). Add it all up, and Phoenix walked away with a +4 win, powered by effort and hustle, not perfection.
@ Los Angeles Clippers, L, 129-102
- Possession Differential: +5.2
- Turnover Differential: -1
- Offensive Rebounding Differential: +5
Possessions don’t mean a damn thing if you can’t turn them into points. Sure, the Suns had more of them. Sure, they got second chances. But when you take 90 shots and walk away with 102 points, you’re setting yourself up for failure. That’s not volume, that’s noise.
@ Denver Nuggets, L, 133-111
- Possession Differential: -2.8
- Turnover Differential: -3
- Offensive Rebounding Differential: +1
We saw a more engaged and efficient Devin Booker, but his nine turnovers hurt. Combine that with a Denver team that was locked in, with seven players scoring in double figures and 42 free throw attempts, and you’ve got a tough hill to climb. Winning in the Mile High City on the second night of a back-to-back is no easy task, and this one slipped away the way those games usually do.
Inside the Possession Game
- Weekly Possession Differential: -1.4
- Weekly Turnover Differential: +6
- Offensive Rebounding Differential: +15
- Year-to-Date Over/Under .500: -1
The data points begin here. Who knows where it’ll go from here.
As the season unfolds, stacking four different metrics on one chart might get messy, and I may end up splitting them into separate visuals. But for now, here’s the first snapshot: a graphical look at where the Suns’ differentials landed for Week 1.

You’ll find after a week of data collection that even with a +6 turnover differential and a +15 advantage on the offensive glass, the team still lost the possession battle. Why? Because free throws are part of the possession equation. Remember the equation for possessions: Possessions = FGA + (0.44 × FTA) − ORB + TOV
The Suns averaged 16.7 free throw attempts per game in week one, ranking 26th in the league. Their opponents averaged 30.3, which was the 10th most allowed.
The issue isn’t complicated. They fouled too much and didn’t get fouled enough. They drew 21.3 personal fouls per game while committing 26.3. Add that to a field goal percentage of 44%, which ranked 24th, and the first week tells a simple story. You can crash the offensive glass. You can take care of the ball. But if you’re putting opponents on the line and not converting your own looks, you’re fighting uphill.
The lesson is clear. Play smart, stay disciplined, and hit the shots you earn.
Week 2 Preview
The Suns have four games lined up in week two, three of them at home, including their first In-Season Tournament/NBA Cup/Whatever the Hell They’re Calling it This Year matchup.
The week starts in Utah against a Jazz team sitting at 1–1 after beating the Clippers and falling to the Kings. After that, Phoenix returns home for a three-game stretch, beginning with the Memphis Grizzlies, who are off to a 2–1 start.
Friday brings a rematch with Utah, this time in the Mortgage Matchup Center for a Spooktacular night that also marks the Suns’ first NBA Cup game. They share a group with the Jazz, Timberwolves, Kings, and Thunder. The next tournament matchup won’t come until November 21.
The week wraps up next Sunday with a visit from Victor Wembanyama and the undefeated Spurs. Wemby looks every bit the force everyone feared he’d become, and the Suns will have their hands full trying to slow him down.


