






The Dallas Cowboys will open training camp in about two weeks. Their first preseason game is in about four weeks, and the season opener is just eight weeks away. Among other things, that means win-total projections for 2026 are going to be coming in hot and fast. And some of them are already in:
- In late May, NFL.com’s Ali Bhanpuri predicted the No. 2 seed and an 11-6 record for the Cowboys, while his colleague Tom Blair had the team missing the playoffs with a 9-8 record.
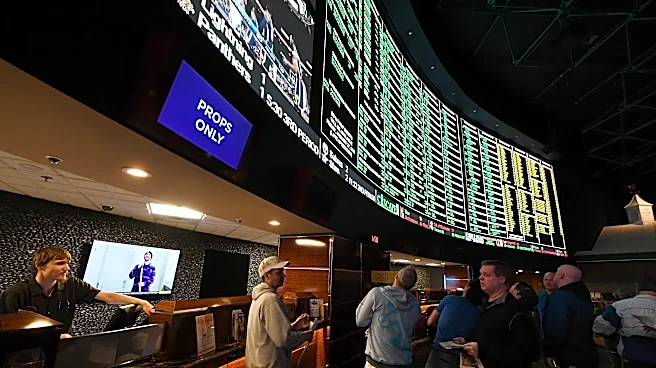
- In June, the DraftKings Sportsbook released its win projections and shows the Cowboys with 9.5 wins and narrowly missing the playoffs.
- Earlier this week, PFF.com released its win projections and has the Cowboys at 8.8 wins.
Few things get football fans more riled up at this time of year than win-total projections for the coming season, and the reaction to those projections is completely predictable.
One part of the fan base is
outraged that anybody could think the Cowboys could remain anywhere close to last year’s disappointing 7-9-1 team, another part is equally outraged that anybody could think the Cowboys could improve versus last year, a third part can’t understand how anybody could see much of a change in either direction.
But is getting worked up over those projections really worth it?
Almost two decades ago, Brian Burke, formerly of Advanced Football Analytics and now working for ESPN, published two articles three years apart titled ‘Pre-Season Predictions Are Worthless’ and ‘Pre-Season Predictions Are Still Worthless’. Today I’m going to use Burke’s methodology to understand whether anything has changed versus his assessments from 2007 and 2010, and I’m going to apply it to win projecti0ns covering the last four seasons.
To measure the accuracy of the projections at the time, Burke used a metric called mean absolute error (MAE). This is the average of the absolute difference between the projected wins and the actual win totals for a given year. If the MAE for a projection is 3.0, it would mean the projection was off by an average of 3.0 games in either direction. Obviously, the smaller the MAE, the better the prediction.
The win projections we’ll look at today are a collection of ‘expert’ projections for the last four years from ESPN (2022, 2023, 2024, and 2025) NFL.com (2022 , 2023, 2024, 2025), The Athletic (2022, 2023, 2024, 2025) as well as the Vegas win total projections (2022 and 2023, 2024, 2025).
For 2025, here’s how the experts ranked in terms of MAE for their projections.
- ESPN Analysts: 2.46 MAE
- Vegas win projection: 2.47 MAE
- The Athletic: 2.48 MAE
- Cynthia Frelund of NFL.com: 2.55 MAE
The expert predictions look to be pretty evenly matched – I had to go to the second decimal to even find a difference – but for a sport that only has a 17-game season, being off by about two and a half wins sounds like a lot. But is it?
To judge how good those values are, Burke proposed two very simple benchmarks to compare the results against:
1. The Coma Patient: Burke calls this the Constant Median Approximation system, or CoMA for short. This benchmark represents zero knowledge and is a mindless 8.5-win prediction for every team.
2. Koko the monkey: The benchmark, named after George Costanza’s unflattering nickname at Kruger Industrial Smoothing, is a very simple formula based on a regression to the mean from the previous season’s win totals for each team. Regression to the mean assumes that teams with a winning record tend to decline the next year; teams with a losing record tend to improve. The formula I’ll use to calculate this is straightforward: Starting with 8.5 wins, I add 0.25 wins for every win above 8.5 from the previous year, or subtract 0.25 wins for every win below 8.5 from the previous year. For example, a 12-win team from 2024 would be predicted to have 8.5 + (12-8.5)*0.25 = 9.4 wins in 2025.
Here’s how the expert projections compare to the two benchmarks for 2025.
- ESPN Analysts: 2.46 MAE
- Vegas win projection: 2.47 MAE
- The Athletic: 2.48 MAE
- Cynthia Frelund of NFL.com: 2.55 MAE
- Koko the monkey: 2.72 MAE
- Coma Patient: 2.88 MAE
Before we dive into the analysis, understand that we’re not looking at these projections with a sense of Schadenfreude, a malicious delight at seeing some of the bigger names in the business crash and burn – at least not too much. But these sites sell us their projections in return for our clicks and eyeballs, and that makes their products fair game. If you get our clicks, you also get our judgement.
And here’s how the expert projections compare to the two benchmarks over the last four seasons.
body .sbnu-legacy-content-table td, body .sbnu-legacy-content-table th, body .sbnu-legacy-content-table { border: 1px solid #000 !important; border-collapse: collapse !important; } body .sbnu-legacy-content-table td, body .sbnu-legacy-content-table th { padding: 0px 6px !important; }| Mean average error (MAE) for win projections by source and year | ||||||||
| Source | 2022 | 2023 | 2024 | 2025 | Average | |||
| Expert projections |
Vegas | 2.48 | 1.86 | 2.75 | 2.47 | 2.39 | ||
| ESPN | 2.48 | 1.88 | 2.80 | 2.46 | 2.40 | |||
| NFL.com | 2.43 | 2.07 | 2.67 | 2.55 | 2.43 | |||
| The Athletic | 2.36 | 1.93 | 3.00 | 2.48 | 2.44 | |||
| Mindless projections |
Koko the monkey | 2.47 | 2.04 | 2.98 | 2.72 | 2.55 | ||
| Coma Patient | 2.41 | 2.22 | 3.13 | 2.88 | 2.66 | |||
The data here suggests the expert projections are extremely close to each other every year. And Koko the monkey beat at least one expert projection from 2022-2024 before losing out in 2025 – not bad for a simple regression to the mean!
When the simplest math produces almost the same level of accuracy as the expert projections, that raises some questions about the validity of the expert projections.
But don’t be fooled by these numbers and assume that the experts don’t know what they are talking about, because their projections are as much about risk management as they are about making directionally correct projections.
The NFL is a closed system in which teams tend toward a .500 record, and a 9-8 or 8-9 record is mathematically the most likely outcome. In this system, every additional win above or below 8.5 wins is increasingly less likely, and projecting a team for a 12-5 or even 13-4 record is a risky move – or a bold move, depending on your point of view.
Yet many experts (NFL, ESPN, The Athletic, and Vegas are just the proxies used in this article for those experts) regularly pick teams to have very good or very bad records. Some of these experts use complex mathematical models, some use their expertise, many use a combination of both (some just hold a finger to the wind – but that’s a topic for a different day).
And that’s also something to consider as you review the experts above, are they showing a higher MAE because they are taking more risks than Koko the monkey? Here’s a simple look at the highest and lowest win totals in each projection as a measure for the amount of risk taken:
body .sbnu-legacy-content-table td, body .sbnu-legacy-content-table th, body .sbnu-legacy-content-table { border: 1px solid #000 !important; border-collapse: collapse !important; } body .sbnu-legacy-content-table td, body .sbnu-legacy-content-table th { padding: 0px 6px !important; }The numbers are clear, Vegas has the highest level of risk baked into the projection, NFL and The Athletic also have fairly high numbers, ESPN is more conservative with its win distribution, while Koko is taking an almost cowardly approach here.
What’s particularly interesting about the projections, at least if you’re already far down the projection rabbit hole, is that the projections improve significantly when you compare them to the previous year, not to the next year.
Take NFL.com’s projection for 2025. That projection had an MAE of 2.55 for the year 2025. But if we compare the 2025 projection to the actual 2024 results, the MAE drops significantly to 1.99. And this effect can be seen for all projections, so the projections are actually better at explaining the past than the future, which is odd for a projection about the future.
| Highest and lowest win totals by projection, 2025 | ||||||||
| Source | Low | High | “Stretch” | |||||
| Vegas | 4.5 | 11.5 | 7.0 | |||||
| NFL | 5.1 | 11.8 | 6.7 | |||||
| The Athletic | 5.2 | 11.2 | 6.0 | |||||
| ESPN | 6.1 | 10.6 | 4.5 | |||||
| Koko the monkey | 7.1 | 10.1 | 3.0 | |||||
| Mean average error (MAE) for win projections VERSUS PREVIOUS YEAR | ||||||||
| Source | 2022 proj. vs 2021 actuals |
2023 proj. vs 2022 actuals |
2024 proj. vs 2023 actuals |
2025 proj. vs 2024 actuals |
Average | |||
| Expert projections |
NFL.com | 1.45 | 1.53 | 1.44 | 1.99 | 1.60 | ||
| Vegas | 1.42 | 1.67 | 1.50 | 1.91 | 1.63 | |||
| The Athletic | 1.46 | 1.64 | 1.62 | 2.06 | 1.69 | |||
| ESPN | 1.39 | 1.76 | 1.50 | 2.28 | 1.73 | |||
| Mindless projections |
Koko the monkey | 2.46 | 2.40 | 2.26 | 2.89 | 1.89 | ||
| Coma Patient | 2.34 | 2.41 | 2.22 | 3.13 | 2.52 | |||
There are several statistical or semi-statistical explanations for the effect we are seeing here.
The expert projections likely incorporate dozens, maybe even hundreds, of variables (e.g. roster quality, quarterback play, injuries, coaching changes, schedule, draft picks, free agency etc.) Many of these variables are highly correlated with the previous season’s record, and as a result, the projections naturally stay close to the previous year’s standings.
They’re essentially saying, “Most teams are still roughly what they were.” The problem is that the NFL isn’t that stable.
Koko the monkey looks at last year’s standings and says, “Last year’s record is real – but not as real as it looks.” By assuming that roughly three quarters of every win above or below .500 is unlikely to repeat, it still achieves almost the same results as the expert predictions.
And this may be the real lesson here. The previous season contains three components:
- genuine team quality
- luck
- random events
Luck includes things like one-score games, turnover margin, injury timing, fumble recoveries, kicker variance, strength of opponents faced, and other factors that are often large enough to swing three or four wins over the course of a season.
The following year, much of that luck disappears. A model that treats a 13-win team as a ‘true’ 13-win team will systematically overestimate that team. A model that says, “They’re probably more like a 10-win team” is often closer to reality.
Take these two teams:
- The 2025 Broncos finished 14-3, including going 11-2 in one-score games.
- The 2025 Chiefs finished 6-11, but were 1-9 in one-score games.
Expert projections will likely rate the Broncos higher than the Chiefs because their underlying metrics remain strong. But if many of those underlying metrics are themselves noisy, the projection retains too much of last year’s signal.
Koko ignores a lot of last year’s signal and thus avoids using noisy information entirely. This is a classic bias-variance tradeoff.
And there may also be a psychological component. People dislike saying “This 14-win team will probably win no more than 10 games next year.” Fans hate it. Network executives hate it. Writers hate it.
Instead, forecasts tend to cluster around 11-12 wins. Similarly, nobody wants to predict that a 3-win team suddenly becomes an 8-win team. Yet that’s exactly what happens every NFL season.
A purely mechanical regression model has no such hesitation. And that’s exactly what the 0.25 coefficient does. It’s saying “About three quarters of every win above or below .500 was noise.” If that estimate is close to reality, then no amount of additional information will significantly improve an expert prediction over a simple algorithm.
For Cowboys fans, there is an upside and a downside to all of this.
The downside is that Koko the monkey projects the Cowboys as an 8-win team. Assuming an MAE of +/- 2.5, the Cowboys could finish somewhere between 5.5 to 10.5 wins.
That upside is that if you don’t want to listen to a monkey, you can always listen to the experts, and we saw earlier that DraftKings are projecting Dallas as a 9.5-win team, one of the NFL.com guys likes the Cowboys for 11.0 wins, and PFF has the Cowboys at 8.8 wins. Assuming another MAE of around 2.5 this year, the Cowboys are projected anywhere from 6.3 to 14.1 wins in 2026.
So sayeth the experts.
Which means there should be a result somewhere in that range that should suit just about every Cowboys fan.