Thanks to the nflFastR project, Pro Football Focus and NFL NextGen Stats for the timely sources of data.
For those of you new to this, I will publish key QB stats each week judging how well the Colts’ QB performed.
Yes, O-Line, receivers, and play-calling impact these numbers but they are primarily QB measures. I will probably modify the charts throughout the season. Commentary will be brief but feel free to let me know in the comments that stats aren’t everything. (click charts for larger view)
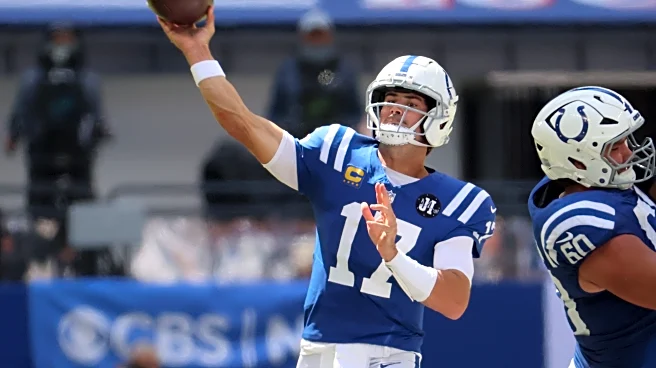
I’ve been pessimistic about Daniel Jones’ ability to lead the Colts offense because, aside from one season, he’s been a bottom-tier QB in five of his six years in the league. But against the Dolphins, he put up a career game and made me eat my words—for now.
HOW WELL?
Starting this season I’m including designed QB runs in my numbers—not because I think it’s the right way to measure QB play, but because it’s the popular thing to do. Designed runs can easily skew QB numbers, but I’m willing to test it out for now.
That said, Daniel Jones greatly benefited from it this week: his four designed runs were all highly successful (two touchdowns and two first downs). Those plays boosted what was already an excellent passing performance—one that was consistently strong throughout the game. And consistency is exactly what was missing under Anthony Richardson. Jones’ 62.2% Success Rate is the highest number any Colts’ QB has put up in the last 4 years.
Over the last 17 Indy games, Jones posted the highest EPA per play, highest QB success rate, and highest first-down percentage. His net yards per play only ranked third—which highlights why I’m not a fan of including designed runs. All four of his runs came in short-yardage (1-yard-to-gain) situations. He got the yards every time, but those plays dragged down his average.
HOW FAR?
His 75.9% completion rate and 9.4 yards per attempt kept the chains moving, leading to scores on all seven drives. He attempted 13 passes of 10+ yards and missed on only two.

His average depth of target was lower than what the Colts offense showed in 2024, but he connected on the deeper shots, which pushed his depth of completion far above average.


TO WHO?
He spread the ball around very well and involved tight ends more.

All of his receivers finished in the positive EPA-per-target range.

HOW ACCURATE?
It’s only been one game, but Jones showed far more accuracy than Richardson—and that’s what keeps the chains moving. And it wasn’t just checkdowns, either. His completion rate on passes of 10+ yards was outstanding. That’s something I’ll be watching closely, because in past seasons that hasn’t been the case for Jones.

HOW FAST?
Jones got the ball out fast, posting the second-lowest time to throw over the last 17 games. Even with a shorter-than-average depth of target, that’s an impressive release time—and that is something the NFL has been moving away from, to its detriment in my opinion.

TO WHERE?
He favored the left side of the field (55% of attempts), but his biggest success came on the right side, where he averaged +0.93 EPA per attempt.

DASHBOARD
Comparisons do not include the Monday night game yet.
mouseover definitions: epa/d, median EPA gain in similar game situation (down, distance, etc.)”>arsr, 3 yards to gain in game-neutral situations”>edp, opd, pr%, tip, ttt, adot, ay/c, yac, yacoe, yd/c, ac%, cpoe, aypa, scr%, ta%, sck%, aa%, aay, ny/d, ny/p, 1st%, td%, to%, 0″>qbsr epa/p, adj/p
To summarize week 1:
- The Colts leaned on the passing game even though they were dominating on the ground (12th EDP, 3rd ARSR).
- Jones faced little pressure despite staying in the pocket longer than average. But when he did throw, he got rid of it quickly (26th PR%, 13th TIP, 26th TTT).
- His average throw was short, but his average completion was long (26th aDOT, 7th AY/C).
- He was highly accurate, which boosted YAC and led to outstanding yardage efficiency (8th CPOE, 8th YACOE, 3rd AY/A).
- He didn’t bail on pass plays, yet still avoided sacks without relying on throwaways (21st AA%, 21st SCK%, 26th TA%).
- That ability to make plays lifted him from 3rd in yards per pass attempt to 2nd in yards per dropback (3rd AY/A, 2nd NY/D). However, the four short scripted runs knocked him back to 3rd in yards per all QB plays (3rd NY/P).
- With that kind of yardage efficiency, the first downs piled up—leading to a strong TD rate (1st 1st%, 8th TD%).
- He also committed no turnovers, which helped him finish 2nd in both EPA per dropback and QB Success Rate—a far cry from his averages in New York.
Indy showed him far more protection than he saw with the Giants and he was getting rid of the ball much quicker for more yardage. I very much doubt this level of play is sustainable, but the Colts don’t need him to be great, merely good and consistant.


