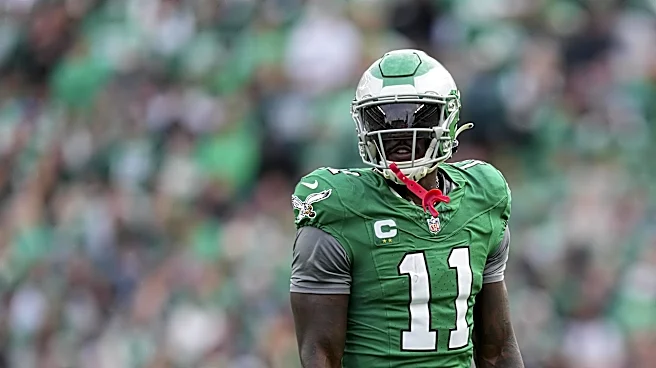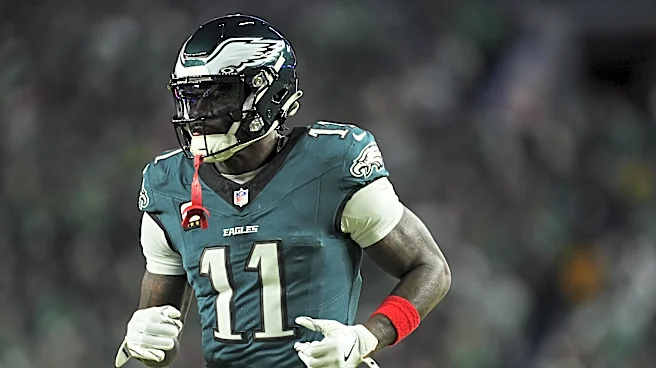


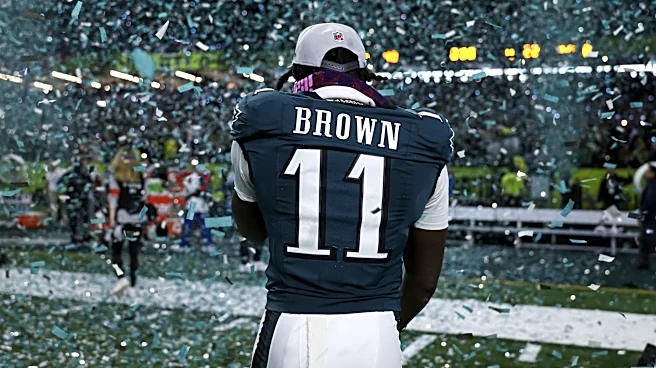
A.J. Brown being sent to the Patriots makes two AFC East teams that traded for veteran receivers this offseason — joining the Buffalo Bills acquiring DJ Moore in March, of course.
Because of that, these two wideouts will be compared for a while now, especially as the Bills and Patriots divisional rival rages on with Josh Allen and Drake Maye quarterbacking each team.
While Moore has been, let’s call it, a “half-tier” below Brown in reputation his entire NFL career, their per game statistics to date
are probably a lot closer than you think:
Moore receptions per game: 4.9
Moore receiving yards per game: 66.1
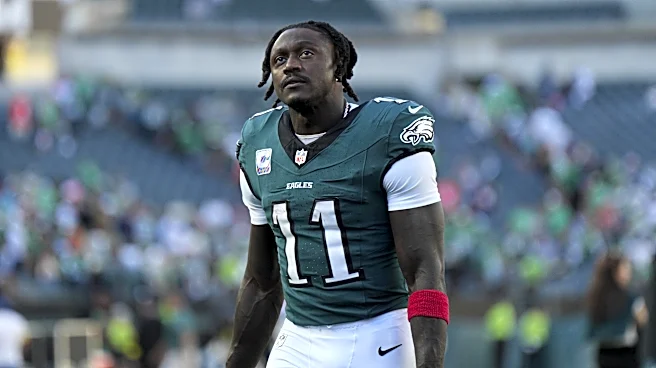
Brown receptions per game: 5.0
Brown receiving yards per game: 76.5
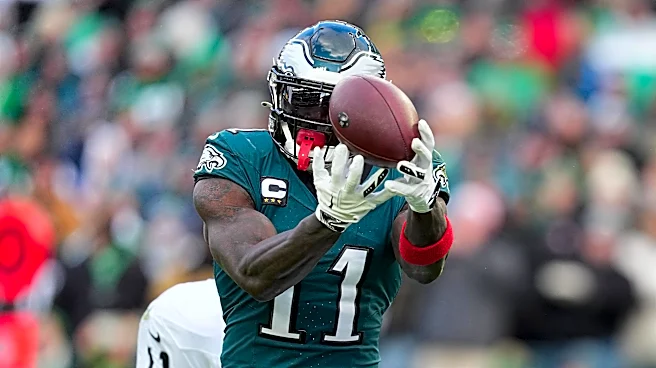
Brown has a career missed-tackle forced rate of 19.3%, which is incredibly high. Moore’s is 15.6%. Damn good too. Brown’s contested-catch win rate as a professional is 49.1%. Across seven seasons, that’s spectacular. In eight seasons, Moore’s is a stellar 48.6%.

But I’m not attempting to convince you that Moore has been a better receiver than Brown. He hasn’t. Like I wrote earlier, I’ve viewed him as a half-tier below Brown for the entire time they’ve been in the NFL together (since 2019). I will say this — Brown and Deebo Samuel have typified the “YAC monster” wide receiver label in the NFL, and I’ve always made a point to include Moore when writing or discussing that archetype.
Ultimately, you can decide how you view Brown vs. Moore.
The point of this article is to display how these trades compare from a cost perspective.
Believe it or not, NFL teams are still mostly utilizing the Jimmy Johnson chart when conducting transactions that involve draft selections. Here’s how these two receiver trades compare:
Brown-to-Patriots deal – Jimmy Johnson draft trade chart
2028 first-round pick (valued at No. 48, the 16th pick in Round 2 of ‘28) = 420 points
2027 fifth-round pick = 29
Total: 429 points
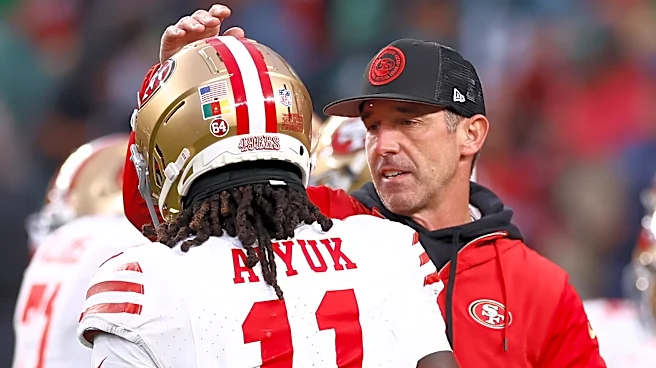
The Bills got DJ Moore for the equivalent of the last pick in the second round (No. 64 overall).
Moore-to-Bills deal: – Jimmy Johnson draft trade chart
No. 64 overall: 270
I must mention a gray area here — there’s no set rule that accompanies the Johnson chart when picks more than a year out are featured in the trade. The general rule of thumb centers on moving down one whole round and using the middle selection (pick No. 16) in said round in the future. Some swaps adhere to the last pick in the next round. In other occasions, the trade parameters closely align with the first pick in the following round.
Despite the NFL almost universally following the Johnson chart rather closely, there’s much more inconsistency team-to-team and trade-to-trade when it comes to these somewhat rare swaps that include the-year-after-next picks.
Here’s what the Brown trade looks like on the Johnson chart if the 2028 first-round pick is valued with the last selection in the second round:
Brown-to-Patriots deal – Jimmy Johnson draft trade chart
2028 first-round pick (valued at No. 64, the 32nd pick in Round 2 of ‘28) = 270 points
2027 fifth-round pick = 29
Total: 299 points
Now, considering the Eagles likely expect the Patriots to be a playoff-caliber team in each of the next two seasons, they could reasonably assume the first-round pick they acquired in the Brown deal in two years will land somewhere in the 20s or 30s, so the second example above is probably closer the framework utilized to consummate this trade.
Ironically, the Bills received a fifth-rounder a long with Moore (which Buffalo used in its third trade down of the first round in late April), while the Patriots had to send a fifth-round pick to add Brown to their roster. That fifth-round pick is the value difference of this trade.
Now you know — neither team came out like bandits relative to the other in these acquiring-a-receiver trades. Naturally, because Brown has been a better wideout, the Patriots paid a little more.