

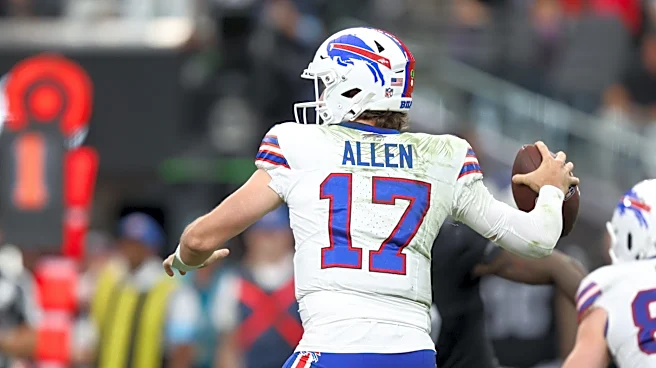

Recently I dared to askthe question, “is this the worst defense Josh Allen has ever been paired with on the Buffalo Bills?” Somehow I managed to stretch “yes” into more than 1,500 words. I’m hoping you read some of them, but if not check it out hereas I’ll be skipping a lot of the methodology to answer the mirror question:
Is this the best offense in the Josh Allen era?
Of course there’s a cool chart in a second
For the brief version of the methodology, I took seven rate stats that I feel all have some indicator of “being good at football”
and put them into a chart for the Josh Allen years. Rather than the raw stats though, I also give the league ranking that year for each metric in parentheses and give each season a total score (low is better) to try to compare across the years. Here’s the chart…

Why these metrics? I kept them the same as the defensive ones, but here’s the quick shakedown if you don’t want to click into my other piece:
- Points per drive – It’s hard to make a case that anything else truly matters aside from giving context to this one.
- Yards per drive – Twofold measure. This helps you score points, but also gives your defense more dirt to defend when you don’t.
- Time per drive – On offense I see this Defensive Helper. Limiting the other team from having chances to score is a good thing. For just the offense, the result of the drive is the result of the drive, but holding the ball can be good for your team.
- Scoring percent – Arguably I don’t need this one in here with points per drive already in the mix, but it’s a good context builder.
- Turnover percent – Just like this one is. You could use the difference between scoring percent and 100% to get a pure failure rate, but this gives the measure of how likely the offense is careless, not simply “bad.”
- Sack rate – If other metrics show they’re overcoming this, this is a metric that’s deemphasized. That said, it’s an OK measure of how prone the quarterback is to taking a beating.
- Third down conversion rate – I like this as a clutch factor. How successful are you when it’s all on the line.
So what’s the verdict?
I tend to explain the method a lot on these articles because really, the chart is often all most of you need. If you care for my interpretation, it’s really hard to say with certainty which year has been the absolute best with Josh Allen. I think it’s clear we can rule out his first two, but after that you have some tight competition.
Interestingly, if we use the scoring method on faith, it’s clearly the 2024 season with the rating of 35. Tangent alert: If you can believe it, using this same method, the 2021 defense has the MOST elite season on either side of the ball with a score of 24. It’s likely splitting hairs between 24 and 35 as this type of system doesn’t usually lead to a linear relationship on the numeric rating, but it’s wild to think that the defense that year might arguably be as good or even better than any Josh Allen-led offense.
Wrapping up the tangent, when some of us say that if the defense hadn’t elected to have their worst game of the season in the AFC Championship game the Bills would have won the Super Bowl, this is a graph version of what our gut already knew.
Back to rating the offenses though, the 2024 season was the one Allen won MVP so it checks out that it should be the best and that’s an anecdotal piece of evidence to support that.
All that said…
The whole idea of the offense is to score points and that does lend itself to this season. Not only (so far at least) is it the only season where the Bills lead the league in that measure, it’s a huge leap ahead of their other seasons. I would also ask you to consider time per drive. While I do believe holding the ball is a benefit all other things aside, that’s to help the overall team. This article is about the best OFFENSE. Not only are the Bills scoring significantly higher per drive than the 2024 season, but they’re holding the ball for shorter periods of time.
I want to be fair to my rule of four. Time per drive in 2024 and 2026 are both average, so there’s no huge gulf there. That said, there’s still a gap within average and you can’t avoid that the 2026 Bills are scoring more and doing it faster. If the defense can sort a few things out and just reach average, the Bills could become even more lethal in points scored if they can maintain this.
Ultimately, there’s a good argument between the two seasons but I’m supposed to have an opinion.
If you don’t mind a drumroll in your head…
I pick the current year. The Bills are getting dinged in my measure for the aforementioned time per drive which again, all things equal it’s better to hold onto the ball but it’s a team metric and if I were to weight these numbers this might be the lowest priority. They’re also getting dinged for turnover percentage and sack rate. Let’s discuss those real quick.
In sack rate, I don’t love Josh Allen getting hit more than he needs to, but that’s not a given that this results in injury. So far, the lost yardage from the average sack rate is being easily overcome. It’s not ideal, but it’s hard to say it’s hurting the NUMBER ONE SCORING OFFENSE!
For turnover rate, I hinted at my rationale above. Turnover rate shows a certain recklessness and adds volatility into the offense which ain’t good. That said, turnovers are only ONE type of drive failure and many fans have argued over the years should be lumped in with punts. That’s a point with some validity, but that’s a debate for another time.
For now I’ll just reiterate that by far the easiest way to get a drive “failure rate” is to simply subtract the scoring percentage from 100%. So while it’s true that the Bills have a high turnover rate, they have an absurdly high scoring percentage, getting points on 57.1% of drives.
How absurd is 57.1% though? I think it needs some context. In the Josh Allen era, it’s about 50/50 each season where a team even hits the 50% mark. Only Kansas City in 2018 broke the 52% barrier, scoring on 52.6% of their drives.
We may as well put points per drive into context too. Most years since Allen has been in the league have not had a team score over 3.0 points per drive over the season. That same 2018 Kansas City team had 3.12, the closest to the Bills current rate.
I don’t want to crown the Bills too early. There’s still plenty of season to play, but if they can keep up their current offensive pace, I’m 100% on board with calling this the best Josh Allen offense we’ve seen yet.