


Honestly, the fact that San Antonio lost ranks fourth or fifth on my list of most troubling facts about last night’s game. By far the most serious issue is Dylan Harper’s injury, as he has been absolutely essential in this playoff run and clearly the second-best Spur in the series so far. The second most vexing problem has been San Antonio’s proclivity for turnovers, especially since many of them were unforced and they unequivocally cost the Spurs the game. In any case, one silver lining is that last night’s box
score is unusual and interesting in several ways, so let’s dive in:
Note: Now that we’ve moved into the postseason, the reference period used for grading changes from the set of regular season games since 2012-2013 to the set of postseason games since 2012-2013. Unless otherwise noted below, this set DOES include play-in games. As of the end of May 20, 2026, this group include 1,193 games.

Factors that decided the game
- For as complicated and messy as the game appeared to be at times, the key issues deciding the game are actually quite clear.
- First, San Antonio’s shooting efficiency surpassed OKC’s (albeit by tiny-to-modest margins) from everywhere; in fact, in recent NBA history it has been quite rare for a team to win a playoff game with the FG%, 3P%, and FT% margins that the Thunder had (more on that below).
- Furthermore, OKC didn’t enjoy any notable advantage in rebounding; they did record one more offensive board, but San Antonio won the defensive glass by five (largely because the Thunder took more shots).
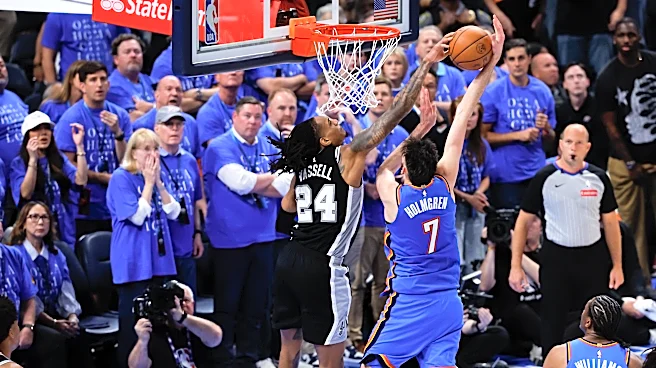
- Quite simply, the Spurs’ turnovers were devastating. Because OKC had 11 fewer giveaways, they had more opportunities to score, both from the field and at the free throw line. Most importantly, the Thunder enjoyed a FGA margin of +10, which allowed them to make four more shots despite having a lower FG%.
- On top of their advantage from the field, OKC had a FTA margin of +7, partly because of a terrible rash of fouls by the Spurs in the fourth quarter. This allowed the Thunder to extend their lead by four points from the charity stripe despite having a lower FT%.
Rare Box Score Stats
- Let’s start with team stats from the graded box score. Everything mentioned in this section captures the frequency of different statistical combinations in the 1,193 postseason games played since 2012-2013 (i.e., the “reference period”):
- This is the 30th game in which the winning team had a turnover margin of -11 or better.
- Given such a favorable turnover margin, it’s actually a bit shocking that OKC didn’t win in a blowout. In fact, they became just the eighth winner with a turnover margin of -11 or better and a point differential no greater than +9.
- San Antonio became just the eighth loser to log FG%, 3P%, and FT% values at least as good as 48.81%, 40%, and 88.24%, respectively.
- There were A LOT of offensive rebounds in this game, with 16 for the Spurs and 17 for OKC. In fact, this is just the 22nd contest in the reference period in which at least 33 offensive boards were recovered (that’s about 1.76% of the 1,193 postseason games played in this period, or roughly 1-in-54).
- The offensive rebounding numbers are especially surprising when you consider that both teams logged a pretty good FG%, so there weren’t a huge amount of rebounds to be had. In fact, there is just ONE other contest in the reference period in which 33+ offensive boards were recorded with both teams shooting at least 47.87% from the field. That other game was another OKC win, this time over Minnesota in Game 4 of the 2025 Western Conference Finals.
- The Thunder became just the 11th winner in the reference period to log FG%, 3P%, and FT% differentials as bad or worse as -0.94, -3.89, and -9.07 percentage points, respectively.
- Now let’s turn to stats for individual Spurs, which includes some good news and bad news:
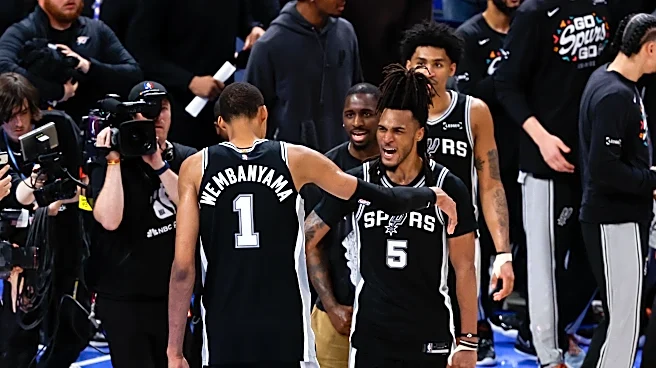
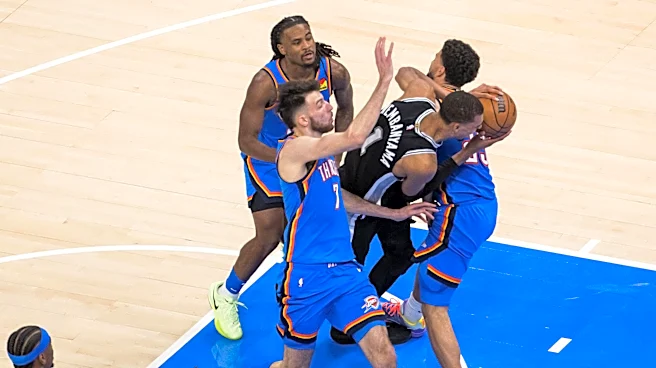
- Wemby recorded just the 15th instance since the 1996-1997 postseason in which a player pulled down 41+ rebounds over two consecutive playoff games (this is excluding play-in games). Available data do not capture how many times a player has done this with Isaiah Hartenstein BLATANTLY HOLDING his off arm at all times, but I assume that this number is much lower.
- Sadly, Stephon Castle has become the first player across all true playoff games since 1996-1997 to run up a total of 20 turnovers over tow consecutive games. The previous high was 17, a former record shared by LeBron James and Cade Cunningham.
What are Team Graded Box Scores?
Very briefly, these box scores grade winner-loser differentials for basic box score statistics, with the grade being based on the winning team’s differential relative to other NBA winners during a defined reference period. Think of it like a report card for understanding how a given winner performed relative to other winners. The reference period used runs from the start of the 2012-2013 season to the latest date of play, including only games in the same season category (i.e., regular season and playoff games are not compared to each other).
Data Source: The underlying data used to create these box scores was collected from Basketball Reference. In all cases, the data are collected the morning after the game is played. Although rare, postgame statistical revisions after data collection do occur and may affect the results after the fact.