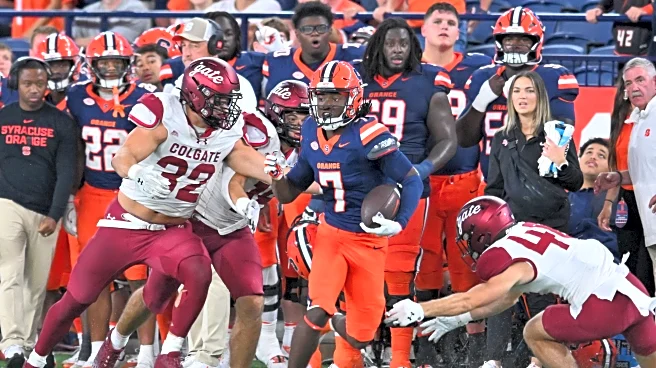
Obviously facing an FCS opponent makes things easier, but the Syracuse offense was a lot more explosive on Friday night.
The running game without Yasin Willis left a lot to be desired, but Syracuse was
able to hit some big chunk plays in the passing game all night long. Darrell Gill, Jr. took advantage of single coverage on the outside and made the Raiders pay.
Ten different Orange receivers caught first down passes and as the competition level rises again, it is important for Syracuse to keep spreading the ball around to keep defenses off-balance. I know people want to establish the run and get more balance, but if teams are going to take away the running game on early downs, throwing quick passes can pull the safeties back away and let the backs have more run to operate.
Graphing College Football gives us a good visual look at the success by down from this game. The 3rd down numbers are incredible and it’s a lot easier to convert if you give yourself a better chance by gaining yards on early downs. Can the Orange avoid negative plays this week and keep the Clemson defensive line from getting an all-out pass rush? We will see..
SR and XR by Down body { font-family: -apple-system, BlinkMacSystemFont, 'Segoe UI', 'Roboto', sans-serif; margin: 0; padding: 20px; background: #f8fafc; } .chart-container { background: white; border-radius: 12px; border: 1px solid #e5e5e5; box-shadow: 0 1px 3px rgba(0, 0, 0, 0.1); overflow: hidden; } .chart-header { padding: 18px 24px 16px; border-bottom: 1px solid #e5e5e5; background: white; } .chart-title { font-size: 18px; font-weight: 600; color: #171717; margin: 0; } .chart-content { padding: 20px 24px 24px !important; } @media (max-width: 640px) { .chart-content { padding: 12px 16px 20px !important; } .chart-header { padding: 12px 16px 12px !important; } .embed-footer-top { padding: 8px 12px !important; } .data-definitions { padding: 12px !important; } body { padding: 12px !important; } } .chart-content.top-receivers { height: 624px; } .chart-content.top-passers { height: 280px !important; } .chart-content.top-rushers { height: 372px; } .chart-content:not(.top-receivers):not(.top-passers):not(.top-rushers) { height: 372px; } .embed-footer { border-top: 1px solid #e5e5e5; font-size: 12px; color: #737373; } .embed-footer-top { display: flex; justify-content: space-between; align-items: center; padding: 12px 16px; } .embed-footer-link { color: #737373; text-decoration: none; font-weight: 500; } .embed-footer-link:hover { color: #525252; text-decoration: underline; } .data-definitions-toggle { background: none; border: none; color: #737373; font-size: 12px; font-weight: 500; cursor: pointer; display: flex; align-items: center; gap: 4px; padding: 0; } .data-definitions-toggle:hover { color: #525252; } .caret { transition: transform 0.2s ease; font-size: 10px; } .caret.expanded { transform: rotate(180deg); } .data-definitions { display: none; padding: 16px; background: #fafafa; border-top: 1px solid #e5e5e5; font-size: 12px; line-height: 1.4; } .data-definitions.expanded { display: block; } .data-definitions ul { margin: 0; padding-left: 0; list-style: none; } .data-definitions li { margin-bottom: 4px; }
// Toggle data definitions accordion - unique function per embed function toggleDefinitions_cfb_chart_1757978584479_oin4odnj5() { const definitions = document.getElementById('dataDefinitions_cfb-chart-1757978584479-oin4odnj5'); const caret = document.getElementById('caret_cfb-chart-1757978584479-oin4odnj5'); if (definitions.classList.contains('expanded')) { definitions.classList.remove('expanded'); caret.classList.remove('expanded'); } else { definitions.classList.add('expanded'); caret.classList.add('expanded'); } } // WordPress-safe chart initialization with defensive checks (function() { 'use strict'; function initChart() { // Check if Chart.js is available if (typeof Chart === 'undefined') { console.warn('Chart.js not loaded yet, retrying...'); setTimeout(initChart, 100); return; } // Check if datalabels plugin is available if (typeof ChartDataLabels === 'undefined') { console.warn('ChartDataLabels plugin not loaded yet, retrying...'); setTimeout(initChart, 100); return; } // Check if canvas element exists const canvas = document.getElementById('cfb-chart-1757978584479-oin4odnj5'); if (!canvas) { console.warn('Canvas element not found yet, retrying...'); setTimeout(initChart, 100); return; } // Prevent multiple chart instances if (canvas.chartInstance) { console.log('Chart already initialized'); return; } try { // Register the datalabels plugin Chart.register(ChartDataLabels); // Embed actual chart data directly const chartData = { "labels": [ "1st Down", "2nd Down", "3rd Down", "4th Down" ], "datasets": [ { "data": [ 0.15789473684210525, 0.21739130434782608, 0.2, 0 ], "stack": "Team", "label": "Syracuse XR", "backgroundColor": "rgba(128, 64, 0, 0.8)", "datalabels": { "display": false } }, { "data": [ 0.5263157894736842, 0.5652173913043478, 0.7, 0 ], "stack": "Team", "label": "Syracuse SR", "backgroundColor": "rgba(244, 140, 37, 0.8)", "datalabels": { "display": true } }, { "data": [ 0.08823529411764706, 0.07142857142857142, 0.058823529411764705, 0 ], "stack": "Opponent", "label": "Colgate XR", "backgroundColor": "rgba(126, 2, 6, 0.8)", "datalabels": { "display": false } }, { "data": [ 0.4411764705882353, 0.32142857142857145, 0.4117647058823529, 0 ], "stack": "Opponent", "label": "Colgate SR", "backgroundColor": "rgba(240, 40, 47, 0.8)", "datalabels": { "display": true } }, { "type": "line", "data": [ 0.42, 0.42, 0.42, 0.42 ], "label": "NCAA Avg SR", "borderColor": "#757575", "borderWidth": 2, "borderDash": [ 3, 3 ], "pointRadius": 0, "datalabels": { "display": false } }, { "type": "line", "data": [ null, null, null, null ], "label": "# Plays", "backgroundColor": "rgba(0, 0, 0, 0)", "borderColor": "rgba(0, 0, 0, 0)", "borderWidth": 0, "pointRadius": 0, "showLine": false, "fill": false, "datalabels": { "display": false } } ], "teamCounts": [ 38, 23, 10, 0 ], "oppCounts": [ 34, 28, 17, 2 ], "currentParams": { "year": 2025, "week": 3, "seasonType": "regular", "team": "Syracuse", "gameId": "401754532" } }; // Chart options (WordPress-safe) const chartOptions = { responsive: true, maintainAspectRatio: false, animation: { duration: 0 // Disable animations to prevent conflicts }, elements: 'bar' === 'line' ? 'down-bars'.includes('play-map') ? { line: { tension: 0, borderWidth: 0 } } : { line: { tension: 0.25, borderWidth: 2.2 }, point: { pointRadius: 'down-bars'.includes('team-lines') ? 0 : undefined } } : {}, plugins: { datalabels: { display: function(context) { // Suppress data labels on line charts if ('bar' === 'line') { return false; } return context.dataset.datalabels && context.dataset.datalabels.display === true; }, formatter: function(value, context) { // Special handling for Overall Team Performance chart if ('down-bars' === 'overall-team-performance' && context.dataset.label === 'Success Rate (SR)') { // Use the stored play count data if (context.dataset.playCountData && context.dataset.playCountData[context.dataIndex]) { return context.dataset.playCountData[context.dataIndex]; } // Fallback to percentage if play count data not available return Math.round(value * 100) + '%'; } // Handle bar charts with count data (play-type, quarter, down, etc.) if (context.dataset.label && context.dataset.label.includes(' SR') && (chartData.teamCounts || chartData.oppCounts)) { // Find the first team SR dataset in the chart to determine team order const allDatasets = context.chart.data.datasets; const teamSRDataset = allDatasets.find(d => d.label && d.label.includes(' SR') && !d.label.includes('NCAA')); // If this is the first team's SR dataset, use teamCounts if (teamSRDataset && context.dataset.label === teamSRDataset.label && chartData.teamCounts) { return chartData.teamCounts[context.dataIndex] || 0; } // Otherwise, use oppCounts for the second team else if (chartData.oppCounts) { return chartData.oppCounts[context.dataIndex] || 0; } } // For player charts, show value only if > 0 (matches non-embedded behavior) if ('down-bars'.includes('top-rushers') || 'down-bars'.includes('top-passers') || 'down-bars'.includes('top-receivers')) { // Hide data labels for zero or negative values, show actual value for positive values return value > 0 ? value : null; } // For other charts, show values based on type if (typeof value === 'number') { // If value is between 0 and 1, treat as percentage if (value >= 0 && value 0 ? '#26262660' : 'transparent'; }, borderColor: function(context) { const value = context.dataset.data[context.dataIndex]; return value > 0 ? 'rgba(255, 255, 255, 0.2)' : 'transparent'; }, borderRadius: 4, align: 'center', anchor: 'center' }, legend: 'bar' === 'line' ? { position: 'top', align: 'start', labels: 'down-bars'.includes('play-map') ? { usePointStyle: true, generateLabels: function(chart) { // Call the original generateLabels to get default styling const original = Chart.defaults.plugins.legend.labels.generateLabels; const labels = original.call(this, chart); // Filter and customize each label const filteredLabels = labels.filter(label => { return !label.text.includes(' { const dataset = chart.data.datasets[label.datasetIndex]; if (dataset && dataset.label) { if (dataset.label.includes('Rush')) { label.pointStyle = 'circle'; label.pointStyleWidth = 4; label.fillStyle = 'white'; } else if (dataset.label.includes('Pass')) { label.pointStyle = 'triangle'; label.pointStyleWidth = 4; label.fillStyle = 'white'; } else { label.pointStyle = 'rect'; label.pointStyleWidth = 4; label.fillStyle = 'white'; } } }); return filteredLabels; }, boxWidth: 20, padding: 12 } : { usePointStyle: false, boxWidth: 12, boxHeight: 12, padding: 12, generateLabels: function(chart) { const original = Chart.defaults.plugins.legend.labels.generateLabels; const labels = original.call(this, chart); // Filter out reference areas and ensure white fill const filteredLabels = labels.filter(label => { return !label.text.includes('NCAA Avg SR') && !label.text.includes('50/50') && !label.text.includes('Quarters'); }); // Ensure white fill for all line chart legend boxes filteredLabels.forEach((label) => { label.fillStyle = 'white'; }); return filteredLabels; } } } : { position: 'top', align: 'start', labels: { usePointStyle: false, boxWidth: 12, boxHeight: 12, padding: 12, filter: function(legendItem, chartData) { return !legendItem.text.includes('NCAA Avg SR') && !legendItem.text.includes('Quarters') && !legendItem.text.includes('50/50'); }, generateLabels: function(chart) { const data = chart.data; if (data.datasets.length) { return data.datasets.map((dataset, i) => { // Handle backgroundColor arrays (like in Overall Team Performance chart) let fillColor = dataset.backgroundColor; if (dataset.label === '# Plays') { fillColor = 'white'; } else if (Array.isArray(dataset.backgroundColor)) { // For datasets with backgroundColor arrays, use the first color for legend fillColor = dataset.backgroundColor[0]; } return { text: dataset.label, fillStyle: fillColor, strokeStyle: dataset.label === '# Plays' ? '#666' : dataset.borderColor, lineWidth: dataset.label === '# Plays' ? 1 : dataset.borderWidth, hidden: !chart.isDatasetVisible(i), datasetIndex: i }; }).filter((item, index) => { // Apply the same filter logic as above const dataset = chart.data.datasets[index]; if (!dataset || !dataset.data) return false; if (dataset.label === '# Plays') return true; // Always show # Plays if (dataset.label && (dataset.label.includes('NCAA Avg SR') || dataset.label.includes('Quarters') || dataset.label.includes('50/50'))) return false; return dataset.data.some((value) => value > 0); }); } return []; } } }, tooltip: { filter: function(tooltipItem) { if ('down-bars'.includes('play-map')) { return !tooltipItem.dataset.label.includes('< 0') && !tooltipItem.dataset.label.includes('Quarters') && !tooltipItem.dataset.label.includes('Drive'); } return !tooltipItem.dataset.label.includes('NCAA Avg SR') && !tooltipItem.dataset.label.includes('50/50') && !tooltipItem.dataset.label.includes('< 0') && !tooltipItem.dataset.label.includes('Quarters'); }, callbacks: { label: function(context) { const label = context.dataset.label || ''; let labelText; // Play maps show yards instead of percentages if ('down-bars'.includes('play-map')) { labelText = label + ': ' + context.parsed.y + ' yards'; } else { const value = Math.round(context.parsed.y * 100); labelText = label + ': ' + value + '%'; } // For line charts, include play text if available if ('bar' === 'line' && context.raw && context.raw.text) { return [labelText, context.raw.text]; } return labelText; } } } }, scales: 'bar' === 'line' ? 'down-bars'.includes('play-map') ? { x: { type: 'linear', position: 'bottom', title: { display: true, text: 'Play Number' }, min: 1, ticks: { stepSize: 1, callback: function(value) { return Math.floor(value); } }, grid: { display: false } }, y: { title: { display: true, text: 'Yards Gained' }, min: chartData.minY, max: chartData.maxY } } : { x: { type: 'linear', position: 'bottom', title: { display: true, text: 'down-bars'.includes('team-lines') ? 'Play Number' : 'Team Play Number' }, min: 1, ticks: { stepSize: 1, callback: function(value) { return Math.floor(value); } }, grid: { display: false } }, y: { max: 1, min: 0, ticks: { callback: function(value) { return Math.round(value * 100) + '%'; } } } } : 'down-bars'.includes('drive-metrics') ? { y: { stacked: false, max: 1, ticks: { callback: function(value) { return Math.round(value * 100) + '%'; } } }, y1: { display: false, type: 'linear', position: 'right' } } : ('down-bars'.includes('top-rushers') || 'down-bars'.includes('top-passers') || 'down-bars'.includes('top-receivers')) ? { x: { stacked: true }, y: { stacked: true } } : { y: { max: 1, min: 0, stacked: false, ticks: { callback: function(value) { return Math.round(value * 100) + '%'; } } } } }; // Add indexAxis for player charts if ('down-bars'.includes('top-rushers') || 'down-bars'.includes('top-passers') || 'down-bars'.includes('top-receivers')) { chartOptions.indexAxis = 'y'; } // Initialize the chart const ctx = canvas.getContext('2d'); const chart = new Chart(ctx, { type: 'bar', data: chartData, options: chartOptions }); // Store reference to prevent re-initialization canvas.chartInstance = chart; console.log('CFB Chart initialized successfully'); } catch (error) { console.error('Error initializing CFB chart:', error); // Fallback: show error message in canvas container const container = document.getElementById('cfb-chart-1757978584479-oin4odnj5').parentNode; if (container) { container.innerHTML = '
Chart failed to load. Please refresh the page.
'; } } } // Initialize when DOM is ready if (document.readyState === 'loading') { document.addEventListener('DOMContentLoaded', initChart); } else { initChart(); } // Also try initialization after a short delay for WordPress compatibility setTimeout(initChart, 500); })();