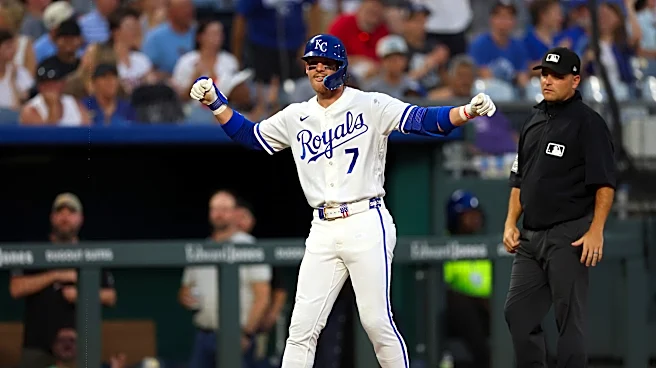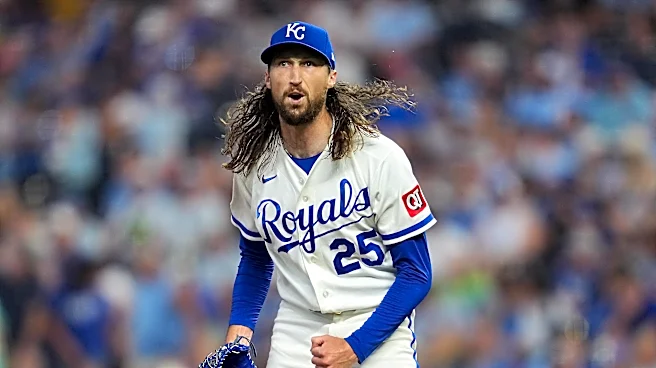



The 2026 Kansas City Royals are bad at a lot of things, which is why they are a squad flirting with a 100-loss pace. But though things like the offense remain an issue, we knew that would be the case. Rather, the biggest reason why this year’s Royals are so awful is the bullpen, which has been seventeen levels of atrocious thus far.
Looking at the bullpen’s league rank in regards to some key statistics is enough to make you queasy. They rank dead last—that’s 30th out of 30 teams—in Fielding Independent
Pitching (FIP), Wins Above Replacement (WAR, per Fangraphs), and strikeout rate minus walk rate (K-BB%). They rank 29th in ERA, batting average against, and average fastball velocity. It has been bad.
How bad? How do they compare against other awful Royals bullpens? And is this the worst Royals bullpen of all time? There are a few measuring sticks we can use to try and get to the bottom of this. Here’s what I’m going to consider, ranking bullpen futility by the average ranking of these five stats amongst the 32 Royals bullpens since 1995:
- ERA-: Raw ERA doesn’t account for the run scoring environment. ERA- does, though. An ERA- of 100 means a team’s ERA is league average. Each point below 100 means one percentage point better than league average. Each point above 100 means one percentage point worse than league average.
- FIP-: Just like ERA-, FIP- uses the same scale. Including FIP allows us to ignore defense, because let’s be honest, there have been a lot of very bad Royals defenses impacting how pitchers have done.
- BB%: Strikeout rates have gone up a lot over the years, but walk rates haven’t quite as much, so it’s a better comparison tool across the decades. How often to relievers give batters free passes in close games?
- WAR/500 IP: I’m using Fangraphs’ version of WAR for this, which is tied to FIP but also takes into account replacement level production for each year as well as innings pitched. We’re normalizing this to 500 innings pitched.
- WPA per inning: WPA stands for Win Probability Added, and it’s a metric that looks at a team’s chance of winning from one event to the next. You can add up all the events that a bullpen contributes to and see how impactful those events are. I’m including innings pitched, too, so we can easily see how much negative impact these bullpens have in win probability for each inning they pitch.
A qualification, also: I’m only looking at bullpens since 1995, the first full year after the strike. Why? Go much further back and the game is just too different. In 1993, for instance, 55 starting pitchers threw three or more complete games. Last year, zero starters did. The 1980s have an even wider gulf between total number of starter and reliever innings. So we’ll keep this sample size to 30-odd years.
Honorable Mentions: 2018, 2000, 2009
All three of these years had an average ranking among my statistic cocktail above 25, and these were not pleasant years. 2018 featured the implosion of Brandon Maruer and Burch Smith, 2000 featured Jason Rakers and Andy Larkin, and who could forget the trio of Juan Cruz, Roman Colon, and John Bale from 2009.
5th worst Royals bullpen: 2023
- ERA-: 30th (118)
- FIP-: 27th (108)
- BB%: 27th (10.9%)
- WAR/500: 26th (0.48)
- WPA/IP: 29th (-1.27%)
- Average: 27.8
The Royals lost 106 games, tied for a franchise record, in 2023, and you don’t lose that many games if you’ve got a good bullpen. As we all know from experiencing this squad in the recent past, they did not. Carlos Hernandez and Taylor Clarke led the way with 63 and 56 innings, respectively, of batting practice after the starter led the game. But they weren’t the only ones; a whopping seven different bullpen arms threw at least 13 innings with a 5.94 ERA or worse.
What saved this team from being further down on the list was some honest-to-goodness greatness from Aroldis Chapman and some solid performances by Amir Garrett, Austin Cox, and Alec Marsh.
4th worst Royals bullpen: 2002
- ERA-: 24th (111)
- FIP-: 26th (108)
- BB%: 27th (11.2%)
- WAR/500: 28th (-0.2)
- WPA/IP: 31st (-1.35%)
- Average: 27.8
When my family moved to Kansas City from Cleveland in 2000, I remember asking an elementary school classmate about the Royals around then. “I don’t know,” they said. “They’ve gotten a lot of different players recently.”
That response has stuck in my head for a quarter century. Anyway, the 2002 bullpen features some guys who hadn’t been in Kansas City very long, as well as some guys who would have very short careers. It had some competence with Jason Grimsley and Roberto Hernandez, who managed 26 saves. This was also Jeremy Affeldt’s rookie season, and he was solid. But then you had guys like Cory Bailey, who threw 46 innings where he somehow managed to walk more than he struck out, and that’s not even considering the eight (8!) guys who threw 11 or more innings and whose ERA was 6.12 or worse.
3rd worst Royals bullpen: 2006
- ERA-: 31st (119)
- FIP-: 29th (111)
- BB%: 22nd (10.5%)
- WAR/500: 29th (-1.1)
- WPA/IP: 30th (-1.34%)
- Average: 28.2
This is classic Royals suck. Ambriorix Burgos notching 18 saves and tossing 70 innings with a 5.60 ERA. Andrew Sisco walking everyone he met. Mike Wood throwing 30 innings of an underwater strikeout-to-walk ratio. Scott Dohmann coming over from Colorado and somehow doing worse. Jimmy Gobble.
Hey, we got Affeldt again. He was pretty good. Joel Peralta wasn’t bad. Did you remember that Peralta’s rookie season happened in 2005 at age 29 and then he kept pitching until 2016??? I did not. The more you know. And the less you think about this season the better.
2nd worst Royals bullpen: 1999
- ERA-: 27th (114)
- FIP-: 30th (115)
- BB%: 28th (10.9%)
- WAR/500: 31st (-2.5)
- WPA/IP: 32nd (-2.25%)
- Average: 29.6
The 1999 bullpen lived on the razor’s edge all year, and it generally did not work out for them. Of their 12 pitchers with at least 10 innings out of the bullpen, only one—Scott Service—had a K-BB% above 5%. What does that mean? A lot of baserunners. A lot of batted balls. And a lot of poor results.
This team was the worst Royals squad, by far, in win probability added. When calculated on a per inning basis, the bullpen had a -2.25% WPA. On average. For the whole year. Incredible. And it reflects in the macro data: the 1999 Royals squad went a hideous 11-32 in one-run games. That’s worse than the 2005 and 2023 squads.
Two guys really stand out here. The aforementioned Service threw 75 innings with a 6.09 ERA. And in the final year of his career, Jeff Montgomery limped through his 51.1 innings with a 6.84 ERA. But beyond them, this was a team that just didn’t have any legitimately good options.
Worst Royals bullpen of all time: 2026
- ERA-: 32nd (125)
- FIP-: 32nd (127)
- BB%: 31st (11.3%)
- WAR/500: 32nd (-4.3)
- WPA/IP: 28th (-1.19%)
- Average: 31
Yes, indeed: this year’s bullpen is pretty definitively the worst Royals bullpen of all time.
As a unit, they rank last among all Royals bullpens in ERA- and FIP-; compared to their other teams this year, they’ve just been awful. They rank second-to-last in walk rate, providing free passes 11.3% of the time, which is…a lot. And though we don’t have fastball velo going back through all the years I was looking at, we do for this year, and the 2026 Royals bullpen has the second-lowest velo out of any team, which. It tracks.
The sheer amount of different pitchers who have been shelled this year is almost unbelievable. A whopping 10 different guys, not even counting Tyler Tolbert and his 4.2 innings, have an ERA north of 5.00. And the peripherals of their key pitchers has been horrific; of their five guys with 40 or more innings this year, only one has an FIP below 4.44, and that person is now in the rotation, I guess.
We’re witnessing history, folks. Just not the kind we want.