


There’s no arguing that the Diamondbacks offense has taken a step back this season. Last year, they ranked sixth overall in runs per game at 4.88. This season, after last night’s extra-innings loss, they are below league average (4.38 vs. 4.47). And if you break it down further, to the individual level, perhaps the biggest concern is with Ketel Marte. The All-Star and Silver Slugger winner last year, was on the bench yesterday, but has seen his performance at the plate crater, going from an OPS+
of 145 to just 70. I’ve already seen comments wishing the team had traded Marte this winter. But how much of this concern is justified.
Certainly, looking at the basic numbers, Marte is having a very poor season: by purely offensive WAR, he is actually slightly below replacement level, at -0.1 oWAR. He is batting just .209, with an OPS of .614. His K-rate is a career high 19.5%, while his walk rate has dropped to 6.7%, Ketel’s lowest since the pandemic-shortened season in 2020. However, it is true to say that the significance is magnified because it being the start of the season. Here are two streaks from Marte’s career, both covering a period of 35 games.
Streak A: .207/.265/.386, 5 HR, 10 BB, 35 SO
Streak B: .209/.262/.353, 5 HR, 10 BB, 29 SO
Streak B is, obviously enough, his current one. But Streak A comes from 2024 – when he was also an All-Star, won the Silver Slugger and came third in MVP balloting. The difference? Streak A didn’t come at the start of the season. When the slump started on April 21, Marte was batting .344 with .985. That provided a cushion: even at the end of the streak on June 1, his season OPS was still .781. Also, while both streaks had the same number of hits (29), Ketel somehow managed to have a 21-game hitting streak during the slump, and was only hitless in nine of the 35 games. This year, the ohfers have been considerably more common: 15 of 35 games.
What’s also significant is the underlying numbers suggest Ketel has been unlucky. It is generally accepted that the majority of what hitters can control is to make hard contact. Wee Willie Keeler’s maxim of “Hit ’em where they ain’t,” might sound nice. But when you’re facing a procession of hurlers with 98 mph fastballs, you will have very little control over where the pitch goes. Some balls will be hit at fielders, other will not. Over the course of a season, these should even out, and a player’s BABIP – batting average on balls in play, excluding home-runs, strikeouts and walks – tends to be relatively consistent.
We see this with Marte. From 2023-25, his BABIP was in the .290-.300 range: that’s right around MLB average of .295. But this season, it has cratered to .229. That’s ranked 164th of the 179 qualified batters this year. Now there are reasons why BABIP can drop for a batter. If his batting profile changes from line-drives to fly-balls, BABIP will drop, because fly-balls are much less likely to become hits. So let’s split up what has happened to Marte’s balls in play, into ground balls, fly balls and line drives. Below is what has happened to the pitches in each category, both last year and this:
The split hasn’t changed dramatically from last year, at least not away from line drives. In 2025, it was GB 41%; FB 37%; LD 22%. In 2026, it is GB 49%; FB 25%; LD: 25%. He is hitting a lot more ground balls rather than fly balls. But that should actually mean an increase in batting average, because ground balls are more likely to become hits than fly balls. Across all baseball last year, GB had a BABIP of .245; FB were at .091; and LD at .616. That’s why line drives are so key. But Marte’s GB and LD both have a below-average BABIP. If we give him an average BABIP in each category, we’re talking 9-10 extra hits. That’d get his average up to .277, and I am not writing this article.
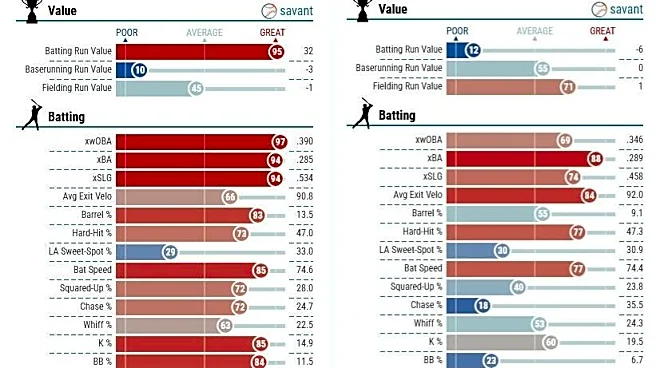
If we look at the Statcast data for last year and this we see something similar. There’s not a lot which would explain the decline in batting average. Here are the charts for Marte in 2025 and 2026.

There’s still an awful lot of red (= good) on Marte’s chart. His average exit velocity is actually up on last year, and the expected batting average is higher too. Bat speed is basically unchanged too. One thing I do note is the sharp increase in chase percentage, the percent of pitches outside of the zone at which a hitter swings. Last year, Ketel was considerably better than average in this category, but he is now in the bottom twenty percent for the metric. This does fit with the eye test, where we have all seen Marte, quite possibly, trying to slug his way out of the current situation. I’m sure Torey Lovullo has had the conversation. Whether Marte listens is another matter.
Because this apparent struggle with pitch recognition is actually a team-wide issue. For the Diamondbacks have the second-worst chase percentage (or, as Fangraphs calls it, O-Swing%) in the majors. When you’re fighting with the Rockies for #1, it’s rarely a good thing… Conversely, Arizona are 28th for percentage of the time they swing at pitches in the zone. While the latter hasn’t actually changed on last year, they were 14th in O-Swing% in 2025. It’s an issue, which I’d hope hitting coach Joe Mather is working diligently to address. Because right now, it appear the D-backs hitters appear to have take the name of their ballpark as an instruction…
[All blame credit to shoewizard for that last sentence!]