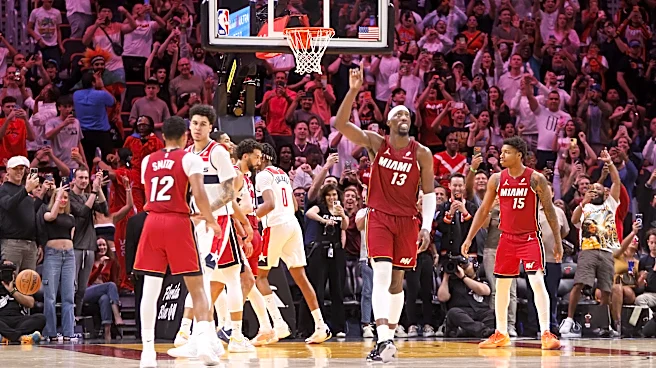


The Wizards lost to the Miami Heat last night but got strong performances from Bilal Coulibaly and Bub Carrington. The final tally was 140-117 — the third time this season the Heat scored 140 or more against the Wizards.
The shellacking was Washington’s 28th loss by 20 or more points this season. I might believe that number was made up except I watched virtually every minute of them.

The Miami Heat broadcast had some interesting tidbits about the Wizards. Like:
- The Wizards have the NBA’s worst overall record. They also have the worst record at home and on the road. Quite the triple crown.
- It’s Washington’s third straight season with fewer than 20 wins.
- Washington has used 50 different starting lineups in their 81 games so far this season.
Washington getting stomped by the Heat
was inevitable. As has been chronicled extensively, the Wizards want to lose to maximize their Draft Lottery odds. Miami wanted to win to improve their position in the NBA’s play-in games. The Wizards set their lineups and minutes distribution accordingly.
While the Wizards received a thorough butt kicking, there were some positives — Coulibaly, Carrington, and Brian Keefe.
Coulibaly was a classic “tough cover” — 25 points in 22 minutes, 5 rebounds, 5 assists. His usage rate was an astronomical 38.6% and his offensive rating (points produced per possession x 100) was 145. That’s a great game.
Carrington had trouble missing shots — 11-15 from the floor, 6-7 from three — en route to 30 points in 34 minutes. He even tossed some accurate lobs, including one to Anthony Gill.
As for Keefe, I’ve liked a lot of what I’ve seen schematically from Keefe this season, at least when the Wizards actually run sets as designed. Last night, there were a number of really clever and well-designed actions on display.
- First quarter, 6:26 — A simple (but effective) “get action.” Carrington passed the ball to JuJu Reese, then ran straight to him for a dribble hand off (DHO). It gave him a wide open three. This is a very old basketball play, and it endures because it works.
- First quarter, 5:32 — Carrington passed to Coulibaly on the wing and runs down to the corner in a classic clearout cut. Coulibaly passed the ball to Reese out top, and then immediately turned and set a pin down screen for Carrington, who sprinted all the way out to Reese at the top for a DHO and a wide open three. I love this play for a few reasons, including how it uses defender assumptions against him (when Carrington cleared out, his defender relaxed just a little because that cleared out guy is usually out of the play at that point). And it gave Carrington an open look from a favorite spot.
- Second quarter, 9:03 — This one was super smart. Miami went zone and Carrington made a normal baseline cut. He emerged on the weak side and came up to the wing. Completely normal action. Except, Will Riley made a similar cut behind him — trailing him to the weak side but going to the corner. The weak side defender picked up Carrington and followed him to the wing. That left Riley undefended in the corner where he got a wide open three-point attempt on the swing pass. He missed, but this is great play design.
- Third quarter, 9:28 — One of my favorite plays of the night — I’m calling it a horizontal Spain pick-and-roll. So, in a Spain pnr, a second screener comes into the action to screen for the original screener. Keefe and the Wizards turned it on its side. In this version, Carrington screened for Coulibaly and then cleared only to double back over a Reese screen into a wide open three from the top.
All this is to say, I’m looking forward to seeing what Keefe and the Wizards coaching staff can do when they’re playing to win.
Four Factors
Below are the four factors that decide wins and losses in basketball — shooting (efg), rebounding (offensive rebounds), ball handling (turnovers), fouling (free throws made).
The four factors are measured by:
- eFG% (effective field goal percentage, which accounts for the three-point shot)
- OREB% (offensive rebound percentage)
- TOV% (turnover percentage — turnovers divided by possessions)
- FTM/FGA (free throws made divided by field goal attempts)
Stats & Metrics
PPA is my overall production metric, which credits players for things they do that help a team win (scoring, rebounding, playmaking, defending) and dings them for things that hurt (missed shots, turnovers, bad defense, fouls).
PPA is a per possession metric designed for larger data sets. In small sample sizes, the numbers can get weird. In PPA, 100 is average, higher is better and replacement level is 45. For a single game, replacement level isn’t much use, and I reiterate the caution about small samples sometimes producing weird results.
POSS is the number of possessions each player was on the floor in this game.
ORTG = offensive rating, which is points produced per individual possessions x 100. League average so far this season is listed in the Four Factors table above. Points produced is not the same as points scored. It includes the value of assists and offensive rebounds, as well as sharing credit when receiving an assist.
USG = offensive usage rate. Average is 20%. Median so far this season is 17.7%.
ORTG and USG are versions of stats created by former Wizards assistant coach Dean Oliver and modified by me. ORTG is an efficiency measure that accounts for the value of shooting, offensive rebounds, assists and turnovers. USG includes shooting from the floor and free throw line, offensive rebounds, assists and turnovers.
+PTS = “Plus Points” is a measure of the points gained or lost by each player based on their efficiency in this game compared to league average efficiency on the same number of possessions. A player with an offensive rating (points produced per possession x 100) of 100 who uses 20 possessions would produce 20 points. If the league average efficiency is 115, the league — on average — would produced 23.0 points in the same 20 possessions. So, the player in this hypothetical would have a +PTS score of -3.0.
Players are sorted by total production in the game.