


The transfer portal as we know it changed in 2021, when the rule requiring athletes to sit a year was rescinded. That, plus NIL, led to transferring from being a rare occurrence to something expected. There are still plenty of questions, but now that it’s been a few years, there’s quite a bit of data to look over. Collegefootballdata.com has been a great resource for tracking all football players entering the portal, and has opened the door to some interesting research.
First, the number of players
entering the portal has shot up since that rule change was made:
*Year refers to the season the player entered the transfer portal, corresponding to the fall of that year
While this past cycle declined slightly, I’m not expecting that trend to continue. In 2025 there were still a number of players taking advantage of the extra year of eligibility due to the 2020 COVID season, so the number of total players was artificially inflated. But this likely could be the new norm, where every year 4,000 players enter the portal.
I’ve done some research on the transfer portal (here and here if you’re curious), and one theory I’ve had is that the schools in the power conferences are really the main driver in transfer portal activity. When you look at players transferring level (Group of 6 versus Power 4), you can see the power conferences make up the bulk of the transfer activity:
Of the 8,240 athletes who transferred within the FBS since 2022, 6,682 either went to or from a power conference school – nearly 80%. 3,092 went from one power conference school to another, compared to 2,907 leaving any G6 school, regardless of destination.
But that’s only looking at it in terms of total players leaving.
When I looked in the past, the vast majority of players entering the portal had little playing time, which makes sense; if you want to play college football, and you aren’t playing at your current school, see if you can play somewhere else. But what about in terms of talent? How do you measure the amount of talent that left? I’ve tried this in the past a few different ways, but with College Football Data I think I found a different way to look at it. I developed what I call the “Transfer Value” metric.
Transfer Value Method, Version 1.0
*If you don’t want to read how I did this, you can skip to the Too Long Didn’t Read (TLDR) paragraph; I won’t be offended. I took recruiting data from College Football Data. I do have interactive charts and spreadsheets you can look at first below, then come back to the methodology if you’re curious.
Methodology
Each player is given a rating when they enter the portal, similar to when they are recruited out of high school. The ratings referenced come from 247sports:
I did this to account for positional differences, and because the data was in a single location. I tried in the past to merge this with data from PFF to track snap counts, but it became too much of a challenge to accurately merge everything. Plus, the recruiting ratings reflected potential rather than accomplishments, which helps balance out everything. My formula for each player was to add their star rating plus their numeric rating. So for my example with Jackson Harris, who left Hawaii, his 3 stars and a numeric rating of 0.89 equaled transfer value of 3.89.
For quarterbacks I did an extra modification. They tend to get scouted more, and the original formula skewed in favor of highly recruited quarterbacks with little playing time. I took their total attempts from the prior year, divided them by 100, and multiplied that by their transfer value, with a max of 1.3 – that was the highest difference, percentage wise, between what quarterbacks in the NFL make compared to non-quarterbacks. I felt that was a way to adjust a quarterbacks value based on their usage, without being biased towards those in pass-heavy schemes. I then squared the final total to help magnify the difference between the best and worst players.
The overall team score was the sum of each player’s value. A lower score meant more talent was retained, which resulted in a higher grade.
As far as the grades, those are comparing how they did this past year to trends since 2021. A+ means very little talent left, F- means a lot of talent went out the door. Since this is based on historical trends, no school is guaranteed an A+ each year.
There were a few modifications I had to make.
- First, I only looked at players who switched schools. If they weren’t picked up in the portal, they likely were a player who would have ridden the bench, and consequently aren’t too difficult to replace. It also addressed the few cases where a player entered the portal and decided to return to their school.
- Second, while most players were given a star rating, not all were given a numeric rating (i.e. 0.98, 0.76). From what I found, this applied to players who didn’t get enough playing time to be properly scouted, and their star rating was largely based on what they did in high school. To address this, after playing around with some numbers I gave them a numeric rating of -.5. They get the high star rating to get credit for their potential, but are hurt for lack of playing time.
This admittedly isn’t a perfect way to look at this, isn’t meant to compare positions, and isn’t meant to quantify how much more value one player has than another. It’s a first step in trying to measure the value of players leaving through the portal. Ideally I’d look at NIL or other player income, but those numbers aren’t publicly available; anything you see online is an estimate, and collectives aren’t required to publish NIL funds (and I doubt they ever will). The main reason I did this was to try and compare losing a star player to losing several backup players. I call this version 1.0 because I plan on doing more to clean this up, so everything should be taken with a grain of salt.
TLDR
College Football Data tracks each player that entered the portal and ties it to their transfer rating according to 247sports. Players entering the portal get ratings, the same as high school recruits. From that, I quantified the amount of talent entering the portal and gave teams a grade. The more ‘talent’ that left, the lower the grade. A highly rated player entering the portal will result in more ‘talent’ leaving than a few players with little playing time. I gave each FBS school a letter grade relative to how they compared historically to other schools.
2026 Grades
For this year, I gave each school three grades: the first compares them to every other FBS school, second is just those in their current conference (so UNLV was not compared to Boise, for example), and third compares G6 to other G6 schools and P4 to other P4 schools. I excluded North Dakota State since they didn’t make the transition until after the portal closed and decided it wouldn’t be fair to include them.
You can look through those here:
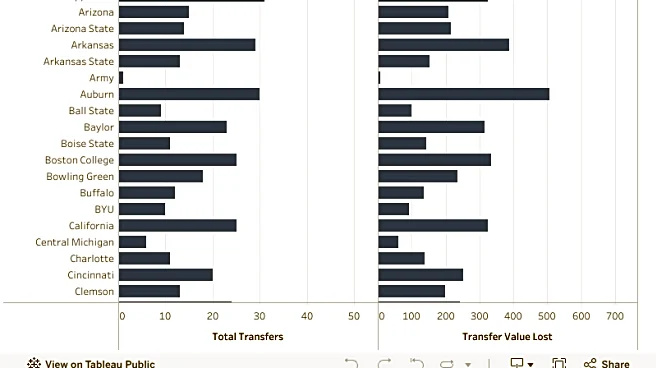
Or, if you are a visual person, here’s a dashboard you can play with. I included the Transfer Portal Value lost, as well as the number of outgoing students included. Again, I only included players who transferred to another FBS school. One thing you’ll find is Group of 6 schools, for the most part, did far better at retaining players. It’s a little misleading, depending how you look at it, because the P4 schools have more resources to replace those players. But what this does show is how much of the portal is dictated by players leaving and joining those P4 schools, and while it is harder for the Group of 6 to replace those players, P4 schools overall have more work to do. It’s a quantity vs quality issue. A G6 school is more likely to have to replace one of their five best starters, but a P4 school is more likely to have to replace five total starters.
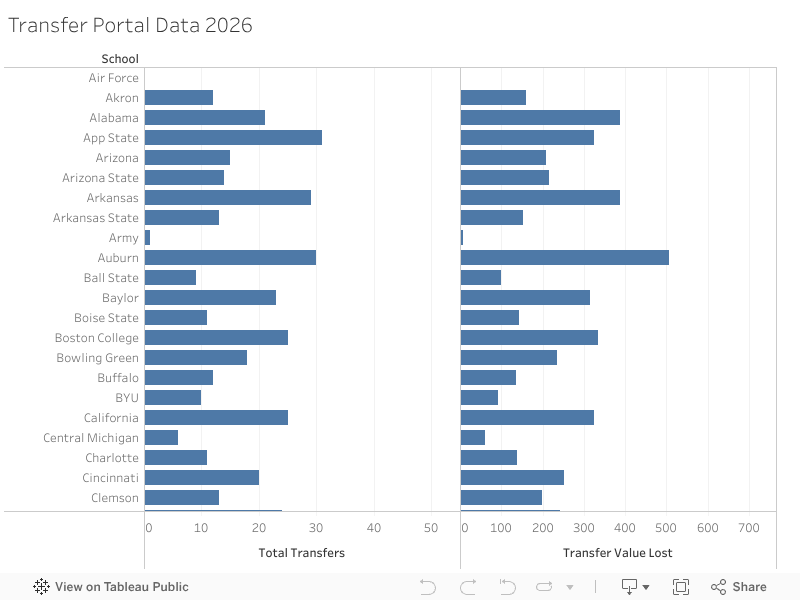
G6 schools had an average of 12.5 players leave, while P4 schools had 20. Going by my transfer value metric, P4 schools lost an average of nearly twice as much talent (287 to 157). When those P4 schools lost a player, they tend to replace them with a player from another P4 school. They do go to the G6, but only about half as often.
How the Mountain West/Pac-12 have done
Going off of my metric, the ‘West Coast’ schools have done relatively well at retaining players. Air Force has done best, but a lot of that is due to the unique nature of them being a military academy. Fresno, Hawaii, and New Mexico all got A+ grades from this last transfer cycle. The ones who did poorly coincidentally had changes at head coach: Colorado State, Oregon State, and Washington State. As far as how the conferences did as a whole:
The Mountain West and Pac-12 really did well at retaining players, which is impressive since they make up the bulk of the top end of the G6 schools. Now for the top players who left, by my transfer value metric:
Again, this is version 1.0. I’ll work on providing more and hopefully refine this.
What is the future of the transfer portal? Any chance of this slowing down?
Right now no one really knows what will happen. The main reason is there is no clear understanding of what rules can be implemented. A number of ideas have been thrown out that could work in theory, but as of now, if the NCAA implemented any of them, a lawsuit would likely be filed. But I have two guesses about what we’ll see over the next few years
Transfer Portal Activity will slow down
The legalities of what schools or the NCAA can do is murky when it comes to preventing players from moving. A couple of schools have filed lawsuits over players transferring, saying it violated part of an NIL agreement (you can review some here, here, and here). Right now it seems like they’ve either been settled or are ongoing, which doesn’t mean anything right now, but my guess is lawyers will use those cases as a means to make sense of what is and is not allowable. So much of the world of contracts and paying athletes is based on precedent, and the current state of college sports basically has zero precedent. As soon as someone makes a successful argument that a player shouldn’t have left a school, or shouldn’t have left without paying some type of fee based on a prior agreement, the consequences will be clear and enforceable, leading to fewer players entering the portal.
More Transfers from FCS to G6
Since a lot of P4 schools will pull from the G6, G6 schools might as well do the same thing and start pulling talent from the FCS, or even DII schools. It’s already happening:
Players like Hajj-Malik Williams and Danny Scudero are examples of notable players who came by way of a lower level of competition, including eight players who named first or second team All-Mountain West this past year. Now that transferring from those schools to the FBS grants them an extra year of eligibility, there’s even more of an incentive for these players to move up. It might sound harsh to pass the problem onto smaller schools, but sports is just as competitive off the field as it is on.
The Question is “When” the portal will slow down, not “If”
As much as the G6 schools at struggling with the transfer portal in terms of retaining talent, the P4 schools are dealing with it on a much larger scale. Some unofficial reports have coaches saying they’re not even involved in post season practices because they’re so busy trying to retain players and recruit others. Something will change, not because “it has to”, but because the schools with all the money don’t like the current setup. People can only deal with something unsatisfactory for so long. Again, the major roadblock is the legal issues of who can implement rules, but these types of issues only go for so long until someone finds a solution that most are happy with.