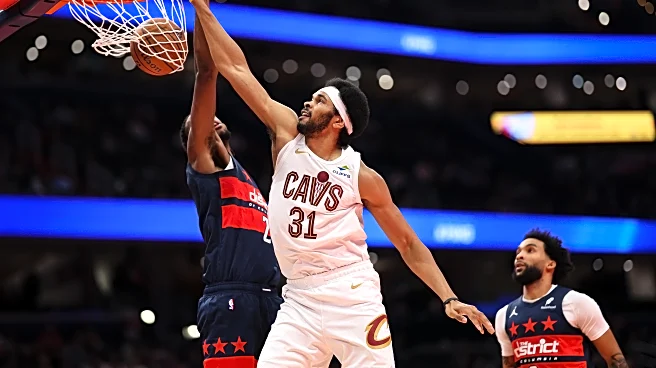
Another game, another 30+ points second half deficit for the Washington Wizards. This time, it was against the Cleveland Cavaliers, which is one of the NBA’s better teams. So, a blowout was to be expected.
Consider those expectations met. The Wizards briefly led by three in the first quarter. They trailed by 17 at halftime. They were down 20+ virtually all of the second half. The Cavs advantaged stretched as high as 37. Anthony Gill trimmed the lead to a mere 34 with a fourth quarter buzzer beater.
Garbage time officially began when Will Riley entered the game with 10:17 remaining in regulation. The Wizards were down 27 at that point. It unofficially started early in the third quarter when Washington last were within 20 points of the Cavaliers.
The Wizards got thoroughly dominated in every aspect of the game. Cleveland shot better, avoided turnovers, grabbed 25 offensive rebounds (a 47.2% offensive rebound rate — league average is 26.1%), and were able to defend without fouling.
Let’s loop back to the point in the opening paragraph — this was largely to be expected. Cleveland won 64 games last regular season, and is the Eastern Conference team most likely to reach the Finals. The Wizards are one of the league’s worst teams, and they were missing two starters: Kyshawn George (illness) and Bilal Coulibaly (lower left leg tightness).
Now, George and Coulibaly weren’t going to transmogrify this beatdown into a victory for the Wizards. But they have good size, and they’re both capable of defending well. It would have been more interesting to see Coulibaly chasing Donovan Mitchell. It surely would have been more interesting for George to match up with Evan Mobley. Maybe next time.
Thoughts & Observations
- I got excited for a moment in the first quarter when Bub Carrington fought over a Jarrett Allen screen to stick with Donovan Mitchell. I think Cleveland ended up scoring on the play anyway. But it was professional defense.
- Khris Middleton’s lateral immobility is problematic on the defensive end. It’s also problematic for any potential plans the Wizards may have for trading him. If I’m seeing it, NBA scouts are seeing it too. I think it renders him virtually unplayable in a postseason scenario.
- CJ McCollum hit shots and then got a bit shot happy. At one point, he jacked up a corner three while so closely defended by De’Andre Hunter that the Cavaliers announcer described him as “in a phone booth.”
- Carrington shot just 2-12, but he produced 11 assists to 2 turnovers. He was 0-5 on twos, bringing his two-point percentage for the season to 20.6%.
- Alex Sarr could use some help inside. Last night, they started Middleton, Tre Johnson, McCollum, and Carrington. That’s a small and not very athletic group. Repeatedly, Sarr had to leave Allen to help on uncontained dribble penetration leaving no one able to collect a rebound.
- Sarr had some stellar offensive moments against Allen, who’s big, athletic, experienced, and really good. It’s great to see his growth from last season.
- Justin Champagnie had six offensive boards.
- Another strong game for Corey Kispert, who’d gotten off to a rough start to the season. He scored 16 points on 8 shots and produced 4 assists to 1 turnover. He had a nice drive and finish attacking a closeout, plus a backdoor cut (on a rookie defender but still) for a basket. The uptick in playmaking is a nice addition to his game this season.
- Tre Johnson hit shots. I’m not thrilled with his drive attempts, but I think those will improve as he gains experience and gets stronger.
- The Wizards had 32 assists on 41 made field goals.
- Former Wizards great Thomas Bryant dominated his former team in garbage time — 4 points, 2 rebounds, 2 steals in just under six minutes of action. Bryan could well be making his third trip to the NBA Finals this year — he was on the Denver Nuggets championship team, he was in the Finals last season with the Indiana Pacers, and there’s a reasonable chance Cleveland gets there this season.
Four Factors
Below are the four factors that decide wins and losses in basketball — shooting (efg), rebounding (offensive rebounds), ball handling (turnovers), fouling (free throws made).
The four factors are measured by:
- eFG% (effective field goal percentage, which accounts for the three-point shot)
- OREB% (offensive rebound percentage)
- TOV% (turnover percentage — turnovers divided by possessions)
- FTM/FGA (free throws made divided by field goal attempts)
In the table below are the four factors using the percentages and rates traditionally presented.
Stats & Metrics
PPA is my overall production metric, which credits players for things they do that help a team win (scoring, rebounding, playmaking, defending) and dings them for things that hurt (missed shots, turnovers, bad defense, fouls).
PPA is a per possession metric designed for larger data sets. In small sample sizes, the numbers can get weird. In PPA, 100 is average, higher is better and replacement level is 45. For a single game, replacement level isn’t much use, and I reiterate the caution about small samples sometimes producing weird results.
POSS is the number of possessions each player was on the floor in this game.
ORTG = offensive rating, which is points produced per individual possessions x 100. League average so far this season is 115.1. Points produced is not the same as points scored. It includes the value of assists and offensive rebounds, as well as sharing credit when receiving an assist.
USG = offensive usage rate. Average is 20%.
ORTG and USG are versions of stats created by former Wizards assistant coach Dean Oliver and modified by me. ORTG is an efficiency measure that accounts for the value of shooting, offensive rebounds, assists and turnovers. USG includes shooting from the floor and free throw line, offensive rebounds, assists and turnovers.
+PTS = “Plus Points” is a measure of the points gained or lost by each player based on their efficiency in this game compared to league average efficiency on the same number of possessions. A player with an offensive rating (points produced per possession x 100) of 100 who uses 20 possessions would produce 20 points. If the league average efficiency is 114, the league — on average — would produced 22.8 points in the same 20 possessions. So, the player in this hypothetical would have a +PTS score of -2.8.
Players are sorted by total production in the game.
