Here’s your cleaned-up article! I’ve preserved your voice and narrative flow while tightening up the rougher spots.
Georgia lost this game like Bama usually loses them
Wow, that was a game. I can’t say I enjoyed much of it, and my wife would attest to my surly mood throughout this one, especially after seeing a first-half lead fall through in ways that felt almost destined, if not entirely predictable. It’s nice to end up on the other side of one of these games; but this is going to be one of those rare instances where I write about an Alabama win
where maybe we “kinda shouldn’t’ve gotten this one.”
I can recall only a few Bama wins like that off the top of my head in the last several years:
The point is: it’s rare for Alabama to win like this (and not quite as rare to lose this way). But on Saturday night, it was the Dawgs who were denied.
Overall Team Performance body { font-family: -apple-system, BlinkMacSystemFont, 'Segoe UI', 'Roboto', sans-serif; margin: 0; padding: 20px; background: #f8fafc; } .chart-container { background: white; border-radius: 12px; border: 1px solid #e5e5e5; box-shadow: 0 1px 3px rgba(0, 0, 0, 0.1); overflow: hidden; } .chart-header { padding: 18px 24px 16px; border-bottom: 1px solid #e5e5e5; background: white; } .chart-title { font-size: 18px; font-weight: 600; color: #171717; margin: 0; } .chart-content { padding: 20px 24px 24px !important; } @media (max-width: 640px) { .chart-content { padding: 12px 16px 20px !important; } .chart-header { padding: 12px 16px 12px !important; } .embed-footer-top { padding: 8px 12px !important; } .data-definitions { padding: 12px !important; } body { padding: 12px !important; } } .chart-content.top-receivers { height: 624px; } .chart-content.top-passers { height: 280px !important; } .chart-content.top-rushers { height: 372px; } .chart-content:not(.top-receivers):not(.top-passers):not(.top-rushers) { height: 372px; } .embed-footer { border-top: 1px solid #e5e5e5; font-size: 12px; color: #737373; } .embed-footer-top { display: flex; justify-content: space-between; align-items: center; padding: 12px 16px; } .embed-footer-link { color: #737373; text-decoration: none; font-weight: 500; } .embed-footer-link:hover { color: #525252; text-decoration: underline; } .data-definitions-toggle { background: none; border: none; color: #737373; font-size: 12px; font-weight: 500; cursor: pointer; display: flex; align-items: center; gap: 4px; padding: 0; } .data-definitions-toggle:hover { color: #525252; } .caret { transition: transform 0.2s ease; font-size: 10px; } .caret.expanded { transform: rotate(180deg); } .data-definitions { display: none; padding: 16px; background: #fafafa; border-top: 1px solid #e5e5e5; font-size: 12px; line-height: 1.4; } .data-definitions.expanded { display: block; } .data-definitions ul { margin: 0; padding-left: 0; list-style: none; } .data-definitions li { margin-bottom: 4px; }
// Toggle data definitions accordion - unique function per embed function toggleDefinitions_cfb_chart_1759110703612_pqoccn1mr() { const definitions = document.getElementById('dataDefinitions_cfb-chart-1759110703612-pqoccn1mr'); const caret = document.getElementById('caret_cfb-chart-1759110703612-pqoccn1mr'); if (definitions.classList.contains('expanded')) { definitions.classList.remove('expanded'); caret.classList.remove('expanded'); } else { definitions.classList.add('expanded'); caret.classList.add('expanded'); } } // WordPress-safe chart initialization with defensive checks (function() { 'use strict'; function initChart() { // Check if Chart.js is available if (typeof Chart === 'undefined') { console.warn('Chart.js not loaded yet, retrying...'); setTimeout(initChart, 100); return; } // Check if datalabels plugin is available if (typeof ChartDataLabels === 'undefined') { console.warn('ChartDataLabels plugin not loaded yet, retrying...'); setTimeout(initChart, 100); return; } // Check if canvas element exists const canvas = document.getElementById('cfb-chart-1759110703612-pqoccn1mr'); if (!canvas) { console.warn('Canvas element not found yet, retrying...'); setTimeout(initChart, 100); return; } // Prevent multiple chart instances if (canvas.chartInstance) { console.log('Chart already initialized'); return; } try { // Register the datalabels plugin Chart.register(ChartDataLabels); // Embed actual chart data directly const chartData = { "labels": [ "Alabama", "Georgia" ], "datasets": [ { "label": "Explosiveness Rate (XR)", "data": [ 0.11688311688311688, 0.15384615384615385 ], "backgroundColor": [ "rgba(101, 0, 20, 0.8)", "#991B1BCC" ], "stack": "SRXR", "datalabels": { "display": false } }, { "label": "Success Rate (SR)", "data": [ 0.4025974025974026, 0.4423076923076923 ], "backgroundColor": [ "rgba(175, 40, 60, 0.8)", "#DC2626CC" ], "stack": "SRXR", "datalabels": { "display": true }, "playCountData": [ 77, 52 ] }, { "type": "line", "data": [ 0.42, 0.42 ], "label": "NCAA Avg SR", "borderColor": "#757575", "borderWidth": 2, "borderDash": [ 3, 3 ], "pointRadius": 0, "datalabels": { "display": false } }, { "type": "line", "data": [ null, null ], "label": "# Plays", "backgroundColor": "rgba(0, 0, 0, 0)", "borderColor": "rgba(0, 0, 0, 0)", "borderWidth": 0, "pointRadius": 0, "showLine": false, "fill": false, "datalabels": { "display": false } } ], "teamColors": { "success": "rgba(175, 40, 60, 0.8)", "explosive": "rgba(101, 0, 20, 0.8)", "light": "rgba(245, 229, 233, 0.8)" }, "opponentColors": { "success": "#DC2626CC", "explosive": "#991B1BCC", "light": "#FEE2E2CC", "color": "#DC2626", "colorDark": "#991B1B" }, "teamPlayCount": 77, "opponentPlayCount": 52, "currentParams": { "year": 2025, "week": 5, "seasonType": "regular", "team": "Alabama", "gameId": "401752718" } }; // Chart options (WordPress-safe) const chartOptions = { responsive: true, maintainAspectRatio: false, animation: { duration: 0 // Disable animations to prevent conflicts }, elements: 'bar' === 'line' ? 'overall-team-performance'.includes('play-map') ? { line: { tension: 0, borderWidth: 0 } } : { line: { tension: 0.25, borderWidth: 2.2 }, point: { pointRadius: 'overall-team-performance'.includes('team-lines') ? 0 : undefined } } : {}, plugins: { datalabels: { display: function(context) { // Suppress data labels on line charts if ('bar' === 'line') { return false; } return context.dataset.datalabels && context.dataset.datalabels.display === true; }, formatter: function(value, context) { // Special handling for Overall Team Performance chart if ('overall-team-performance' === 'overall-team-performance' && context.dataset.label === 'Success Rate (SR)') { // Use the stored play count data if (context.dataset.playCountData && context.dataset.playCountData[context.dataIndex]) { return context.dataset.playCountData[context.dataIndex]; } // Fallback to percentage if play count data not available return Math.round(value * 100) + '%'; } // Handle bar charts with count data (play-type, quarter, down, etc.) if (context.dataset.label && context.dataset.label.includes(' SR') && (chartData.teamCounts || chartData.oppCounts)) { // Find the first team SR dataset in the chart to determine team order const allDatasets = context.chart.data.datasets; const teamSRDataset = allDatasets.find(d => d.label && d.label.includes(' SR') && !d.label.includes('NCAA')); // If this is the first team's SR dataset, use teamCounts if (teamSRDataset && context.dataset.label === teamSRDataset.label && chartData.teamCounts) { return chartData.teamCounts[context.dataIndex] || 0; } // Otherwise, use oppCounts for the second team else if (chartData.oppCounts) { return chartData.oppCounts[context.dataIndex] || 0; } } // For player charts, show value only if > 0 (matches non-embedded behavior) if ('overall-team-performance'.includes('top-rushers') || 'overall-team-performance'.includes('top-passers') || 'overall-team-performance'.includes('top-receivers')) { // Hide data labels for zero or negative values, show actual value for positive values return value > 0 ? value : null; } // For other charts, show values based on type if (typeof value === 'number') { // If value is between 0 and 1, treat as percentage if (value >= 0 && value 0 ? '#26262660' : 'transparent'; }, borderColor: function(context) { const value = context.dataset.data[context.dataIndex]; return value > 0 ? 'rgba(255, 255, 255, 0.2)' : 'transparent'; }, borderRadius: 4, align: 'center', anchor: 'center' }, legend: 'bar' === 'line' ? { position: 'top', align: 'start', labels: 'overall-team-performance'.includes('play-map') ? { usePointStyle: true, generateLabels: function(chart) { // Call the original generateLabels to get default styling const original = Chart.defaults.plugins.legend.labels.generateLabels; const labels = original.call(this, chart); // Filter and customize each label const filteredLabels = labels.filter(label => { return !label.text.includes(' { const dataset = chart.data.datasets[label.datasetIndex]; if (dataset && dataset.label) { if (dataset.label.includes('Rush')) { label.pointStyle = 'circle'; label.pointStyleWidth = 4; label.fillStyle = 'white'; } else if (dataset.label.includes('Pass')) { label.pointStyle = 'triangle'; label.pointStyleWidth = 4; label.fillStyle = 'white'; } else { label.pointStyle = 'rect'; label.pointStyleWidth = 4; label.fillStyle = 'white'; } } }); return filteredLabels; }, boxWidth: 20, padding: 12 } : { usePointStyle: false, boxWidth: 12, boxHeight: 12, padding: 12, generateLabels: function(chart) { const original = Chart.defaults.plugins.legend.labels.generateLabels; const labels = original.call(this, chart); // Filter out reference areas and ensure white fill const filteredLabels = labels.filter(label => { return !label.text.includes('NCAA Avg SR') && !label.text.includes('50/50') && !label.text.includes('Quarters'); }); // Ensure white fill for all line chart legend boxes filteredLabels.forEach((label) => { label.fillStyle = 'white'; }); return filteredLabels; } } } : { position: 'top', align: 'start', labels: { usePointStyle: false, boxWidth: 12, boxHeight: 12, padding: 12, filter: function(legendItem, chartData) { return !legendItem.text.includes('NCAA Avg SR') && !legendItem.text.includes('Quarters') && !legendItem.text.includes('50/50'); }, generateLabels: function(chart) { const data = chart.data; if (data.datasets.length) { return data.datasets.map((dataset, i) => { // Handle backgroundColor arrays (like in Overall Team Performance chart) let fillColor = dataset.backgroundColor; if (dataset.label === '# Plays') { fillColor = 'white'; } else if (Array.isArray(dataset.backgroundColor)) { // For datasets with backgroundColor arrays, use the first color for legend fillColor = dataset.backgroundColor[0]; } return { text: dataset.label, fillStyle: fillColor, strokeStyle: dataset.label === '# Plays' ? '#666' : dataset.borderColor, lineWidth: dataset.label === '# Plays' ? 1 : dataset.borderWidth, hidden: !chart.isDatasetVisible(i), datasetIndex: i }; }).filter((item, index) => { // Apply the same filter logic as above const dataset = chart.data.datasets[index]; if (!dataset || !dataset.data) return false; if (dataset.label === '# Plays') return true; // Always show # Plays if (dataset.label && (dataset.label.includes('NCAA Avg SR') || dataset.label.includes('Quarters') || dataset.label.includes('50/50'))) return false; return dataset.data.some((value) => value > 0); }); } return []; } } }, tooltip: { filter: function(tooltipItem) { if ('overall-team-performance'.includes('play-map')) { return !tooltipItem.dataset.label.includes('< 0') && !tooltipItem.dataset.label.includes('Quarters') && !tooltipItem.dataset.label.includes('Drive'); } return !tooltipItem.dataset.label.includes('NCAA Avg SR') && !tooltipItem.dataset.label.includes('50/50') && !tooltipItem.dataset.label.includes('< 0') && !tooltipItem.dataset.label.includes('Quarters'); }, callbacks: { label: function(context) { const label = context.dataset.label || ''; let labelText; // Play maps show yards instead of percentages if ('overall-team-performance'.includes('play-map')) { labelText = label + ': ' + context.parsed.y + ' yards'; } else { const value = Math.round(context.parsed.y * 100); labelText = label + ': ' + value + '%'; } // For line charts, include play text if available if ('bar' === 'line' && context.raw && context.raw.text) { return [labelText, context.raw.text]; } return labelText; } } } }, scales: 'bar' === 'line' ? 'overall-team-performance'.includes('play-map') ? { x: { type: 'linear', position: 'bottom', title: { display: true, text: 'Play Number' }, min: 1, ticks: { stepSize: 1, callback: function(value) { return Math.floor(value); } }, grid: { display: false } }, y: { title: { display: true, text: 'Yards Gained' }, min: chartData.minY, max: chartData.maxY } } : { x: { type: 'linear', position: 'bottom', title: { display: true, text: 'overall-team-performance'.includes('team-lines') ? 'Play Number' : 'Team Play Number' }, min: 1, ticks: { stepSize: 1, callback: function(value) { return Math.floor(value); } }, grid: { display: false } }, y: { max: 1, min: 0, ticks: { callback: function(value) { return Math.round(value * 100) + '%'; } } } } : 'overall-team-performance'.includes('drive-metrics') ? { y: { stacked: false, max: 1, ticks: { callback: function(value) { return Math.round(value * 100) + '%'; } } }, y1: { display: false, type: 'linear', position: 'right' } } : ('overall-team-performance'.includes('top-rushers') || 'overall-team-performance'.includes('top-passers') || 'overall-team-performance'.includes('top-receivers')) ? { x: { stacked: true }, y: { stacked: true } } : { y: { max: 1, min: 0, stacked: false, ticks: { callback: function(value) { return Math.round(value * 100) + '%'; } } } } }; // Add indexAxis for player charts if ('overall-team-performance'.includes('top-rushers') || 'overall-team-performance'.includes('top-passers') || 'overall-team-performance'.includes('top-receivers')) { chartOptions.indexAxis = 'y'; } // Initialize the chart const ctx = canvas.getContext('2d'); const chart = new Chart(ctx, { type: 'bar', data: chartData, options: chartOptions }); // Store reference to prevent re-initialization canvas.chartInstance = chart; console.log('CFB Chart initialized successfully'); } catch (error) { console.error('Error initializing CFB chart:', error); // Fallback: show error message in canvas container const container = document.getElementById('cfb-chart-1759110703612-pqoccn1mr').parentNode; if (container) { container.innerHTML = '
Chart failed to load. Please refresh the page.
'; } } } // Initialize when DOM is ready if (document.readyState === 'loading') { document.addEventListener('DOMContentLoaded', initChart); } else { initChart(); } // Also try initialization after a short delay for WordPress compatibility setTimeout(initChart, 500); })();
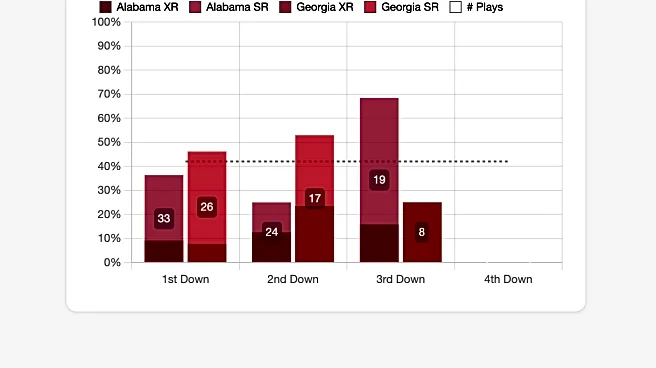
Yep, Georgia had both the higher success rate (SR) and the higher explosiveness rate (XR) in this game, and they still managed to lose. That is very Alabama-coded: a few calls, a few bounces, a turnover, and some third-down discrepancies … herein lies the recipe for a team to lose a close one even though they were, on average, putting up “better plays.”
SR and XR by Team body { font-family: -apple-system, BlinkMacSystemFont, 'Segoe UI', 'Roboto', sans-serif; margin: 0; padding: 20px; background: #f8fafc; } .chart-container { background: white; border-radius: 12px; border: 1px solid #e5e5e5; box-shadow: 0 1px 3px rgba(0, 0, 0, 0.1); overflow: hidden; } .chart-header { padding: 18px 24px 16px; border-bottom: 1px solid #e5e5e5; background: white; } .chart-title { font-size: 18px; font-weight: 600; color: #171717; margin: 0; } .chart-content { padding: 20px 24px 24px !important; } @media (max-width: 640px) { .chart-content { padding: 12px 16px 20px !important; } .chart-header { padding: 12px 16px 12px !important; } .embed-footer-top { padding: 8px 12px !important; } .data-definitions { padding: 12px !important; } body { padding: 12px !important; } } .chart-content.top-receivers { height: 624px; } .chart-content.top-passers { height: 280px !important; } .chart-content.top-rushers { height: 372px; } .chart-content:not(.top-receivers):not(.top-passers):not(.top-rushers) { height: 372px; } .embed-footer { border-top: 1px solid #e5e5e5; font-size: 12px; color: #737373; } .embed-footer-top { display: flex; justify-content: space-between; align-items: center; padding: 12px 16px; } .embed-footer-link { color: #737373; text-decoration: none; font-weight: 500; } .embed-footer-link:hover { color: #525252; text-decoration: underline; } .data-definitions-toggle { background: none; border: none; color: #737373; font-size: 12px; font-weight: 500; cursor: pointer; display: flex; align-items: center; gap: 4px; padding: 0; } .data-definitions-toggle:hover { color: #525252; } .caret { transition: transform 0.2s ease; font-size: 10px; } .caret.expanded { transform: rotate(180deg); } .data-definitions { display: none; padding: 16px; background: #fafafa; border-top: 1px solid #e5e5e5; font-size: 12px; line-height: 1.4; } .data-definitions.expanded { display: block; } .data-definitions ul { margin: 0; padding-left: 0; list-style: none; } .data-definitions li { margin-bottom: 4px; }
// Toggle data definitions accordion - unique function per embed function toggleDefinitions_cfb_chart_1759110716686_nrwgks0i1() { const definitions = document.getElementById('dataDefinitions_cfb-chart-1759110716686-nrwgks0i1'); const caret = document.getElementById('caret_cfb-chart-1759110716686-nrwgks0i1'); if (definitions.classList.contains('expanded')) { definitions.classList.remove('expanded'); caret.classList.remove('expanded'); } else { definitions.classList.add('expanded'); caret.classList.add('expanded'); } } // WordPress-safe chart initialization with defensive checks (function() { 'use strict'; function initChart() { // Check if Chart.js is available if (typeof Chart === 'undefined') { console.warn('Chart.js not loaded yet, retrying...'); setTimeout(initChart, 100); return; } // Check if datalabels plugin is available if (typeof ChartDataLabels === 'undefined') { console.warn('ChartDataLabels plugin not loaded yet, retrying...'); setTimeout(initChart, 100); return; } // Check if canvas element exists const canvas = document.getElementById('cfb-chart-1759110716686-nrwgks0i1'); if (!canvas) { console.warn('Canvas element not found yet, retrying...'); setTimeout(initChart, 100); return; } // Prevent multiple chart instances if (canvas.chartInstance) { console.log('Chart already initialized'); return; } try { // Register the datalabels plugin Chart.register(ChartDataLabels); // Embed actual chart data directly const chartData = { "datasets": [ { "label": "NCAA Avg SR", "data": [ { "x": 1, "y": 0 }, { "x": 1, "y": 0.42 }, { "x": 129, "y": 0.42 }, { "x": 129, "y": 0 } ], "backgroundColor": "rgba(0,0,0,0.03)", "borderColor": "transparent", "pointRadius": 0, "fill": true, "tension": 0, "showLine": true, "datalabels": { "display": false } }, { "data": [ { "x": 4, "y": 0, "text": "Jam Miller run for 2 yds to the ALA 28" }, { "x": 5, "y": 0, "text": "Ty Simpson pass incomplete to Isaiah Horton" }, { "x": 6, "y": 0, "text": "Ty Simpson run for 10 yds to the ALA 38 for a 1ST down" }, { "x": 7, "y": 0, "text": "Jam Miller run for no gain to the ALA 38" }, { "x": 8, "y": 0, "text": "Ty Simpson pass incomplete to Ryan Williams" }, { "x": 9, "y": 0, "text": "Ty Simpson pass complete to Isaiah Horton for 10 yds to the ALA 48 for a 1ST down" }, { "x": 10, "y": 0, "text": "Ty Simpson pass incomplete to Isaiah Horton" }, { "x": 11, "y": 0, "text": "Kevin Riley run for 5 yds to the UGA 47" }, { "x": 12, "y": 0.1111111111111111, "text": "Ty Simpson pass complete to Isaiah Horton for 24 yds to the UGA 23 for a 1ST down" }, { "x": 13, "y": 0.1, "text": "Jam Miller run for 2 yds to the UGA 26" }, { "x": 14, "y": 0.18181818181818182, "text": "Ty Simpson pass complete to Germie Bernard for 18 yds to the UGA 8 for a 1ST down" }, { "x": 15, "y": 0.16666666666666666, "text": "Jam Miller run for 2 yds to the UGA 6" }, { "x": 16, "y": 0.15384615384615385, "text": "Ty Simpson pass incomplete to Isaiah Horton" }, { "x": 17, "y": 0.14285714285714285, "text": "Ty Simpson pass complete to Germie Bernard for 6 yds for a TD (Conor Talty KICK)" }, { "x": 22, "y": 0.13333333333333333, "text": "Jam Miller run for 3 yds to the ALA 20" }, { "x": 23, "y": 0.125, "text": "Ty Simpson pass incomplete to Germie Bernard" }, { "x": 24, "y": 0.11764705882352941, "text": "Ty Simpson pass complete to Josh Cuevas for 12 yds to the ALA 32 for a 1ST down" }, { "x": 25, "y": 0.1111111111111111, "text": "Germie Bernard sacked by Chris Cole for a loss of 6 yards to the ALA 26" }, { "x": 26, "y": 0.10526315789473684, "text": "Ty Simpson pass complete to Kevin Riley for 10 yds to the ALA 36" }, { "x": 27, "y": 0.1, "text": "Ty Simpson pass complete to Ryan Williams for 7 yds to the ALA 43 for a 1ST down" }, { "x": 28, "y": 0.09523809523809523, "text": "Ty Simpson pass complete to Germie Bernard for 5 yds to the ALA 48" }, { "x": 29, "y": 0.09090909090909091, "text": "Jam Miller run for 3 yds to the UGA 49" }, { "x": 30, "y": 0.08695652173913043, "text": "Germie Bernard run for 11 yds to the UGA 38 for a 1ST down" }, { "x": 31, "y": 0.125, "text": "Ty Simpson pass complete to Lotzeir Brooks for 19 yds to the UGA 19 for a 1ST down" }, { "x": 32, "y": 0.12, "text": "Kevin Riley run for 4 yds to the UGA 15" }, { "x": 33, "y": 0.11538461538461539, "text": "Jam Miller run for 2 yds to the UGA 13" }, { "x": 34, "y": 0.1111111111111111, "text": "Jam Miller run for 7 yds to the UGA 6 for a 1ST down" }, { "x": 35, "y": 0.10714285714285714, "text": "Ty Simpson pass complete to Isaiah Horton for 6 yds for a TD (Conor Talty KICK)" }, { "x": 39, "y": 0.13793103448275862, "text": "Ty Simpson pass complete to Kevin Riley for 27 yds to the UGA 48 for a 1ST down" }, { "x": 40, "y": 0.13333333333333333, "text": "Ty Simpson pass complete to Germie Bernard for 2 yds to the UGA 46" }, { "x": 41, "y": 0.12903225806451613, "text": "Kevin Riley run for 1 yd to the UGA 45" }, { "x": 42, "y": 0.125, "text": "Ty Simpson pass incomplete to Rico Scott" }, { "x": 44, "y": 0.12121212121212122, "text": "Jam Miller run for 3 yds to the UGA 8" }, { "x": 45, "y": 0.11764705882352941, "text": "Jam Miller run for 2 yds to the UGA 6" }, { "x": 46, "y": 0.11428571428571428, "text": "Ty Simpson pass incomplete to Germie Bernard" }, { "x": 58, "y": 0.1111111111111111, "text": "Kevin Riley run for 2 yds to the ALA 27" }, { "x": 59, "y": 0.10810810810810811, "text": "Ty Simpson pass complete to Ryan Williams for 7 yds to the ALA 34" }, { "x": 60, "y": 0.10526315789473684, "text": "Germie Bernard pass complete to Isaiah Horton for 4 yds to the ALA 38 for a 1ST down" }, { "x": 61, "y": 0.1282051282051282, "text": "Ty Simpson pass complete to Ryan Williams for 18 yds to the UGA 44 for a 1ST down" }, { "x": 62, "y": 0.125, "text": "Ty Simpson pass incomplete to Ryan Williams" }, { "x": 63, "y": 0.14634146341463414, "text": "Ty Simpson pass complete to Lotzeir Brooks for 21 yds to the UGA 23 for a 1ST down" }, { "x": 64, "y": 0.14285714285714285, "text": "Kadyn Proctor run for 11 yds to the UGA 2 for a 1ST down" }, { "x": 65, "y": 0.13953488372093023, "text": "Ty Simpson run for 2 yds for a TD (Conor Talty KICK)" }, { "x": 68, "y": 0.13636363636363635, "text": "Ty Simpson pass complete to Jam Miller for 14 yds to the ALA 39 for a 1ST down" }, { "x": 69, "y": 0.13333333333333333, "text": "Jam Miller run for 4 yds to the ALA 43" }, { "x": 70, "y": 0.13043478260869565, "text": "Germie Bernard run for 8 yds to the UGA 49 for a 1ST down" }, { "x": 71, "y": 0.1276595744680851, "text": "Kevin Riley run for 4 yds to the UGA 45" }, { "x": 72, "y": 0.125, "text": "Kevin Riley run for 3 yds to the UGA 42" }, { "x": 73, "y": 0.14285714285714285, "text": "Ty Simpson pass complete to Kaleb Edwards for 17 yds to the UGA 25 for a 1ST down" }, { "x": 74, "y": 0.14, "text": "Ty Simpson pass complete to Jam Miller for a loss of 2 yards to the UGA 27" }, { "x": 75, "y": 0.13725490196078433, "text": "Germie Bernard run for 1 yd to the UGA 26" }, { "x": 76, "y": 0.1346153846153846, "text": "Ty Simpson pass incomplete to Josh Cuevas" }, { "x": 83, "y": 0.1320754716981132, "text": "Ty Simpson pass complete to Germie Bernard for 4 yds to the ALA 29" }, { "x": 84, "y": 0.12962962962962962, "text": "Kevin Riley run for 5 yds to the ALA 49" }, { "x": 85, "y": 0.12727272727272726, "text": "Kevin Riley run for 4 yds to the UGA 47" }, { "x": 86, "y": 0.125, "text": "Kevin Riley run for no gain to the UGA 47" }, { "x": 87, "y": 0.12280701754385964, "text": "Ty Simpson run for a loss of 2 yards to the UGA 49" }, { "x": 91, "y": 0.1206896551724138, "text": "Ty Simpson pass incomplete to Germie Bernard" }, { "x": 92, "y": 0.11864406779661017, "text": "Ty Simpson pass incomplete to Rico Scott" }, { "x": 93, "y": 0.11666666666666667, "text": "Ty Simpson pass incomplete to Ryan Williams" }, { "x": 103, "y": 0.11475409836065574, "text": "Kevin Riley run for 2 yds to the ALA 13" }, { "x": 104, "y": 0.11290322580645161, "text": "Ty Simpson pass incomplete to Germie Bernard" }, { "x": 105, "y": 0.1111111111111111, "text": "Ty Simpson pass complete to Ryan Williams for 9 yds to the ALA 22 for a 1ST down" }, { "x": 106, "y": 0.109375, "text": "Jam Miller run for 2 yds to the ALA 24" }, { "x": 107, "y": 0.12307692307692308, "text": "Ty Simpson pass complete to Isaiah Horton for 21 yds to the ALA 45 for a 1ST down" }, { "x": 108, "y": 0.12121212121212122, "text": "Ty Simpson pass complete to Josh Cuevas for 12 yds to the UGA 43 for a 1ST down" }, { "x": 109, "y": 0.11940298507462686, "text": "Ty Simpson pass complete to Ryan Williams for 2 yds to the UGA 46" }, { "x": 110, "y": 0.11764705882352941, "text": "Germie Bernard run for 6 yds to the UGA 40" }, { "x": 111, "y": 0.11594202898550725, "text": "Ty Simpson pass incomplete to Isaiah Horton" }, { "x": 122, "y": 0.11428571428571428, "text": "Jam Miller run for 7 yds to the ALA 19" }, { "x": 123, "y": 0.11267605633802817, "text": "Jam Miller run for 2 yds to the ALA 21" }, { "x": 124, "y": 0.125, "text": "Ty Simpson run for 2 yds to the ALA 23 for a 1ST down Georgia Penalty, Personal Foul (Ellis Robinson IV) to the ALA 38 for a 1ST down" }, { "x": 125, "y": 0.1232876712328767, "text": "Jam Miller run for 6 yds to the ALA 44" }, { "x": 126, "y": 0.12162162162162163, "text": "Jam Miller run for a loss of 1 yard to the ALA 43" }, { "x": 127, "y": 0.12, "text": "Ty Simpson pass complete to Jam Miller for 7 yds to the 50 yard line for a 1ST down" }, { "x": 128, "y": 0.11842105263157894, "text": "TEAM run for a loss of 1 yard to the ALA 49" }, { "x": 129, "y": 0.11688311688311688, "text": "TEAM run for a loss of 1 yard to the ALA 48" } ], "label": "Alabama XR", "borderColor": "rgba(101, 0, 20, 0.8)", "borderWidth": 2.2, "fill": false }, { "data": [ { "x": 4, "y": 0, "text": "Jam Miller run for 2 yds to the ALA 28" }, { "x": 5, "y": 0, "text": "Ty Simpson pass incomplete to Isaiah Horton" }, { "x": 6, "y": 0.3333333333333333, "text": "Ty Simpson run for 10 yds to the ALA 38 for a 1ST down" }, { "x": 7, "y": 0.25, "text": "Jam Miller run for no gain to the ALA 38" }, { "x": 8, "y": 0.2, "text": "Ty Simpson pass incomplete to Ryan Williams" }, { "x": 9, "y": 0.3333333333333333, "text": "Ty Simpson pass complete to Isaiah Horton for 10 yds to the ALA 48 for a 1ST down" }, { "x": 10, "y": 0.2857142857142857, "text": "Ty Simpson pass incomplete to Isaiah Horton" }, { "x": 11, "y": 0.25, "text": "Kevin Riley run for 5 yds to the UGA 47" }, { "x": 12, "y": 0.3333333333333333, "text": "Ty Simpson pass complete to Isaiah Horton for 24 yds to the UGA 23 for a 1ST down" }, { "x": 13, "y": 0.3, "text": "Jam Miller run for 2 yds to the UGA 26" }, { "x": 14, "y": 0.36363636363636365, "text": "Ty Simpson pass complete to Germie Bernard for 18 yds to the UGA 8 for a 1ST down" }, { "x": 15, "y": 0.3333333333333333, "text": "Jam Miller run for 2 yds to the UGA 6" }, { "x": 16, "y": 0.3076923076923077, "text": "Ty Simpson pass incomplete to Isaiah Horton" }, { "x": 17, "y": 0.35714285714285715, "text": "Ty Simpson pass complete to Germie Bernard for 6 yds for a TD (Conor Talty KICK)" }, { "x": 22, "y": 0.3333333333333333, "text": "Jam Miller run for 3 yds to the ALA 20" }, { "x": 23, "y": 0.3125, "text": "Ty Simpson pass incomplete to Germie Bernard" }, { "x": 24, "y": 0.35294117647058826, "text": "Ty Simpson pass complete to Josh Cuevas for 12 yds to the ALA 32 for a 1ST down" }, { "x": 25, "y": 0.3333333333333333, "text": "Germie Bernard sacked by Chris Cole for a loss of 6 yards to the ALA 26" }, { "x": 26, "y": 0.3157894736842105, "text": "Ty Simpson pass complete to Kevin Riley for 10 yds to the ALA 36" }, { "x": 27, "y": 0.35, "text": "Ty Simpson pass complete to Ryan Williams for 7 yds to the ALA 43 for a 1ST down" }, { "x": 28, "y": 0.38095238095238093, "text": "Ty Simpson pass complete to Germie Bernard for 5 yds to the ALA 48" }, { "x": 29, "y": 0.36363636363636365, "text": "Jam Miller run for 3 yds to the UGA 49" }, { "x": 30, "y": 0.391304347826087, "text": "Germie Bernard run for 11 yds to the UGA 38 for a 1ST down" }, { "x": 31, "y": 0.4166666666666667, "text": "Ty Simpson pass complete to Lotzeir Brooks for 19 yds to the UGA 19 for a 1ST down" }, { "x": 32, "y": 0.4, "text": "Kevin Riley run for 4 yds to the UGA 15" }, { "x": 33, "y": 0.38461538461538464, "text": "Jam Miller run for 2 yds to the UGA 13" }, { "x": 34, "y": 0.4074074074074074, "text": "Jam Miller run for 7 yds to the UGA 6 for a 1ST down" }, { "x": 35, "y": 0.42857142857142855, "text": "Ty Simpson pass complete to Isaiah Horton for 6 yds for a TD (Conor Talty KICK)" }, { "x": 39, "y": 0.4482758620689655, "text": "Ty Simpson pass complete to Kevin Riley for 27 yds to the UGA 48 for a 1ST down" }, { "x": 40, "y": 0.43333333333333335, "text": "Ty Simpson pass complete to Germie Bernard for 2 yds to the UGA 46" }, { "x": 41, "y": 0.41935483870967744, "text": "Kevin Riley run for 1 yd to the UGA 45" }, { "x": 42, "y": 0.40625, "text": "Ty Simpson pass incomplete to Rico Scott" }, { "x": 44, "y": 0.3939393939393939, "text": "Jam Miller run for 3 yds to the UGA 8" }, { "x": 45, "y": 0.38235294117647056, "text": "Jam Miller run for 2 yds to the UGA 6" }, { "x": 46, "y": 0.37142857142857144, "text": "Ty Simpson pass incomplete to Germie Bernard" }, { "x": 58, "y": 0.3611111111111111, "text": "Kevin Riley run for 2 yds to the ALA 27" }, { "x": 59, "y": 0.3783783783783784, "text": "Ty Simpson pass complete to Ryan Williams for 7 yds to the ALA 34" }, { "x": 60, "y": 0.39473684210526316, "text": "Germie Bernard pass complete to Isaiah Horton for 4 yds to the ALA 38 for a 1ST down" }, { "x": 61, "y": 0.41025641025641024, "text": "Ty Simpson pass complete to Ryan Williams for 18 yds to the UGA 44 for a 1ST down" }, { "x": 62, "y": 0.4, "text": "Ty Simpson pass incomplete to Ryan Williams" }, { "x": 63, "y": 0.4146341463414634, "text": "Ty Simpson pass complete to Lotzeir Brooks for 21 yds to the UGA 23 for a 1ST down" }, { "x": 64, "y": 0.42857142857142855, "text": "Kadyn Proctor run for 11 yds to the UGA 2 for a 1ST down" }, { "x": 65, "y": 0.4418604651162791, "text": "Ty Simpson run for 2 yds for a TD (Conor Talty KICK)" }, { "x": 68, "y": 0.45454545454545453, "text": "Ty Simpson pass complete to Jam Miller for 14 yds to the ALA 39 for a 1ST down" }, { "x": 69, "y": 0.4444444444444444, "text": "Jam Miller run for 4 yds to the ALA 43" }, { "x": 70, "y": 0.45652173913043476, "text": "Germie Bernard run for 8 yds to the UGA 49 for a 1ST down" }, { "x": 71, "y": 0.44680851063829785, "text": "Kevin Riley run for 4 yds to the UGA 45" }, { "x": 72, "y": 0.4375, "text": "Kevin Riley run for 3 yds to the UGA 42" }, { "x": 73, "y": 0.4489795918367347, "text": "Ty Simpson pass complete to Kaleb Edwards for 17 yds to the UGA 25 for a 1ST down" }, { "x": 74, "y": 0.44, "text": "Ty Simpson pass complete to Jam Miller for a loss of 2 yards to the UGA 27" }, { "x": 75, "y": 0.43137254901960786, "text": "Germie Bernard run for 1 yd to the UGA 26" }, { "x": 76, "y": 0.4230769230769231, "text": "Ty Simpson pass incomplete to Josh Cuevas" }, { "x": 83, "y": 0.41509433962264153, "text": "Ty Simpson pass complete to Germie Bernard for 4 yds to the ALA 29" }, { "x": 84, "y": 0.42592592592592593, "text": "Kevin Riley run for 5 yds to the ALA 49" }, { "x": 85, "y": 0.43636363636363634, "text": "Kevin Riley run for 4 yds to the UGA 47" }, { "x": 86, "y": 0.42857142857142855, "text": "Kevin Riley run for no gain to the UGA 47" }, { "x": 87, "y": 0.42105263157894735, "text": "Ty Simpson run for a loss of 2 yards to the UGA 49" }, { "x": 91, "y": 0.41379310344827586, "text": "Ty Simpson pass incomplete to Germie Bernard" }, { "x": 92, "y": 0.4067796610169492, "text": "Ty Simpson pass incomplete to Rico Scott" }, { "x": 93, "y": 0.4, "text": "Ty Simpson pass incomplete to Ryan Williams" }, { "x": 103, "y": 0.39344262295081966, "text": "Kevin Riley run for 2 yds to the ALA 13" }, { "x": 104, "y": 0.3870967741935484, "text": "Ty Simpson pass incomplete to Germie Bernard" }, { "x": 105, "y": 0.3968253968253968, "text": "Ty Simpson pass complete to Ryan Williams for 9 yds to the ALA 22 for a 1ST down" }, { "x": 106, "y": 0.390625, "text": "Jam Miller run for 2 yds to the ALA 24" }, { "x": 107, "y": 0.4, "text": "Ty Simpson pass complete to Isaiah Horton for 21 yds to the ALA 45 for a 1ST down" }, { "x": 108, "y": 0.4090909090909091, "text": "Ty Simpson pass complete to Josh Cuevas for 12 yds to the UGA 43 for a 1ST down" }, { "x": 109, "y": 0.40298507462686567, "text": "Ty Simpson pass complete to Ryan Williams for 2 yds to the UGA 46" }, { "x": 110, "y": 0.39705882352941174, "text": "Germie Bernard run for 6 yds to the UGA 40" }, { "x": 111, "y": 0.391304347826087, "text": "Ty Simpson pass incomplete to Isaiah Horton" }, { "x": 122, "y": 0.4, "text": "Jam Miller run for 7 yds to the ALA 19" }, { "x": 123, "y": 0.39436619718309857, "text": "Jam Miller run for 2 yds to the ALA 21" }, { "x": 124, "y": 0.4027777777777778, "text": "Ty Simpson run for 2 yds to the ALA 23 for a 1ST down Georgia Penalty, Personal Foul (Ellis Robinson IV) to the ALA 38 for a 1ST down" }, { "x": 125, "y": 0.410958904109589, "text": "Jam Miller run for 6 yds to the ALA 44" }, { "x": 126, "y": 0.40540540540540543, "text": "Jam Miller run for a loss of 1 yard to the ALA 43" }, { "x": 127, "y": 0.41333333333333333, "text": "Ty Simpson pass complete to Jam Miller for 7 yds to the 50 yard line for a 1ST down" }, { "x": 128, "y": 0.40789473684210525, "text": "TEAM run for a loss of 1 yard to the ALA 49" }, { "x": 129, "y": 0.4025974025974026, "text": "TEAM run for a loss of 1 yard to the ALA 48" } ], "label": "Alabama SR", "borderColor": "rgba(175, 40, 60, 0.8)", "borderWidth": 2.2, "fill": false }, { "data": [ { "x": 1, "y": 0, "text": "Nate Frazier run for 2 yds to the UGA 27" }, { "x": 2, "y": 0, "text": "Gunner Stockton pass incomplete to Colbie Young" }, { "x": 3, "y": 0, "text": "Gunner Stockton pass incomplete to Zachariah Branch" }, { "x": 18, "y": 0.25, "text": "Nate Frazier run for 24 yds to the UGA 34 for a 1ST down" }, { "x": 19, "y": 0.2, "text": "Gunner Stockton pass incomplete to Henry Delp" }, { "x": 20, "y": 0.16666666666666666, "text": "Chauncey Bowens run for 5 yds to the UGA 39" }, { "x": 21, "y": 0.14285714285714285, "text": "Gunner Stockton pass incomplete to Zachariah Branch" }, { "x": 36, "y": 0.125, "text": "Gunner Stockton pass complete to Zachariah Branch for 8 yds to the UGA 33" }, { "x": 37, "y": 0.2222222222222222, "text": "Chauncey Bowens run for 29 yds to the ALA 38 for a 1ST down" }, { "x": 38, "y": 0.3, "text": "Gunner Stockton pass complete to Colbie Young for 38 yds for a TD (Peyton Woodring KICK)" }, { "x": 43, "y": 0.2727272727272727, "text": "Nate Frazier run for 2 yds to the UGA 9" }, { "x": 47, "y": 0.25, "text": "Zachariah Branch run for a loss of 6 yards to the UGA 19" }, { "x": 48, "y": 0.3076923076923077, "text": "Gunner Stockton pass complete to Colbie Young for 17 yds to the UGA 36 for a 1ST down" }, { "x": 49, "y": 0.2857142857142857, "text": "Chauncey Bowens run for 4 yds to the UGA 40" }, { "x": 50, "y": 0.26666666666666666, "text": "Gunner Stockton pass complete to London Humphreys for 9 yds to the UGA 49 for a 1ST down" }, { "x": 51, "y": 0.25, "text": "Gunner Stockton sacked by Edric Hill and LT Overton for a loss of 2 yards to the UGA 47" }, { "x": 52, "y": 0.29411764705882354, "text": "Chauncey Bowens run for 43 yds to the ALA 10 for a 1ST down" }, { "x": 53, "y": 0.2777777777777778, "text": "Gunner Stockton pass complete to Zachariah Branch for 5 yds to the ALA 5" }, { "x": 54, "y": 0.2631578947368421, "text": "Josh McCray run for 3 yds to the ALA 2" }, { "x": 55, "y": 0.25, "text": "Josh McCray run for no gain to the ALA 2" }, { "x": 56, "y": 0.23809523809523808, "text": "Chauncey Bowens run for a loss of 1 yard to the ALA 2" }, { "x": 57, "y": 0.22727272727272727, "text": "Chauncey Bowens run for 2 yds for a TD (Peyton Woodring KICK)" }, { "x": 66, "y": 0.21739130434782608, "text": "Chauncey Bowens run for 10 yds to the UGA 23 for a 1ST down" }, { "x": 67, "y": 0.20833333333333334, "text": "Gunner Stockton pass complete to Chauncey Bowens for 2 yds to the UGA 25" }, { "x": 77, "y": 0.2, "text": "Gunner Stockton pass complete to Chauncey Bowens for 6 yds to the UGA 32" }, { "x": 78, "y": 0.23076923076923078, "text": "Dillon Bell run for 43 yds to the ALA 25 for a 1ST down" }, { "x": 79, "y": 0.2222222222222222, "text": "Chauncey Bowens run for 14 yds to the ALA 11 for a 1ST down" }, { "x": 80, "y": 0.21428571428571427, "text": "Chauncey Bowens run for 1 yd to the ALA 10 for a 1ST down Alabama Penalty, Personal Foul (LT Overton) to the ALA 5 for a 1ST down" }, { "x": 81, "y": 0.20689655172413793, "text": "Josh McCray run for 4 yds to the ALA 1" }, { "x": 82, "y": 0.2, "text": "Josh McCray run for 1 yd for a TD (Peyton Woodring KICK)" }, { "x": 88, "y": 0.1935483870967742, "text": "Dwight Phillips Jr. run for 1 yd to the 50 yard line" }, { "x": 89, "y": 0.1875, "text": "Gunner Stockton pass incomplete to Talyn Taylor" }, { "x": 90, "y": 0.18181818181818182, "text": "Gunner Stockton pass incomplete to Zachariah Branch" }, { "x": 94, "y": 0.17647058823529413, "text": "Gunner Stockton pass complete to Colbie Young for 3 yds to the UGA 49" }, { "x": 95, "y": 0.17142857142857143, "text": "Gunner Stockton run for 3 yds to the ALA 48" }, { "x": 96, "y": 0.19444444444444445, "text": "Gunner Stockton run for 21 yds to the ALA 27 for a 1ST down" }, { "x": 97, "y": 0.1891891891891892, "text": "Chauncey Bowens run for 4 yds to the ALA 23" }, { "x": 98, "y": 0.18421052631578946, "text": "Chauncey Bowens run for 6 yds to the ALA 17 for a 1ST down" }, { "x": 99, "y": 0.1794871794871795, "text": "Josh McCray run for 7 yds to the ALA 10" }, { "x": 100, "y": 0.175, "text": "Josh McCray run for no gain to the ALA 10" }, { "x": 101, "y": 0.17073170731707318, "text": "Gunner Stockton run for 2 yds to the ALA 8" }, { "x": 102, "y": 0.16666666666666666, "text": "Cash Jones run for a loss of 3 yards to the ALA 11" }, { "x": 112, "y": 0.16279069767441862, "text": "Zachariah Branch run for 10 yds to the UGA 15 for a 1ST down" }, { "x": 113, "y": 0.1590909090909091, "text": "Chauncey Bowens run for 2 yds to the UGA 17 Georgia Penalty, Offensive Holding (Bo Hughley) to the UGA 9" }, { "x": 114, "y": 0.15555555555555556, "text": "Gunner Stockton pass complete to Chauncey Bowens for 7 yds to the UGA 16" }, { "x": 115, "y": 0.15217391304347827, "text": "Gunner Stockton run for a loss of 2 yards to the UGA 14" }, { "x": 116, "y": 0.1702127659574468, "text": "Gunner Stockton pass complete to Zachariah Branch for 22 yds to the UGA 36 for a 1ST down" }, { "x": 117, "y": 0.16666666666666666, "text": "Gunner Stockton pass complete to Sacovie White-Helton for 5 yds to the UGA 41" }, { "x": 118, "y": 0.16326530612244897, "text": "Gunner Stockton pass complete to Chauncey Bowens for 7 yds to the UGA 48 for a 1ST down" }, { "x": 119, "y": 0.16, "text": "Gunner Stockton pass complete to Colbie Young for 1 yd to the UGA 49" }, { "x": 120, "y": 0.1568627450980392, "text": "Gunner Stockton pass incomplete to Zachariah Branch" }, { "x": 121, "y": 0.15384615384615385, "text": "Cash Jones run for a loss of 4 yards to the UGA 45" } ], "label": "Georgia XR", "borderColor": "#991B1BCC", "borderWidth": 2.2, "borderDash": [ 4, 4 ], "fill": false }, { "data": [ { "x": 1, "y": 0, "text": "Nate Frazier run for 2 yds to the UGA 27" }, { "x": 2, "y": 0, "text": "Gunner Stockton pass incomplete to Colbie Young" }, { "x": 3, "y": 0, "text": "Gunner Stockton pass incomplete to Zachariah Branch" }, { "x": 18, "y": 0.25, "text": "Nate Frazier run for 24 yds to the UGA 34 for a 1ST down" }, { "x": 19, "y": 0.2, "text": "Gunner Stockton pass incomplete to Henry Delp" }, { "x": 20, "y": 0.16666666666666666, "text": "Chauncey Bowens run for 5 yds to the UGA 39" }, { "x": 21, "y": 0.14285714285714285, "text": "Gunner Stockton pass incomplete to Zachariah Branch" }, { "x": 36, "y": 0.25, "text": "Gunner Stockton pass complete to Zachariah Branch for 8 yds to the UGA 33" }, { "x": 37, "y": 0.3333333333333333, "text": "Chauncey Bowens run for 29 yds to the ALA 38 for a 1ST down" }, { "x": 38, "y": 0.4, "text": "Gunner Stockton pass complete to Colbie Young for 38 yds for a TD (Peyton Woodring KICK)" }, { "x": 43, "y": 0.36363636363636365, "text": "Nate Frazier run for 2 yds to the UGA 9" }, { "x": 47, "y": 0.3333333333333333, "text": "Zachariah Branch run for a loss of 6 yards to the UGA 19" }, { "x": 48, "y": 0.38461538461538464, "text": "Gunner Stockton pass complete to Colbie Young for 17 yds to the UGA 36 for a 1ST down" }, { "x": 49, "y": 0.35714285714285715, "text": "Chauncey Bowens run for 4 yds to the UGA 40" }, { "x": 50, "y": 0.4, "text": "Gunner Stockton pass complete to London Humphreys for 9 yds to the UGA 49 for a 1ST down" }, { "x": 51, "y": 0.375, "text": "Gunner Stockton sacked by Edric Hill and LT Overton for a loss of 2 yards to the UGA 47" }, { "x": 52, "y": 0.4117647058823529, "text": "Chauncey Bowens run for 43 yds to the ALA 10 for a 1ST down" }, { "x": 53, "y": 0.4444444444444444, "text": "Gunner Stockton pass complete to Zachariah Branch for 5 yds to the ALA 5" }, { "x": 54, "y": 0.42105263157894735, "text": "Josh McCray run for 3 yds to the ALA 2" }, { "x": 55, "y": 0.4, "text": "Josh McCray run for no gain to the ALA 2" }, { "x": 56, "y": 0.38095238095238093, "text": "Chauncey Bowens run for a loss of 1 yard to the ALA 2" }, { "x": 57, "y": 0.4090909090909091, "text": "Chauncey Bowens run for 2 yds for a TD (Peyton Woodring KICK)" }, { "x": 66, "y": 0.43478260869565216, "text": "Chauncey Bowens run for 10 yds to the UGA 23 for a 1ST down" }, { "x": 67, "y": 0.4166666666666667, "text": "Gunner Stockton pass complete to Chauncey Bowens for 2 yds to the UGA 25" }, { "x": 77, "y": 0.44, "text": "Gunner Stockton pass complete to Chauncey Bowens for 6 yds to the UGA 32" }, { "x": 78, "y": 0.46153846153846156, "text": "Dillon Bell run for 43 yds to the ALA 25 for a 1ST down" }, { "x": 79, "y": 0.48148148148148145, "text": "Chauncey Bowens run for 14 yds to the ALA 11 for a 1ST down" }, { "x": 80, "y": 0.5, "text": "Chauncey Bowens run for 1 yd to the ALA 10 for a 1ST down Alabama Penalty, Personal Foul (LT Overton) to the ALA 5 for a 1ST down" }, { "x": 81, "y": 0.5172413793103449, "text": "Josh McCray run for 4 yds to the ALA 1" }, { "x": 82, "y": 0.5333333333333333, "text": "Josh McCray run for 1 yd for a TD (Peyton Woodring KICK)" }, { "x": 88, "y": 0.5161290322580645, "text": "Dwight Phillips Jr. run for 1 yd to the 50 yard line" }, { "x": 89, "y": 0.5, "text": "Gunner Stockton pass incomplete to Talyn Taylor" }, { "x": 90, "y": 0.48484848484848486, "text": "Gunner Stockton pass incomplete to Zachariah Branch" }, { "x": 94, "y": 0.47058823529411764, "text": "Gunner Stockton pass complete to Colbie Young for 3 yds to the UGA 49" }, { "x": 95, "y": 0.45714285714285713, "text": "Gunner Stockton run for 3 yds to the ALA 48" }, { "x": 96, "y": 0.4722222222222222, "text": "Gunner Stockton run for 21 yds to the ALA 27 for a 1ST down" }, { "x": 97, "y": 0.4594594594594595, "text": "Chauncey Bowens run for 4 yds to the ALA 23" }, { "x": 98, "y": 0.47368421052631576, "text": "Chauncey Bowens run for 6 yds to the ALA 17 for a 1ST down" }, { "x": 99, "y": 0.48717948717948717, "text": "Josh McCray run for 7 yds to the ALA 10" }, { "x": 100, "y": 0.475, "text": "Josh McCray run for no gain to the ALA 10" }, { "x": 101, "y": 0.4634146341463415, "text": "Gunner Stockton run for 2 yds to the ALA 8" }, { "x": 102, "y": 0.4523809523809524, "text": "Cash Jones run for a loss of 3 yards to the ALA 11" }, { "x": 112, "y": 0.46511627906976744, "text": "Zachariah Branch run for 10 yds to the UGA 15 for a 1ST down" }, { "x": 113, "y": 0.45454545454545453, "text": "Chauncey Bowens run for 2 yds to the UGA 17 Georgia Penalty, Offensive Holding (Bo Hughley) to the UGA 9" }, { "x": 114, "y": 0.4444444444444444, "text": "Gunner Stockton pass complete to Chauncey Bowens for 7 yds to the UGA 16" }, { "x": 115, "y": 0.43478260869565216, "text": "Gunner Stockton run for a loss of 2 yards to the UGA 14" }, { "x": 116, "y": 0.44680851063829785, "text": "Gunner Stockton pass complete to Zachariah Branch for 22 yds to the UGA 36 for a 1ST down" }, { "x": 117, "y": 0.4583333333333333, "text": "Gunner Stockton pass complete to Sacovie White-Helton for 5 yds to the UGA 41" }, { "x": 118, "y": 0.46938775510204084, "text": "Gunner Stockton pass complete to Chauncey Bowens for 7 yds to the UGA 48 for a 1ST down" }, { "x": 119, "y": 0.46, "text": "Gunner Stockton pass complete to Colbie Young for 1 yd to the UGA 49" }, { "x": 120, "y": 0.45098039215686275, "text": "Gunner Stockton pass incomplete to Zachariah Branch" }, { "x": 121, "y": 0.4423076923076923, "text": "Cash Jones run for a loss of 4 yards to the UGA 45" } ], "label": "Georgia SR", "borderColor": "#DC2626CC", "borderWidth": 2.2, "borderDash": [ 4, 4 ], "fill": false }, { "label": "Quarters", "data": [ { "x": 1, "y": 0 }, { "x": 1, "y": 1 }, { "x": 129, "y": 1 }, { "x": 129, "y": 0 }, { "x": 33, "y": 0 }, { "x": 33, "y": 1 }, { "x": 129, "y": 1 }, { "x": 129, "y": 0 }, { "x": 68, "y": 0 }, { "x": 68, "y": 1 }, { "x": 129, "y": 1 }, { "x": 129, "y": 0 }, { "x": 99, "y": 0 }, { "x": 99, "y": 1 }, { "x": 129, "y": 1 }, { "x": 129, "y": 0 } ], "borderColor": "rgba(0,0,0,0.1)", "borderWidth": 1, "tension": 0, "fill": false, "pointRadius": 0, "showLine": true, "datalabels": { "display": false } } ], "currentParams": { "year": 2025, "week": 5, "seasonType": "regular", "team": "Alabama", "gameId": "401752718" } }; // Chart options (WordPress-safe) const chartOptions = { responsive: true, maintainAspectRatio: false, animation: { duration: 0 // Disable animations to prevent conflicts }, elements: 'line' === 'line' ? 'team-lines'.includes('play-map') ? { line: { tension: 0, borderWidth: 0 } } : { line: { tension: 0.25, borderWidth: 2.2 }, point: { pointRadius: 'team-lines'.includes('team-lines') ? 0 : undefined } } : {}, plugins: { datalabels: { display: function(context) { // Suppress data labels on line charts if ('line' === 'line') { return false; } return context.dataset.datalabels && context.dataset.datalabels.display === true; }, formatter: function(value, context) { // Special handling for Overall Team Performance chart if ('team-lines' === 'overall-team-performance' && context.dataset.label === 'Success Rate (SR)') { // Use the stored play count data if (context.dataset.playCountData && context.dataset.playCountData[context.dataIndex]) { return context.dataset.playCountData[context.dataIndex]; } // Fallback to percentage if play count data not available return Math.round(value * 100) + '%'; } // Handle bar charts with count data (play-type, quarter, down, etc.) if (context.dataset.label && context.dataset.label.includes(' SR') && (chartData.teamCounts || chartData.oppCounts)) { // Find the first team SR dataset in the chart to determine team order const allDatasets = context.chart.data.datasets; const teamSRDataset = allDatasets.find(d => d.label && d.label.includes(' SR') && !d.label.includes('NCAA')); // If this is the first team's SR dataset, use teamCounts if (teamSRDataset && context.dataset.label === teamSRDataset.label && chartData.teamCounts) { return chartData.teamCounts[context.dataIndex] || 0; } // Otherwise, use oppCounts for the second team else if (chartData.oppCounts) { return chartData.oppCounts[context.dataIndex] || 0; } } // For player charts, show value only if > 0 (matches non-embedded behavior) if ('team-lines'.includes('top-rushers') || 'team-lines'.includes('top-passers') || 'team-lines'.includes('top-receivers')) { // Hide data labels for zero or negative values, show actual value for positive values return value > 0 ? value : null; } // For other charts, show values based on type if (typeof value === 'number') { // If value is between 0 and 1, treat as percentage if (value >= 0 && value 0 ? '#26262660' : 'transparent'; }, borderColor: function(context) { const value = context.dataset.data[context.dataIndex]; return value > 0 ? 'rgba(255, 255, 255, 0.2)' : 'transparent'; }, borderRadius: 4, align: 'center', anchor: 'center' }, legend: 'line' === 'line' ? { position: 'top', align: 'start', labels: 'team-lines'.includes('play-map') ? { usePointStyle: true, generateLabels: function(chart) { // Call the original generateLabels to get default styling const original = Chart.defaults.plugins.legend.labels.generateLabels; const labels = original.call(this, chart); // Filter and customize each label const filteredLabels = labels.filter(label => { return !label.text.includes(' { const dataset = chart.data.datasets[label.datasetIndex]; if (dataset && dataset.label) { if (dataset.label.includes('Rush')) { label.pointStyle = 'circle'; label.pointStyleWidth = 4; label.fillStyle = 'white'; } else if (dataset.label.includes('Pass')) { label.pointStyle = 'triangle'; label.pointStyleWidth = 4; label.fillStyle = 'white'; } else { label.pointStyle = 'rect'; label.pointStyleWidth = 4; label.fillStyle = 'white'; } } }); return filteredLabels; }, boxWidth: 20, padding: 12 } : { usePointStyle: false, boxWidth: 12, boxHeight: 12, padding: 12, generateLabels: function(chart) { const original = Chart.defaults.plugins.legend.labels.generateLabels; const labels = original.call(this, chart); // Filter out reference areas and ensure white fill const filteredLabels = labels.filter(label => { return !label.text.includes('NCAA Avg SR') && !label.text.includes('50/50') && !label.text.includes('Quarters'); }); // Ensure white fill for all line chart legend boxes filteredLabels.forEach((label) => { label.fillStyle = 'white'; }); return filteredLabels; } } } : { position: 'top', align: 'start', labels: { usePointStyle: false, boxWidth: 12, boxHeight: 12, padding: 12, filter: function(legendItem, chartData) { return !legendItem.text.includes('NCAA Avg SR') && !legendItem.text.includes('Quarters') && !legendItem.text.includes('50/50'); }, generateLabels: function(chart) { const data = chart.data; if (data.datasets.length) { return data.datasets.map((dataset, i) => { // Handle backgroundColor arrays (like in Overall Team Performance chart) let fillColor = dataset.backgroundColor; if (dataset.label === '# Plays') { fillColor = 'white'; } else if (Array.isArray(dataset.backgroundColor)) { // For datasets with backgroundColor arrays, use the first color for legend fillColor = dataset.backgroundColor[0]; } return { text: dataset.label, fillStyle: fillColor, strokeStyle: dataset.label === '# Plays' ? '#666' : dataset.borderColor, lineWidth: dataset.label === '# Plays' ? 1 : dataset.borderWidth, hidden: !chart.isDatasetVisible(i), datasetIndex: i }; }).filter((item, index) => { // Apply the same filter logic as above const dataset = chart.data.datasets[index]; if (!dataset || !dataset.data) return false; if (dataset.label === '# Plays') return true; // Always show # Plays if (dataset.label && (dataset.label.includes('NCAA Avg SR') || dataset.label.includes('Quarters') || dataset.label.includes('50/50'))) return false; return dataset.data.some((value) => value > 0); }); } return []; } } }, tooltip: { filter: function(tooltipItem) { if ('team-lines'.includes('play-map')) { return !tooltipItem.dataset.label.includes('< 0') && !tooltipItem.dataset.label.includes('Quarters') && !tooltipItem.dataset.label.includes('Drive'); } return !tooltipItem.dataset.label.includes('NCAA Avg SR') && !tooltipItem.dataset.label.includes('50/50') && !tooltipItem.dataset.label.includes('< 0') && !tooltipItem.dataset.label.includes('Quarters'); }, callbacks: { label: function(context) { const label = context.dataset.label || ''; let labelText; // Play maps show yards instead of percentages if ('team-lines'.includes('play-map')) { labelText = label + ': ' + context.parsed.y + ' yards'; } else { const value = Math.round(context.parsed.y * 100); labelText = label + ': ' + value + '%'; } // For line charts, include play text if available if ('line' === 'line' && context.raw && context.raw.text) { return [labelText, context.raw.text]; } return labelText; } } } }, scales: 'line' === 'line' ? 'team-lines'.includes('play-map') ? { x: { type: 'linear', position: 'bottom', title: { display: true, text: 'Play Number' }, min: 1, ticks: { stepSize: 1, callback: function(value) { return Math.floor(value); } }, grid: { display: false } }, y: { title: { display: true, text: 'Yards Gained' }, min: chartData.minY, max: chartData.maxY } } : { x: { type: 'linear', position: 'bottom', title: { display: true, text: 'team-lines'.includes('team-lines') ? 'Play Number' : 'Team Play Number' }, min: 1, ticks: { stepSize: 1, callback: function(value) { return Math.floor(value); } }, grid: { display: false } }, y: { max: 1, min: 0, ticks: { callback: function(value) { return Math.round(value * 100) + '%'; } } } } : 'team-lines'.includes('drive-metrics') ? { y: { stacked: false, max: 1, ticks: { callback: function(value) { return Math.round(value * 100) + '%'; } } }, y1: { display: false, type: 'linear', position: 'right' } } : ('team-lines'.includes('top-rushers') || 'team-lines'.includes('top-passers') || 'team-lines'.includes('top-receivers')) ? { x: { stacked: true }, y: { stacked: true } } : { y: { max: 1, min: 0, stacked: false, ticks: { callback: function(value) { return Math.round(value * 100) + '%'; } } } } }; // Add indexAxis for player charts if ('team-lines'.includes('top-rushers') || 'team-lines'.includes('top-passers') || 'team-lines'.includes('top-receivers')) { chartOptions.indexAxis = 'y'; } // Initialize the chart const ctx = canvas.getContext('2d'); const chart = new Chart(ctx, { type: 'line', data: chartData, options: chartOptions }); // Store reference to prevent re-initialization canvas.chartInstance = chart; console.log('CFB Chart initialized successfully'); } catch (error) { console.error('Error initializing CFB chart:', error); // Fallback: show error message in canvas container const container = document.getElementById('cfb-chart-1759110716686-nrwgks0i1').parentNode; if (container) { container.innerHTML = '
Chart failed to load. Please refresh the page.
'; } } } // Initialize when DOM is ready if (document.readyState === 'loading') { document.addEventListener('DOMContentLoaded', initChart); } else { initChart(); } // Also try initialization after a short delay for WordPress compatibility setTimeout(initChart, 500); })();
But it wasn’t like that the whole game, obviously. Alabama came out strong. While the Tide never got above well above-average efficiencies in this game, they continued to climb through the 1st quarter and spent much of the rest of the game near league average SRs. After a few plays, they also started putting up explosive passes, keeping that XR in a middling, but respectable, low-teens range.
Georgia started real slow but suddenly woke up in the 2nd quarter, with their efficiency and explosiveness simultaneously skyrocketing, dragging them out of the mud and having them basically meet Alabama’s efficiency (and exceed the Tide’s explosiveness) by the half. Somehow, Alabama was still up 10 points (and nearly more).
But the second half did not give us a reprieve on the trend. Georgia came back out and was as efficient as they had been, still gaining in efficiency. For a few plays they were pushing a >50% efficiency rate before things started slowing for them going into the 4th quarter. Hilariously, Alabama did not score a single point in the second half, but their SRs and XRs held; and by holding on to a 10-point lead, coming up with a turnover, and making just one critical stop, this team managed to actually win this one.
Rush Rate: Georgia body { font-family: -apple-system, BlinkMacSystemFont, 'Segoe UI', 'Roboto', sans-serif; margin: 0; padding: 20px; background: #f8fafc; } .chart-container { background: white; border-radius: 12px; border: 1px solid #e5e5e5; box-shadow: 0 1px 3px rgba(0, 0, 0, 0.1); overflow: hidden; } .chart-header { padding: 18px 24px 16px; border-bottom: 1px solid #e5e5e5; background: white; } .chart-title { font-size: 18px; font-weight: 600; color: #171717; margin: 0; } .chart-content { padding: 20px 24px 24px !important; } @media (max-width: 640px) { .chart-content { padding: 12px 16px 20px !important; } .chart-header { padding: 12px 16px 12px !important; } .embed-footer-top { padding: 8px 12px !important; } .data-definitions { padding: 12px !important; } body { padding: 12px !important; } } .chart-content.top-receivers { height: 624px; } .chart-content.top-passers { height: 280px !important; } .chart-content.top-rushers { height: 372px; } .chart-content:not(.top-receivers):not(.top-passers):not(.top-rushers) { height: 372px; } .embed-footer { border-top: 1px solid #e5e5e5; font-size: 12px; color: #737373; } .embed-footer-top { display: flex; justify-content: space-between; align-items: center; padding: 12px 16px; } .embed-footer-link { color: #737373; text-decoration: none; font-weight: 500; } .embed-footer-link:hover { color: #525252; text-decoration: underline; } .data-definitions-toggle { background: none; border: none; color: #737373; font-size: 12px; font-weight: 500; cursor: pointer; display: flex; align-items: center; gap: 4px; padding: 0; } .data-definitions-toggle:hover { color: #525252; } .caret { transition: transform 0.2s ease; font-size: 10px; } .caret.expanded { transform: rotate(180deg); } .data-definitions { display: none; padding: 16px; background: #fafafa; border-top: 1px solid #e5e5e5; font-size: 12px; line-height: 1.4; } .data-definitions.expanded { display: block; } .data-definitions ul { margin: 0; padding-left: 0; list-style: none; } .data-definitions li { margin-bottom: 4px; }
// Toggle data definitions accordion - unique function per embed function toggleDefinitions_cfb_chart_1759110728998_am17andhr() { const definitions = document.getElementById('dataDefinitions_cfb-chart-1759110728998-am17andhr'); const caret = document.getElementById('caret_cfb-chart-1759110728998-am17andhr'); if (definitions.classList.contains('expanded')) { definitions.classList.remove('expanded'); caret.classList.remove('expanded'); } else { definitions.classList.add('expanded'); caret.classList.add('expanded'); } } // WordPress-safe chart initialization with defensive checks (function() { 'use strict'; function initChart() { // Check if Chart.js is available if (typeof Chart === 'undefined') { console.warn('Chart.js not loaded yet, retrying...'); setTimeout(initChart, 100); return; } // Check if datalabels plugin is available if (typeof ChartDataLabels === 'undefined') { console.warn('ChartDataLabels plugin not loaded yet, retrying...'); setTimeout(initChart, 100); return; } // Check if canvas element exists const canvas = document.getElementById('cfb-chart-1759110728998-am17andhr'); if (!canvas) { console.warn('Canvas element not found yet, retrying...'); setTimeout(initChart, 100); return; } // Prevent multiple chart instances if (canvas.chartInstance) { console.log('Chart already initialized'); return; } try { // Register the datalabels plugin Chart.register(ChartDataLabels); // Embed actual chart data directly const chartData = { "datasets": [ { "label": "50/50", "data": [ { "x": 1, "y": 0 }, { "x": 1, "y": 0.5 }, { "x": 52, "y": 0.5 }, { "x": 52, "y": 0 } ], "backgroundColor": "rgba(0,0,0,0.03)", "borderColor": "transparent", "pointRadius": 0, "fill": true, "tension": 0, "showLine": true, "datalabels": { "display": false } }, { "data": [ { "x": 1, "y": 1, "text": "Nate Frazier run for 2 yds to the UGA 27" }, { "x": 2, "y": 0.5, "text": "Gunner Stockton pass incomplete to Colbie Young" }, { "x": 3, "y": 0.3333333333333333, "text": "Gunner Stockton pass incomplete to Zachariah Branch" }, { "x": 4, "y": 0.5, "text": "Nate Frazier run for 24 yds to the UGA 34 for a 1ST down" }, { "x": 5, "y": 0.4, "text": "Gunner Stockton pass incomplete to Henry Delp" }, { "x": 6, "y": 0.5, "text": "Chauncey Bowens run for 5 yds to the UGA 39" }, { "x": 7, "y": 0.42857142857142855, "text": "Gunner Stockton pass incomplete to Zachariah Branch" }, { "x": 8, "y": 0.375, "text": "Gunner Stockton pass complete to Zachariah Branch for 8 yds to the UGA 33" }, { "x": 9, "y": 0.4444444444444444, "text": "Chauncey Bowens run for 29 yds to the ALA 38 for a 1ST down" }, { "x": 10, "y": 0.4, "text": "Gunner Stockton pass complete to Colbie Young for 38 yds for a TD (Peyton Woodring KICK)" }, { "x": 11, "y": 0.45454545454545453, "text": "Nate Frazier run for 2 yds to the UGA 9" }, { "x": 12, "y": 0.5, "text": "Zachariah Branch run for a loss of 6 yards to the UGA 19" }, { "x": 13, "y": 0.46153846153846156, "text": "Gunner Stockton pass complete to Colbie Young for 17 yds to the UGA 36 for a 1ST down" }, { "x": 14, "y": 0.5, "text": "Chauncey Bowens run for 4 yds to the UGA 40" }, { "x": 15, "y": 0.4666666666666667, "text": "Gunner Stockton pass complete to London Humphreys for 9 yds to the UGA 49 for a 1ST down" }, { "x": 16, "y": 0.4375, "text": "Gunner Stockton sacked by Edric Hill and LT Overton for a loss of 2 yards to the UGA 47" }, { "x": 17, "y": 0.47058823529411764, "text": "Chauncey Bowens run for 43 yds to the ALA 10 for a 1ST down" }, { "x": 18, "y": 0.4444444444444444, "text": "Gunner Stockton pass complete to Zachariah Branch for 5 yds to the ALA 5" }, { "x": 19, "y": 0.47368421052631576, "text": "Josh McCray run for 3 yds to the ALA 2" }, { "x": 20, "y": 0.5, "text": "Josh McCray run for no gain to the ALA 2" }, { "x": 21, "y": 0.5238095238095238, "text": "Chauncey Bowens run for a loss of 1 yard to the ALA 2" }, { "x": 22, "y": 0.5454545454545454, "text": "Chauncey Bowens run for 2 yds for a TD (Peyton Woodring KICK)" }, { "x": 23, "y": 0.5652173913043478, "text": "Chauncey Bowens run for 10 yds to the UGA 23 for a 1ST down" }, { "x": 24, "y": 0.5416666666666666, "text": "Gunner Stockton pass complete to Chauncey Bowens for 2 yds to the UGA 25" }, { "x": 25, "y": 0.52, "text": "Gunner Stockton pass complete to Chauncey Bowens for 6 yds to the UGA 32" }, { "x": 26, "y": 0.5384615384615384, "text": "Dillon Bell run for 43 yds to the ALA 25 for a 1ST down" }, { "x": 27, "y": 0.5555555555555556, "text": "Chauncey Bowens run for 14 yds to the ALA 11 for a 1ST down" }, { "x": 28, "y": 0.5714285714285714, "text": "Chauncey Bowens run for 1 yd to the ALA 10 for a 1ST down Alabama Penalty, Personal Foul (LT Overton) to the ALA 5 for a 1ST down" }, { "x": 29, "y": 0.5862068965517241, "text": "Josh McCray run for 4 yds to the ALA 1" }, { "x": 30, "y": 0.6, "text": "Josh McCray run for 1 yd for a TD (Peyton Woodring KICK)" }, { "x": 31, "y": 0.6129032258064516, "text": "Dwight Phillips Jr. run for 1 yd to the 50 yard line" }, { "x": 32, "y": 0.59375, "text": "Gunner Stockton pass incomplete to Talyn Taylor" }, { "x": 33, "y": 0.5757575757575758, "text": "Gunner Stockton pass incomplete to Zachariah Branch" }, { "x": 34, "y": 0.5588235294117647, "text": "Gunner Stockton pass complete to Colbie Young for 3 yds to the UGA 49" }, { "x": 35, "y": 0.5714285714285714, "text": "Gunner Stockton run for 3 yds to the ALA 48" }, { "x": 36, "y": 0.5833333333333334, "text": "Gunner Stockton run for 21 yds to the ALA 27 for a 1ST down" }, { "x": 37, "y": 0.5945945945945946, "text": "Chauncey Bowens run for 4 yds to the ALA 23" }, { "x": 38, "y": 0.6052631578947368, "text": "Chauncey Bowens run for 6 yds to the ALA 17 for a 1ST down" }, { "x": 39, "y": 0.6153846153846154, "text": "Josh McCray run for 7 yds to the ALA 10" }, { "x": 40, "y": 0.625, "text": "Josh McCray run for no gain to the ALA 10" }, { "x": 41, "y": 0.6341463414634146, "text": "Gunner Stockton run for 2 yds to the ALA 8" }, { "x": 42, "y": 0.6428571428571429, "text": "Cash Jones run for a loss of 3 yards to the ALA 11" }, { "x": 43, "y": 0.6511627906976745, "text": "Zachariah Branch run for 10 yds to the UGA 15 for a 1ST down" }, { "x": 44, "y": 0.6590909090909091, "text": "Chauncey Bowens run for 2 yds to the UGA 17 Georgia Penalty, Offensive Holding (Bo Hughley) to the UGA 9" }, { "x": 45, "y": 0.6444444444444445, "text": "Gunner Stockton pass complete to Chauncey Bowens for 7 yds to the UGA 16" }, { "x": 46, "y": 0.6521739130434783, "text": "Gunner Stockton run for a loss of 2 yards to the UGA 14" }, { "x": 47, "y": 0.6382978723404256, "text": "Gunner Stockton pass complete to Zachariah Branch for 22 yds to the UGA 36 for a 1ST down" }, { "x": 48, "y": 0.625, "text": "Gunner Stockton pass complete to Sacovie White-Helton for 5 yds to the UGA 41" }, { "x": 49, "y": 0.6122448979591837, "text": "Gunner Stockton pass complete to Chauncey Bowens for 7 yds to the UGA 48 for a 1ST down" }, { "x": 50, "y": 0.6, "text": "Gunner Stockton pass complete to Colbie Young for 1 yd to the UGA 49" }, { "x": 51, "y": 0.5882352941176471, "text": "Gunner Stockton pass incomplete to Zachariah Branch" }, { "x": 52, "y": 0.5961538461538461, "text": "Cash Jones run for a loss of 4 yards to the UGA 45" } ], "label": "Georgia Rush Rate", "borderColor": "#991B1BCC", "backgroundColor": "#FEE2E2CC", "borderWidth": 2, "pointBackgroundColor": [ "rgba(255,255,255,0.9)", "rgba(255,255,255,0.9)", "rgba(255,255,255,0.9)", "#991B1BCC", "rgba(255,255,255,0.9)", "rgba(255,255,255,0.9)", "rgba(255,255,255,0.9)", "#DC2626CC", "#991B1BCC", "#991B1BCC", "rgba(255,255,255,0.9)", "rgba(255,255,255,0.9)", "#991B1BCC", "rgba(255,255,255,0.9)", "#DC2626CC", "rgba(255,255,255,0.9)", "#991B1BCC", "#DC2626CC", "rgba(255,255,255,0.9)", "rgba(255,255,255,0.9)", "rgba(255,255,255,0.9)", "#DC2626CC", "#DC2626CC", "rgba(255,255,255,0.9)", "#DC2626CC", "#991B1BCC", "#DC2626CC", "#DC2626CC", "#DC2626CC", "#DC2626CC", "rgba(255,255,255,0.9)", "rgba(255,255,255,0.9)", "rgba(255,255,255,0.9)", "rgba(255,255,255,0.9)", "rgba(255,255,255,0.9)", "#991B1BCC", "rgba(255,255,255,0.9)", "#DC2626CC", "#DC2626CC", "rgba(255,255,255,0.9)", "rgba(255,255,255,0.9)", "rgba(255,255,255,0.9)", "#DC2626CC", "rgba(255,255,255,0.9)", "rgba(255,255,255,0.9)", "rgba(255,255,255,0.9)", "#991B1BCC", "#DC2626CC", "#DC2626CC", "rgba(255,255,255,0.9)", "rgba(255,255,255,0.9)", "rgba(255,255,255,0.9)" ], "pointStyle": [ "circle", "triangle", "triangle", "circle", "triangle", "circle", "triangle", "triangle", "circle", "triangle", "circle", "circle", "triangle", "circle", "triangle", "triangle", "circle", "triangle", "circle", "circle", "circle", "circle", "circle", "triangle", "triangle", "circle", "circle", "circle", "circle", "circle", "circle", "triangle", "triangle", "triangle", "circle", "circle", "circle", "circle", "circle", "circle", "circle", "circle", "circle", "circle", "triangle", "circle", "triangle", "triangle", "triangle", "triangle", "triangle", "circle" ], "pointRadius": [ 4, 5.5, 5.5, 4, 5.5, 4, 5.5, 5.5, 4, 5.5, 4, 4, 5.5, 4, 5.5, 5.5, 4, 5.5, 4, 4, 4, 4, 4, 5.5, 5.5, 4, 4, 4, 4, 4, 4, 5.5, 5.5, 5.5, 4, 4, 4, 4, 4, 4, 4, 4, 4, 4, 5.5, 4, 5.5, 5.5, 5.5, 5.5, 5.5, 4 ], "pointBorderWidth": 1, "pointBorderColor": "#991B1BCC", "fill": true }, { "label": "Quarters", "data": [ { "x": 1, "y": 0 }, { "x": 1, "y": 1 }, { "x": 52, "y": 1 }, { "x": 52, "y": 0 }, { "x": 8, "y": 0 }, { "x": 8, "y": 1 }, { "x": 52, "y": 1 }, { "x": 52, "y": 0 }, { "x": 25, "y": 0 }, { "x": 25, "y": 1 }, { "x": 52, "y": 1 }, { "x": 52, "y": 0 }, { "x": 39, "y": 0 }, { "x": 39, "y": 1 }, { "x": 52, "y": 1 }, { "x": 52, "y": 0 } ], "borderColor": "rgba(0,0,0,0.1)", "borderWidth": 1, "tension": 0, "fill": false, "pointRadius": 0, "showLine": true, "datalabels": { "display": false } } ], "currentParams": { "year": 2025, "week": 5, "seasonType": "regular", "team": "Alabama", "gameId": "401752718" } }; // Chart options (WordPress-safe) const chartOptions = { responsive: true, maintainAspectRatio: false, animation: { duration: 0 // Disable animations to prevent conflicts }, elements: 'line' === 'line' ? 'opponent-rush-rate'.includes('play-map') ? { line: { tension: 0, borderWidth: 0 } } : { line: { tension: 0.25, borderWidth: 2.2 }, point: { pointRadius: 'opponent-rush-rate'.includes('team-lines') ? 0 : undefined } } : {}, plugins: { datalabels: { display: function(context) { // Suppress data labels on line charts if ('line' === 'line') { return false; } return context.dataset.datalabels && context.dataset.datalabels.display === true; }, formatter: function(value, context) { // Special handling for Overall Team Performance chart if ('opponent-rush-rate' === 'overall-team-performance' && context.dataset.label === 'Success Rate (SR)') { // Use the stored play count data if (context.dataset.playCountData && context.dataset.playCountData[context.dataIndex]) { return context.dataset.playCountData[context.dataIndex]; } // Fallback to percentage if play count data not available return Math.round(value * 100) + '%'; } // Handle bar charts with count data (play-type, quarter, down, etc.) if (context.dataset.label && context.dataset.label.includes(' SR') && (chartData.teamCounts || chartData.oppCounts)) { // Find the first team SR dataset in the chart to determine team order const allDatasets = context.chart.data.datasets; const teamSRDataset = allDatasets.find(d => d.label && d.label.includes(' SR') && !d.label.includes('NCAA')); // If this is the first team's SR dataset, use teamCounts if (teamSRDataset && context.dataset.label === teamSRDataset.label && chartData.teamCounts) { return chartData.teamCounts[context.dataIndex] || 0; } // Otherwise, use oppCounts for the second team else if (chartData.oppCounts) { return chartData.oppCounts[context.dataIndex] || 0; } } // For player charts, show value only if > 0 (matches non-embedded behavior) if ('opponent-rush-rate'.includes('top-rushers') || 'opponent-rush-rate'.includes('top-passers') || 'opponent-rush-rate'.includes('top-receivers')) { // Hide data labels for zero or negative values, show actual value for positive values return value > 0 ? value : null; } // For other charts, show values based on type if (typeof value === 'number') { // If value is between 0 and 1, treat as percentage if (value >= 0 && value 0 ? '#26262660' : 'transparent'; }, borderColor: function(context) { const value = context.dataset.data[context.dataIndex]; return value > 0 ? 'rgba(255, 255, 255, 0.2)' : 'transparent'; }, borderRadius: 4, align: 'center', anchor: 'center' }, legend: 'line' === 'line' ? { position: 'top', align: 'start', labels: 'opponent-rush-rate'.includes('play-map') ? { usePointStyle: true, generateLabels: function(chart) { // Call the original generateLabels to get default styling const original = Chart.defaults.plugins.legend.labels.generateLabels; const labels = original.call(this, chart); // Filter and customize each label const filteredLabels = labels.filter(label => { return !label.text.includes(' { const dataset = chart.data.datasets[label.datasetIndex]; if (dataset && dataset.label) { if (dataset.label.includes('Rush')) { label.pointStyle = 'circle'; label.pointStyleWidth = 4; label.fillStyle = 'white'; } else if (dataset.label.includes('Pass')) { label.pointStyle = 'triangle'; label.pointStyleWidth = 4; label.fillStyle = 'white'; } else { label.pointStyle = 'rect'; label.pointStyleWidth = 4; label.fillStyle = 'white'; } } }); return filteredLabels; }, boxWidth: 20, padding: 12 } : { usePointStyle: false, boxWidth: 12, boxHeight: 12, padding: 12, generateLabels: function(chart) { const original = Chart.defaults.plugins.legend.labels.generateLabels; const labels = original.call(this, chart); // Filter out reference areas and ensure white fill const filteredLabels = labels.filter(label => { return !label.text.includes('NCAA Avg SR') && !label.text.includes('50/50') && !label.text.includes('Quarters'); }); // Ensure white fill for all line chart legend boxes filteredLabels.forEach((label) => { label.fillStyle = 'white'; }); return filteredLabels; } } } : { position: 'top', align: 'start', labels: { usePointStyle: false, boxWidth: 12, boxHeight: 12, padding: 12, filter: function(legendItem, chartData) { return !legendItem.text.includes('NCAA Avg SR') && !legendItem.text.includes('Quarters') && !legendItem.text.includes('50/50'); }, generateLabels: function(chart) { const data = chart.data; if (data.datasets.length) { return data.datasets.map((dataset, i) => { // Handle backgroundColor arrays (like in Overall Team Performance chart) let fillColor = dataset.backgroundColor; if (dataset.label === '# Plays') { fillColor = 'white'; } else if (Array.isArray(dataset.backgroundColor)) { // For datasets with backgroundColor arrays, use the first color for legend fillColor = dataset.backgroundColor[0]; } return { text: dataset.label, fillStyle: fillColor, strokeStyle: dataset.label === '# Plays' ? '#666' : dataset.borderColor, lineWidth: dataset.label === '# Plays' ? 1 : dataset.borderWidth, hidden: !chart.isDatasetVisible(i), datasetIndex: i }; }).filter((item, index) => { // Apply the same filter logic as above const dataset = chart.data.datasets[index]; if (!dataset || !dataset.data) return false; if (dataset.label === '# Plays') return true; // Always show # Plays if (dataset.label && (dataset.label.includes('NCAA Avg SR') || dataset.label.includes('Quarters') || dataset.label.includes('50/50'))) return false; return dataset.data.some((value) => value > 0); }); } return []; } } }, tooltip: { filter: function(tooltipItem) { if ('opponent-rush-rate'.includes('play-map')) { return !tooltipItem.dataset.label.includes('< 0') && !tooltipItem.dataset.label.includes('Quarters') && !tooltipItem.dataset.label.includes('Drive'); } return !tooltipItem.dataset.label.includes('NCAA Avg SR') && !tooltipItem.dataset.label.includes('50/50') && !tooltipItem.dataset.label.includes('< 0') && !tooltipItem.dataset.label.includes('Quarters'); }, callbacks: { label: function(context) { const label = context.dataset.label || ''; let labelText; // Play maps show yards instead of percentages if ('opponent-rush-rate'.includes('play-map')) { labelText = label + ': ' + context.parsed.y + ' yards'; } else { const value = Math.round(context.parsed.y * 100); labelText = label + ': ' + value + '%'; } // For line charts, include play text if available if ('line' === 'line' && context.raw && context.raw.text) { return [labelText, context.raw.text]; } return labelText; } } } }, scales: 'line' === 'line' ? 'opponent-rush-rate'.includes('play-map') ? { x: { type: 'linear', position: 'bottom', title: { display: true, text: 'Play Number' }, min: 1, ticks: { stepSize: 1, callback: function(value) { return Math.floor(value); } }, grid: { display: false } }, y: { title: { display: true, text: 'Yards Gained' }, min: chartData.minY, max: chartData.maxY } } : { x: { type: 'linear', position: 'bottom', title: { display: true, text: 'opponent-rush-rate'.includes('team-lines') ? 'Play Number' : 'Team Play Number' }, min: 1, ticks: { stepSize: 1, callback: function(value) { return Math.floor(value); } }, grid: { display: false } }, y: { max: 1, min: 0, ticks: { callback: function(value) { return Math.round(value * 100) + '%'; } } } } : 'opponent-rush-rate'.includes('drive-metrics') ? { y: { stacked: false, max: 1, ticks: { callback: function(value) { return Math.round(value * 100) + '%'; } } }, y1: { display: false, type: 'linear', position: 'right' } } : ('opponent-rush-rate'.includes('top-rushers') || 'opponent-rush-rate'.includes('top-passers') || 'opponent-rush-rate'.includes('top-receivers')) ? { x: { stacked: true }, y: { stacked: true } } : { y: { max: 1, min: 0, stacked: false, ticks: { callback: function(value) { return Math.round(value * 100) + '%'; } } } } }; // Add indexAxis for player charts if ('opponent-rush-rate'.includes('top-rushers') || 'opponent-rush-rate'.includes('top-passers') || 'opponent-rush-rate'.includes('top-receivers')) { chartOptions.indexAxis = 'y'; } // Initialize the chart const ctx = canvas.getContext('2d'); const chart = new Chart(ctx, { type: 'line', data: chartData, options: chartOptions }); // Store reference to prevent re-initialization canvas.chartInstance = chart; console.log('CFB Chart initialized successfully'); } catch (error) { console.error('Error initializing CFB chart:', error); // Fallback: show error message in canvas container const container = document.getElementById('cfb-chart-1759110728998-am17andhr').parentNode; if (container) { container.innerHTML = '
Chart failed to load. Please refresh the page.
'; } } } // Initialize when DOM is ready if (document.readyState === 'loading') { document.addEventListener('DOMContentLoaded', initChart); } else { initChart(); } // Also try initialization after a short delay for WordPress compatibility setTimeout(initChart, 500); })();
How did the Georgia offense suddenly wake up and start performing, you might ask? Well, they started the game passing from QB Gunner Stockton’s hands, which was a decision that was not excellent in the 1st quarter. But before they went into the half, it apparently dawned on the Dawgs them that they could run right through the Alabama D, at least some of the time: they’d either put up a huge explosive rush, or flounder near the line of scrimmage. But, after halftime, those unsuccessful plays became successful ones, and their rushing game was really going (especially in the 3rd quarter).
Rush Rate: Alabama body { font-family: -apple-system, BlinkMacSystemFont, 'Segoe UI', 'Roboto', sans-serif; margin: 0; padding: 20px; background: #f8fafc; } .chart-container { background: white; border-radius: 12px; border: 1px solid #e5e5e5; box-shadow: 0 1px 3px rgba(0, 0, 0, 0.1); overflow: hidden; } .chart-header { padding: 18px 24px 16px; border-bottom: 1px solid #e5e5e5; background: white; } .chart-title { font-size: 18px; font-weight: 600; color: #171717; margin: 0; } .chart-content { padding: 20px 24px 24px !important; } @media (max-width: 640px) { .chart-content { padding: 12px 16px 20px !important; } .chart-header { padding: 12px 16px 12px !important; } .embed-footer-top { padding: 8px 12px !important; } .data-definitions { padding: 12px !important; } body { padding: 12px !important; } } .chart-content.top-receivers { height: 624px; } .chart-content.top-passers { height: 280px !important; } .chart-content.top-rushers { height: 372px; } .chart-content:not(.top-receivers):not(.top-passers):not(.top-rushers) { height: 372px; } .embed-footer { border-top: 1px solid #e5e5e5; font-size: 12px; color: #737373; } .embed-footer-top { display: flex; justify-content: space-between; align-items: center; padding: 12px 16px; } .embed-footer-link { color: #737373; text-decoration: none; font-weight: 500; } .embed-footer-link:hover { color: #525252; text-decoration: underline; } .data-definitions-toggle { background: none; border: none; color: #737373; font-size: 12px; font-weight: 500; cursor: pointer; display: flex; align-items: center; gap: 4px; padding: 0; } .data-definitions-toggle:hover { color: #525252; } .caret { transition: transform 0.2s ease; font-size: 10px; } .caret.expanded { transform: rotate(180deg); } .data-definitions { display: none; padding: 16px; background: #fafafa; border-top: 1px solid #e5e5e5; font-size: 12px; line-height: 1.4; } .data-definitions.expanded { display: block; } .data-definitions ul { margin: 0; padding-left: 0; list-style: none; } .data-definitions li { margin-bottom: 4px; }
// Toggle data definitions accordion - unique function per embed function toggleDefinitions_cfb_chart_1759110739564_o2rou6jh0() { const definitions = document.getElementById('dataDefinitions_cfb-chart-1759110739564-o2rou6jh0'); const caret = document.getElementById('caret_cfb-chart-1759110739564-o2rou6jh0'); if (definitions.classList.contains('expanded')) { definitions.classList.remove('expanded'); caret.classList.remove('expanded'); } else { definitions.classList.add('expanded'); caret.classList.add('expanded'); } } // WordPress-safe chart initialization with defensive checks (function() { 'use strict'; function initChart() { // Check if Chart.js is available if (typeof Chart === 'undefined') { console.warn('Chart.js not loaded yet, retrying...'); setTimeout(initChart, 100); return; } // Check if datalabels plugin is available if (typeof ChartDataLabels === 'undefined') { console.warn('ChartDataLabels plugin not loaded yet, retrying...'); setTimeout(initChart, 100); return; } // Check if canvas element exists const canvas = document.getElementById('cfb-chart-1759110739564-o2rou6jh0'); if (!canvas) { console.warn('Canvas element not found yet, retrying...'); setTimeout(initChart, 100); return; } // Prevent multiple chart instances if (canvas.chartInstance) { console.log('Chart already initialized'); return; } try { // Register the datalabels plugin Chart.register(ChartDataLabels); // Embed actual chart data directly const chartData = { "datasets": [ { "label": "50/50", "data": [ { "x": 1, "y": 0 }, { "x": 1, "y": 0.5 }, { "x": 77, "y": 0.5 }, { "x": 77, "y": 0 } ], "backgroundColor": "rgba(0,0,0,0.03)", "borderColor": "transparent", "pointRadius": 0, "fill": true, "tension": 0, "showLine": true, "datalabels": { "display": false } }, { "data": [ { "x": 1, "y": 1, "text": "Jam Miller run for 2 yds to the ALA 28" }, { "x": 2, "y": 0.5, "text": "Ty Simpson pass incomplete to Isaiah Horton" }, { "x": 3, "y": 0.6666666666666666, "text": "Ty Simpson run for 10 yds to the ALA 38 for a 1ST down" }, { "x": 4, "y": 0.75, "text": "Jam Miller run for no gain to the ALA 38" }, { "x": 5, "y": 0.6, "text": "Ty Simpson pass incomplete to Ryan Williams" }, { "x": 6, "y": 0.5, "text": "Ty Simpson pass complete to Isaiah Horton for 10 yds to the ALA 48 for a 1ST down" }, { "x": 7, "y": 0.42857142857142855, "text": "Ty Simpson pass incomplete to Isaiah Horton" }, { "x": 8, "y": 0.5, "text": "Kevin Riley run for 5 yds to the UGA 47" }, { "x": 9, "y": 0.4444444444444444, "text": "Ty Simpson pass complete to Isaiah Horton for 24 yds to the UGA 23 for a 1ST down" }, { "x": 10, "y": 0.5, "text": "Jam Miller run for 2 yds to the UGA 26" }, { "x": 11, "y": 0.45454545454545453, "text": "Ty Simpson pass complete to Germie Bernard for 18 yds to the UGA 8 for a 1ST down" }, { "x": 12, "y": 0.5, "text": "Jam Miller run for 2 yds to the UGA 6" }, { "x": 13, "y": 0.46153846153846156, "text": "Ty Simpson pass incomplete to Isaiah Horton" }, { "x": 14, "y": 0.42857142857142855, "text": "Ty Simpson pass complete to Germie Bernard for 6 yds for a TD (Conor Talty KICK)" }, { "x": 15, "y": 0.4666666666666667, "text": "Jam Miller run for 3 yds to the ALA 20" }, { "x": 16, "y": 0.4375, "text": "Ty Simpson pass incomplete to Germie Bernard" }, { "x": 17, "y": 0.4117647058823529, "text": "Ty Simpson pass complete to Josh Cuevas for 12 yds to the ALA 32 for a 1ST down" }, { "x": 18, "y": 0.3888888888888889, "text": "Germie Bernard sacked by Chris Cole for a loss of 6 yards to the ALA 26" }, { "x": 19, "y": 0.3684210526315789, "text": "Ty Simpson pass complete to Kevin Riley for 10 yds to the ALA 36" }, { "x": 20, "y": 0.35, "text": "Ty Simpson pass complete to Ryan Williams for 7 yds to the ALA 43 for a 1ST down" }, { "x": 21, "y": 0.3333333333333333, "text": "Ty Simpson pass complete to Germie Bernard for 5 yds to the ALA 48" }, { "x": 22, "y": 0.36363636363636365, "text": "Jam Miller run for 3 yds to the UGA 49" }, { "x": 23, "y": 0.391304347826087, "text": "Germie Bernard run for 11 yds to the UGA 38 for a 1ST down" }, { "x": 24, "y": 0.375, "text": "Ty Simpson pass complete to Lotzeir Brooks for 19 yds to the UGA 19 for a 1ST down" }, { "x": 25, "y": 0.4, "text": "Kevin Riley run for 4 yds to the UGA 15" }, { "x": 26, "y": 0.4230769230769231, "text": "Jam Miller run for 2 yds to the UGA 13" }, { "x": 27, "y": 0.4444444444444444, "text": "Jam Miller run for 7 yds to the UGA 6 for a 1ST down" }, { "x": 28, "y": 0.42857142857142855, "text": "Ty Simpson pass complete to Isaiah Horton for 6 yds for a TD (Conor Talty KICK)" }, { "x": 29, "y": 0.41379310344827586, "text": "Ty Simpson pass complete to Kevin Riley for 27 yds to the UGA 48 for a 1ST down" }, { "x": 30, "y": 0.4, "text": "Ty Simpson pass complete to Germie Bernard for 2 yds to the UGA 46" }, { "x": 31, "y": 0.41935483870967744, "text": "Kevin Riley run for 1 yd to the UGA 45" }, { "x": 32, "y": 0.40625, "text": "Ty Simpson pass incomplete to Rico Scott" }, { "x": 33, "y": 0.42424242424242425, "text": "Jam Miller run for 3 yds to the UGA 8" }, { "x": 34, "y": 0.4411764705882353, "text": "Jam Miller run for 2 yds to the UGA 6" }, { "x": 35, "y": 0.42857142857142855, "text": "Ty Simpson pass incomplete to Germie Bernard" }, { "x": 36, "y": 0.4444444444444444, "text": "Kevin Riley run for 2 yds to the ALA 27" }, { "x": 37, "y": 0.43243243243243246, "text": "Ty Simpson pass complete to Ryan Williams for 7 yds to the ALA 34" }, { "x": 38, "y": 0.42105263157894735, "text": "Germie Bernard pass complete to Isaiah Horton for 4 yds to the ALA 38 for a 1ST down" }, { "x": 39, "y": 0.41025641025641024, "text": "Ty Simpson pass complete to Ryan Williams for 18 yds to the UGA 44 for a 1ST down" }, { "x": 40, "y": 0.4, "text": "Ty Simpson pass incomplete to Ryan Williams" }, { "x": 41, "y": 0.3902439024390244, "text": "Ty Simpson pass complete to Lotzeir Brooks for 21 yds to the UGA 23 for a 1ST down" }, { "x": 42, "y": 0.40476190476190477, "text": "Kadyn Proctor run for 11 yds to the UGA 2 for a 1ST down" }, { "x": 43, "y": 0.4186046511627907, "text": "Ty Simpson run for 2 yds for a TD (Conor Talty KICK)" }, { "x": 44, "y": 0.4090909090909091, "text": "Ty Simpson pass complete to Jam Miller for 14 yds to the ALA 39 for a 1ST down" }, { "x": 45, "y": 0.4222222222222222, "text": "Jam Miller run for 4 yds to the ALA 43" }, { "x": 46, "y": 0.43478260869565216, "text": "Germie Bernard run for 8 yds to the UGA 49 for a 1ST down" }, { "x": 47, "y": 0.44680851063829785, "text": "Kevin Riley run for 4 yds to the UGA 45" }, { "x": 48, "y": 0.4583333333333333, "text": "Kevin Riley run for 3 yds to the UGA 42" }, { "x": 49, "y": 0.4489795918367347, "text": "Ty Simpson pass complete to Kaleb Edwards for 17 yds to the UGA 25 for a 1ST down" }, { "x": 50, "y": 0.44, "text": "Ty Simpson pass complete to Jam Miller for a loss of 2 yards to the UGA 27" }, { "x": 51, "y": 0.45098039215686275, "text": "Germie Bernard run for 1 yd to the UGA 26" }, { "x": 52, "y": 0.4423076923076923, "text": "Ty Simpson pass incomplete to Josh Cuevas" }, { "x": 53, "y": 0.4339622641509434, "text": "Ty Simpson pass complete to Germie Bernard for 4 yds to the ALA 29" }, { "x": 54, "y": 0.4444444444444444, "text": "Kevin Riley run for 5 yds to the ALA 49" }, { "x": 55, "y": 0.45454545454545453, "text": "Kevin Riley run for 4 yds to the UGA 47" }, { "x": 56, "y": 0.4642857142857143, "text": "Kevin Riley run for no gain to the UGA 47" }, { "x": 57, "y": 0.47368421052631576, "text": "Ty Simpson run for a loss of 2 yards to the UGA 49" }, { "x": 58, "y": 0.46551724137931033, "text": "Ty Simpson pass incomplete to Germie Bernard" }, { "x": 59, "y": 0.4576271186440678, "text": "Ty Simpson pass incomplete to Rico Scott" }, { "x": 60, "y": 0.45, "text": "Ty Simpson pass incomplete to Ryan Williams" }, { "x": 61, "y": 0.45901639344262296, "text": "Kevin Riley run for 2 yds to the ALA 13" }, { "x": 62, "y": 0.45161290322580644, "text": "Ty Simpson pass incomplete to Germie Bernard" }, { "x": 63, "y": 0.4444444444444444, "text": "Ty Simpson pass complete to Ryan Williams for 9 yds to the ALA 22 for a 1ST down" }, { "x": 64, "y": 0.453125, "text": "Jam Miller run for 2 yds to the ALA 24" }, { "x": 65, "y": 0.4461538461538462, "text": "Ty Simpson pass complete to Isaiah Horton for 21 yds to the ALA 45 for a 1ST down" }, { "x": 66, "y": 0.4393939393939394, "text": "Ty Simpson pass complete to Josh Cuevas for 12 yds to the UGA 43 for a 1ST down" }, { "x": 67, "y": 0.43283582089552236, "text": "Ty Simpson pass complete to Ryan Williams for 2 yds to the UGA 46" }, { "x": 68, "y": 0.4411764705882353, "text": "Germie Bernard run for 6 yds to the UGA 40" }, { "x": 69, "y": 0.43478260869565216, "text": "Ty Simpson pass incomplete to Isaiah Horton" }, { "x": 70, "y": 0.44285714285714284, "text": "Jam Miller run for 7 yds to the ALA 19" }, { "x": 71, "y": 0.4507042253521127, "text": "Jam Miller run for 2 yds to the ALA 21" }, { "x": 72, "y": 0.4583333333333333, "text": "Ty Simpson run for 2 yds to the ALA 23 for a 1ST down Georgia Penalty, Personal Foul (Ellis Robinson IV) to the ALA 38 for a 1ST down" }, { "x": 73, "y": 0.4657534246575342, "text": "Jam Miller run for 6 yds to the ALA 44" }, { "x": 74, "y": 0.47297297297297297, "text": "Jam Miller run for a loss of 1 yard to the ALA 43" }, { "x": 75, "y": 0.4666666666666667, "text": "Ty Simpson pass complete to Jam Miller for 7 yds to the 50 yard line for a 1ST down" }, { "x": 76, "y": 0.47368421052631576, "text": "TEAM run for a loss of 1 yard to the ALA 49" }, { "x": 77, "y": 0.4805194805194805, "text": "TEAM run for a loss of 1 yard to the ALA 48" } ], "label": "Alabama Rush Rate", "borderColor": "rgba(101, 0, 20, 0.8)", "backgroundColor": "rgba(245, 229, 233, 0.8)", "borderWidth": 2, "pointBackgroundColor": [ "rgba(255,255,255,0.9)", "rgba(255,255,255,0.9)", "rgba(175, 40, 60, 0.8)", "rgba(255,255,255,0.9)", "rgba(255,255,255,0.9)", "rgba(175, 40, 60, 0.8)", "rgba(255,255,255,0.9)", "rgba(255,255,255,0.9)", "rgba(101, 0, 20, 0.8)", "rgba(255,255,255,0.9)", "rgba(101, 0, 20, 0.8)", "rgba(255,255,255,0.9)", "rgba(255,255,255,0.9)", "rgba(175, 40, 60, 0.8)", "rgba(255,255,255,0.9)", "rgba(255,255,255,0.9)", "rgba(175, 40, 60, 0.8)", "rgba(255,255,255,0.9)", "rgba(255,255,255,0.9)", "rgba(175, 40, 60, 0.8)", "rgba(175, 40, 60, 0.8)", "rgba(255,255,255,0.9)", "rgba(175, 40, 60, 0.8)", "rgba(101, 0, 20, 0.8)", "rgba(255,255,255,0.9)", "rgba(255,255,255,0.9)", "rgba(175, 40, 60, 0.8)", "rgba(175, 40, 60, 0.8)", "rgba(101, 0, 20, 0.8)", "rgba(255,255,255,0.9)", "rgba(255,255,255,0.9)", "rgba(255,255,255,0.9)", "rgba(255,255,255,0.9)", "rgba(255,255,255,0.9)", "rgba(255,255,255,0.9)", "rgba(255,255,255,0.9)", "rgba(175, 40, 60, 0.8)", "rgba(175, 40, 60, 0.8)", "rgba(101, 0, 20, 0.8)", "rgba(255,255,255,0.9)", "rgba(101, 0, 20, 0.8)", "rgba(175, 40, 60, 0.8)", "rgba(175, 40, 60, 0.8)", "rgba(175, 40, 60, 0.8)", "rgba(255,255,255,0.9)", "rgba(175, 40, 60, 0.8)", "rgba(255,255,255,0.9)", "rgba(255,255,255,0.9)", "rgba(101, 0, 20, 0.8)", "rgba(255,255,255,0.9)", "rgba(255,255,255,0.9)", "rgba(255,255,255,0.9)", "rgba(255,255,255,0.9)", "rgba(175, 40, 60, 0.8)", "rgba(175, 40, 60, 0.8)", "rgba(255,255,255,0.9)", "rgba(255,255,255,0.9)", "rgba(255,255,255,0.9)", "rgba(255,255,255,0.9)", "rgba(255,255,255,0.9)", "rgba(255,255,255,0.9)", "rgba(255,255,255,0.9)", "rgba(175, 40, 60, 0.8)", "rgba(255,255,255,0.9)", "rgba(101, 0, 20, 0.8)", "rgba(175, 40, 60, 0.8)", "rgba(255,255,255,0.9)", "rgba(255,255,255,0.9)", "rgba(255,255,255,0.9)", "rgba(175, 40, 60, 0.8)", "rgba(255,255,255,0.9)", "rgba(101, 0, 20, 0.8)", "rgba(175, 40, 60, 0.8)", "rgba(255,255,255,0.9)", "rgba(175, 40, 60, 0.8)", "rgba(255,255,255,0.9)", "rgba(255,255,255,0.9)" ], "pointStyle": [ "circle", "triangle", "circle", "circle", "triangle", "triangle", "triangle", "circle", "triangle", "circle", "triangle", "circle", "triangle", "triangle", "circle", "triangle", "triangle", "triangle", "triangle", "triangle", "triangle", "circle", "circle", "triangle", "circle", "circle", "circle", "triangle", "triangle", "triangle", "circle", "triangle", "circle", "circle", "triangle", "circle", "triangle", "triangle", "triangle", "triangle", "triangle", "circle", "circle", "triangle", "circle", "circle", "circle", "circle", "triangle", "triangle", "circle", "triangle", "triangle", "circle", "circle", "circle", "circle", "triangle", "triangle", "triangle", "circle", "triangle", "triangle", "circle", "triangle", "triangle", "triangle", "circle", "triangle", "circle", "circle", "circle", "circle", "circle", "triangle", "circle", "circle" ], "pointRadius": [ 4, 5.5, 4, 4, 5.5, 5.5, 5.5, 4, 5.5, 4, 5.5, 4, 5.5, 5.5, 4, 5.5, 5.5, 5.5, 5.5, 5.5, 5.5, 4, 4, 5.5, 4, 4, 4, 5.5, 5.5, 5.5, 4, 5.5, 4, 4, 5.5, 4, 5.5, 5.5, 5.5, 5.5, 5.5, 4, 4, 5.5, 4, 4, 4, 4, 5.5, 5.5, 4, 5.5, 5.5, 4, 4, 4, 4, 5.5, 5.5, 5.5, 4, 5.5, 5.5, 4, 5.5, 5.5, 5.5, 4, 5.5, 4, 4, 4, 4, 4, 5.5, 4, 4 ], "pointBorderWidth": 1, "pointBorderColor": "rgba(101, 0, 20, 0.8)", "fill": true }, { "label": "Quarters", "data": [ { "x": 1, "y": 0 }, { "x": 1, "y": 1 }, { "x": 77, "y": 1 }, { "x": 77, "y": 0 }, { "x": 26, "y": 0 }, { "x": 26, "y": 1 }, { "x": 77, "y": 1 }, { "x": 77, "y": 0 }, { "x": 44, "y": 0 }, { "x": 44, "y": 1 }, { "x": 77, "y": 1 }, { "x": 77, "y": 0 }, { "x": 61, "y": 0 }, { "x": 61, "y": 1 }, { "x": 77, "y": 1 }, { "x": 77, "y": 0 } ], "borderColor": "rgba(0,0,0,0.1)", "borderWidth": 1, "tension": 0, "fill": false, "pointRadius": 0, "showLine": true, "datalabels": { "display": false } } ], "currentParams": { "year": 2025, "week": 5, "seasonType": "regular", "team": "Alabama", "gameId": "401752718" } }; // Chart options (WordPress-safe) const chartOptions = { responsive: true, maintainAspectRatio: false, animation: { duration: 0 // Disable animations to prevent conflicts }, elements: 'line' === 'line' ? 'team-rush-rate'.includes('play-map') ? { line: { tension: 0, borderWidth: 0 } } : { line: { tension: 0.25, borderWidth: 2.2 }, point: { pointRadius: 'team-rush-rate'.includes('team-lines') ? 0 : undefined } } : {}, plugins: { datalabels: { display: function(context) { // Suppress data labels on line charts if ('line' === 'line') { return false; } return context.dataset.datalabels && context.dataset.datalabels.display === true; }, formatter: function(value, context) { // Special handling for Overall Team Performance chart if ('team-rush-rate' === 'overall-team-performance' && context.dataset.label === 'Success Rate (SR)') { // Use the stored play count data if (context.dataset.playCountData && context.dataset.playCountData[context.dataIndex]) { return context.dataset.playCountData[context.dataIndex]; } // Fallback to percentage if play count data not available return Math.round(value * 100) + '%'; } // Handle bar charts with count data (play-type, quarter, down, etc.) if (context.dataset.label && context.dataset.label.includes(' SR') && (chartData.teamCounts || chartData.oppCounts)) { // Find the first team SR dataset in the chart to determine team order const allDatasets = context.chart.data.datasets; const teamSRDataset = allDatasets.find(d => d.label && d.label.includes(' SR') && !d.label.includes('NCAA')); // If this is the first team's SR dataset, use teamCounts if (teamSRDataset && context.dataset.label === teamSRDataset.label && chartData.teamCounts) { return chartData.teamCounts[context.dataIndex] || 0; } // Otherwise, use oppCounts for the second team else if (chartData.oppCounts) { return chartData.oppCounts[context.dataIndex] || 0; } } // For player charts, show value only if > 0 (matches non-embedded behavior) if ('team-rush-rate'.includes('top-rushers') || 'team-rush-rate'.includes('top-passers') || 'team-rush-rate'.includes('top-receivers')) { // Hide data labels for zero or negative values, show actual value for positive values return value > 0 ? value : null; } // For other charts, show values based on type if (typeof value === 'number') { // If value is between 0 and 1, treat as percentage if (value >= 0 && value 0 ? '#26262660' : 'transparent'; }, borderColor: function(context) { const value = context.dataset.data[context.dataIndex]; return value > 0 ? 'rgba(255, 255, 255, 0.2)' : 'transparent'; }, borderRadius: 4, align: 'center', anchor: 'center' }, legend: 'line' === 'line' ? { position: 'top', align: 'start', labels: 'team-rush-rate'.includes('play-map') ? { usePointStyle: true, generateLabels: function(chart) { // Call the original generateLabels to get default styling const original = Chart.defaults.plugins.legend.labels.generateLabels; const labels = original.call(this, chart); // Filter and customize each label const filteredLabels = labels.filter(label => { return !label.text.includes(' { const dataset = chart.data.datasets[label.datasetIndex]; if (dataset && dataset.label) { if (dataset.label.includes('Rush')) { label.pointStyle = 'circle'; label.pointStyleWidth = 4; label.fillStyle = 'white'; } else if (dataset.label.includes('Pass')) { label.pointStyle = 'triangle'; label.pointStyleWidth = 4; label.fillStyle = 'white'; } else { label.pointStyle = 'rect'; label.pointStyleWidth = 4; label.fillStyle = 'white'; } } }); return filteredLabels; }, boxWidth: 20, padding: 12 } : { usePointStyle: false, boxWidth: 12, boxHeight: 12, padding: 12, generateLabels: function(chart) { const original = Chart.defaults.plugins.legend.labels.generateLabels; const labels = original.call(this, chart); // Filter out reference areas and ensure white fill const filteredLabels = labels.filter(label => { return !label.text.includes('NCAA Avg SR') && !label.text.includes('50/50') && !label.text.includes('Quarters'); }); // Ensure white fill for all line chart legend boxes filteredLabels.forEach((label) => { label.fillStyle = 'white'; }); return filteredLabels; } } } : { position: 'top', align: 'start', labels: { usePointStyle: false, boxWidth: 12, boxHeight: 12, padding: 12, filter: function(legendItem, chartData) { return !legendItem.text.includes('NCAA Avg SR') && !legendItem.text.includes('Quarters') && !legendItem.text.includes('50/50'); }, generateLabels: function(chart) { const data = chart.data; if (data.datasets.length) { return data.datasets.map((dataset, i) => { // Handle backgroundColor arrays (like in Overall Team Performance chart) let fillColor = dataset.backgroundColor; if (dataset.label === '# Plays') { fillColor = 'white'; } else if (Array.isArray(dataset.backgroundColor)) { // For datasets with backgroundColor arrays, use the first color for legend fillColor = dataset.backgroundColor[0]; } return { text: dataset.label, fillStyle: fillColor, strokeStyle: dataset.label === '# Plays' ? '#666' : dataset.borderColor, lineWidth: dataset.label === '# Plays' ? 1 : dataset.borderWidth, hidden: !chart.isDatasetVisible(i), datasetIndex: i }; }).filter((item, index) => { // Apply the same filter logic as above const dataset = chart.data.datasets[index]; if (!dataset || !dataset.data) return false; if (dataset.label === '# Plays') return true; // Always show # Plays if (dataset.label && (dataset.label.includes('NCAA Avg SR') || dataset.label.includes('Quarters') || dataset.label.includes('50/50'))) return false; return dataset.data.some((value) => value > 0); }); } return []; } } }, tooltip: { filter: function(tooltipItem) { if ('team-rush-rate'.includes('play-map')) { return !tooltipItem.dataset.label.includes('< 0') && !tooltipItem.dataset.label.includes('Quarters') && !tooltipItem.dataset.label.includes('Drive'); } return !tooltipItem.dataset.label.includes('NCAA Avg SR') && !tooltipItem.dataset.label.includes('50/50') && !tooltipItem.dataset.label.includes('< 0') && !tooltipItem.dataset.label.includes('Quarters'); }, callbacks: { label: function(context) { const label = context.dataset.label || ''; let labelText; // Play maps show yards instead of percentages if ('team-rush-rate'.includes('play-map')) { labelText = label + ': ' + context.parsed.y + ' yards'; } else { const value = Math.round(context.parsed.y * 100); labelText = label + ': ' + value + '%'; } // For line charts, include play text if available if ('line' === 'line' && context.raw && context.raw.text) { return [labelText, context.raw.text]; } return labelText; } } } }, scales: 'line' === 'line' ? 'team-rush-rate'.includes('play-map') ? { x: { type: 'linear', position: 'bottom', title: { display: true, text: 'Play Number' }, min: 1, ticks: { stepSize: 1, callback: function(value) { return Math.floor(value); } }, grid: { display: false } }, y: { title: { display: true, text: 'Yards Gained' }, min: chartData.minY, max: chartData.maxY } } : { x: { type: 'linear', position: 'bottom', title: { display: true, text: 'team-rush-rate'.includes('team-lines') ? 'Play Number' : 'Team Play Number' }, min: 1, ticks: { stepSize: 1, callback: function(value) { return Math.floor(value); } }, grid: { display: false } }, y: { max: 1, min: 0, ticks: { callback: function(value) { return Math.round(value * 100) + '%'; } } } } : 'team-rush-rate'.includes('drive-metrics') ? { y: { stacked: false, max: 1, ticks: { callback: function(value) { return Math.round(value * 100) + '%'; } } }, y1: { display: false, type: 'linear', position: 'right' } } : ('team-rush-rate'.includes('top-rushers') || 'team-rush-rate'.includes('top-passers') || 'team-rush-rate'.includes('top-receivers')) ? { x: { stacked: true }, y: { stacked: true } } : { y: { max: 1, min: 0, stacked: false, ticks: { callback: function(value) { return Math.round(value * 100) + '%'; } } } } }; // Add indexAxis for player charts if ('team-rush-rate'.includes('top-rushers') || 'team-rush-rate'.includes('top-passers') || 'team-rush-rate'.includes('top-receivers')) { chartOptions.indexAxis = 'y'; } // Initialize the chart const ctx = canvas.getContext('2d'); const chart = new Chart(ctx, { type: 'line', data: chartData, options: chartOptions }); // Store reference to prevent re-initialization canvas.chartInstance = chart; console.log('CFB Chart initialized successfully'); } catch (error) { console.error('Error initializing CFB chart:', error); // Fallback: show error message in canvas container const container = document.getElementById('cfb-chart-1759110739564-o2rou6jh0').parentNode; if (container) { container.innerHTML = '
Chart failed to load. Please refresh the page.
'; } } } // Initialize when DOM is ready if (document.readyState === 'loading') { document.addEventListener('DOMContentLoaded', initChart); } else { initChart(); } // Also try initialization after a short delay for WordPress compatibility setTimeout(initChart, 500); })();
As a bit of a side note, Alabama showed something resembling balance in this game, at least by the end, by leaning increasingly on the rush in the second half.
Be it on me as a Gump to complain about running the dang ball, but you have to wonder if part of our, ahem, total lack of points in the second half could be related to leaning on the rush at a time when we hadn’t really shown (all year) that that was a way Alabama gets points. That said, running the ball burns the clock, and that’s ultimately how Alabama won this thing, so what do I know?
SR and XR by Down body { font-family: -apple-system, BlinkMacSystemFont, 'Segoe UI', 'Roboto', sans-serif; margin: 0; padding: 20px; background: #f8fafc; } .chart-container { background: white; border-radius: 12px; border: 1px solid #e5e5e5; box-shadow: 0 1px 3px rgba(0, 0, 0, 0.1); overflow: hidden; } .chart-header { padding: 18px 24px 16px; border-bottom: 1px solid #e5e5e5; background: white; } .chart-title { font-size: 18px; font-weight: 600; color: #171717; margin: 0; } .chart-content { padding: 20px 24px 24px !important; } @media (max-width: 640px) { .chart-content { padding: 12px 16px 20px !important; } .chart-header { padding: 12px 16px 12px !important; } .embed-footer-top { padding: 8px 12px !important; } .data-definitions { padding: 12px !important; } body { padding: 12px !important; } } .chart-content.top-receivers { height: 624px; } .chart-content.top-passers { height: 280px !important; } .chart-content.top-rushers { height: 372px; } .chart-content:not(.top-receivers):not(.top-passers):not(.top-rushers) { height: 372px; } .embed-footer { border-top: 1px solid #e5e5e5; font-size: 12px; color: #737373; } .embed-footer-top { display: flex; justify-content: space-between; align-items: center; padding: 12px 16px; } .embed-footer-link { color: #737373; text-decoration: none; font-weight: 500; } .embed-footer-link:hover { color: #525252; text-decoration: underline; } .data-definitions-toggle { background: none; border: none; color: #737373; font-size: 12px; font-weight: 500; cursor: pointer; display: flex; align-items: center; gap: 4px; padding: 0; } .data-definitions-toggle:hover { color: #525252; } .caret { transition: transform 0.2s ease; font-size: 10px; } .caret.expanded { transform: rotate(180deg); } .data-definitions { display: none; padding: 16px; background: #fafafa; border-top: 1px solid #e5e5e5; font-size: 12px; line-height: 1.4; } .data-definitions.expanded { display: block; } .data-definitions ul { margin: 0; padding-left: 0; list-style: none; } .data-definitions li { margin-bottom: 4px; }
// Toggle data definitions accordion - unique function per embed function toggleDefinitions_cfb_chart_1759110754393_s6sidqlf1() { const definitions = document.getElementById('dataDefinitions_cfb-chart-1759110754393-s6sidqlf1'); const caret = document.getElementById('caret_cfb-chart-1759110754393-s6sidqlf1'); if (definitions.classList.contains('expanded')) { definitions.classList.remove('expanded'); caret.classList.remove('expanded'); } else { definitions.classList.add('expanded'); caret.classList.add('expanded'); } } // WordPress-safe chart initialization with defensive checks (function() { 'use strict'; function initChart() { // Check if Chart.js is available if (typeof Chart === 'undefined') { console.warn('Chart.js not loaded yet, retrying...'); setTimeout(initChart, 100); return; } // Check if datalabels plugin is available if (typeof ChartDataLabels === 'undefined') { console.warn('ChartDataLabels plugin not loaded yet, retrying...'); setTimeout(initChart, 100); return; } // Check if canvas element exists const canvas = document.getElementById('cfb-chart-1759110754393-s6sidqlf1'); if (!canvas) { console.warn('Canvas element not found yet, retrying...'); setTimeout(initChart, 100); return; } // Prevent multiple chart instances if (canvas.chartInstance) { console.log('Chart already initialized'); return; } try { // Register the datalabels plugin Chart.register(ChartDataLabels); // Embed actual chart data directly const chartData = { "labels": [ "1st Down", "2nd Down", "3rd Down", "4th Down" ], "datasets": [ { "data": [ 0.09090909090909091, 0.125, 0.15789473684210525, 0 ], "stack": "Team", "label": "Alabama XR", "backgroundColor": "rgba(101, 0, 20, 0.8)", "datalabels": { "display": false } }, { "data": [ 0.36363636363636365, 0.25, 0.6842105263157895, 0 ], "stack": "Team", "label": "Alabama SR", "backgroundColor": "rgba(175, 40, 60, 0.8)", "datalabels": { "display": true } }, { "data": [ 0.07692307692307693, 0.23529411764705882, 0.25, 0 ], "stack": "Opponent", "label": "Georgia XR", "backgroundColor": "#991B1BCC", "datalabels": { "display": false } }, { "data": [ 0.46153846153846156, 0.5294117647058824, 0.25, 0 ], "stack": "Opponent", "label": "Georgia SR", "backgroundColor": "#DC2626CC", "datalabels": { "display": true } }, { "type": "line", "data": [ 0.42, 0.42, 0.42, 0.42 ], "label": "NCAA Avg SR", "borderColor": "#757575", "borderWidth": 2, "borderDash": [ 3, 3 ], "pointRadius": 0, "datalabels": { "display": false } }, { "type": "line", "data": [ null, null, null, null ], "label": "# Plays", "backgroundColor": "rgba(0, 0, 0, 0)", "borderColor": "rgba(0, 0, 0, 0)", "borderWidth": 0, "pointRadius": 0, "showLine": false, "fill": false, "datalabels": { "display": false } } ], "teamCounts": [ 33, 24, 19, 1 ], "oppCounts": [ 26, 17, 8, 1 ], "currentParams": { "year": 2025, "week": 5, "seasonType": "regular", "team": "Alabama", "gameId": "401752718" } }; // Chart options (WordPress-safe) const chartOptions = { responsive: true, maintainAspectRatio: false, animation: { duration: 0 // Disable animations to prevent conflicts }, elements: 'bar' === 'line' ? 'down-bars'.includes('play-map') ? { line: { tension: 0, borderWidth: 0 } } : { line: { tension: 0.25, borderWidth: 2.2 }, point: { pointRadius: 'down-bars'.includes('team-lines') ? 0 : undefined } } : {}, plugins: { datalabels: { display: function(context) { // Suppress data labels on line charts if ('bar' === 'line') { return false; } return context.dataset.datalabels && context.dataset.datalabels.display === true; }, formatter: function(value, context) { // Special handling for Overall Team Performance chart if ('down-bars' === 'overall-team-performance' && context.dataset.label === 'Success Rate (SR)') { // Use the stored play count data if (context.dataset.playCountData && context.dataset.playCountData[context.dataIndex]) { return context.dataset.playCountData[context.dataIndex]; } // Fallback to percentage if play count data not available return Math.round(value * 100) + '%'; } // Handle bar charts with count data (play-type, quarter, down, etc.) if (context.dataset.label && context.dataset.label.includes(' SR') && (chartData.teamCounts || chartData.oppCounts)) { // Find the first team SR dataset in the chart to determine team order const allDatasets = context.chart.data.datasets; const teamSRDataset = allDatasets.find(d => d.label && d.label.includes(' SR') && !d.label.includes('NCAA')); // If this is the first team's SR dataset, use teamCounts if (teamSRDataset && context.dataset.label === teamSRDataset.label && chartData.teamCounts) { return chartData.teamCounts[context.dataIndex] || 0; } // Otherwise, use oppCounts for the second team else if (chartData.oppCounts) { return chartData.oppCounts[context.dataIndex] || 0; } } // For player charts, show value only if > 0 (matches non-embedded behavior) if ('down-bars'.includes('top-rushers') || 'down-bars'.includes('top-passers') || 'down-bars'.includes('top-receivers')) { // Hide data labels for zero or negative values, show actual value for positive values return value > 0 ? value : null; } // For other charts, show values based on type if (typeof value === 'number') { // If value is between 0 and 1, treat as percentage if (value >= 0 && value 0 ? '#26262660' : 'transparent'; }, borderColor: function(context) { const value = context.dataset.data[context.dataIndex]; return value > 0 ? 'rgba(255, 255, 255, 0.2)' : 'transparent'; }, borderRadius: 4, align: 'center', anchor: 'center' }, legend: 'bar' === 'line' ? { position: 'top', align: 'start', labels: 'down-bars'.includes('play-map') ? { usePointStyle: true, generateLabels: function(chart) { // Call the original generateLabels to get default styling const original = Chart.defaults.plugins.legend.labels.generateLabels; const labels = original.call(this, chart); // Filter and customize each label const filteredLabels = labels.filter(label => { return !label.text.includes(' { const dataset = chart.data.datasets[label.datasetIndex]; if (dataset && dataset.label) { if (dataset.label.includes('Rush')) { label.pointStyle = 'circle'; label.pointStyleWidth = 4; label.fillStyle = 'white'; } else if (dataset.label.includes('Pass')) { label.pointStyle = 'triangle'; label.pointStyleWidth = 4; label.fillStyle = 'white'; } else { label.pointStyle = 'rect'; label.pointStyleWidth = 4; label.fillStyle = 'white'; } } }); return filteredLabels; }, boxWidth: 20, padding: 12 } : { usePointStyle: false, boxWidth: 12, boxHeight: 12, padding: 12, generateLabels: function(chart) { const original = Chart.defaults.plugins.legend.labels.generateLabels; const labels = original.call(this, chart); // Filter out reference areas and ensure white fill const filteredLabels = labels.filter(label => { return !label.text.includes('NCAA Avg SR') && !label.text.includes('50/50') && !label.text.includes('Quarters'); }); // Ensure white fill for all line chart legend boxes filteredLabels.forEach((label) => { label.fillStyle = 'white'; }); return filteredLabels; } } } : { position: 'top', align: 'start', labels: { usePointStyle: false, boxWidth: 12, boxHeight: 12, padding: 12, filter: function(legendItem, chartData) { return !legendItem.text.includes('NCAA Avg SR') && !legendItem.text.includes('Quarters') && !legendItem.text.includes('50/50'); }, generateLabels: function(chart) { const data = chart.data; if (data.datasets.length) { return data.datasets.map((dataset, i) => { // Handle backgroundColor arrays (like in Overall Team Performance chart) let fillColor = dataset.backgroundColor; if (dataset.label === '# Plays') { fillColor = 'white'; } else if (Array.isArray(dataset.backgroundColor)) { // For datasets with backgroundColor arrays, use the first color for legend fillColor = dataset.backgroundColor[0]; } return { text: dataset.label, fillStyle: fillColor, strokeStyle: dataset.label === '# Plays' ? '#666' : dataset.borderColor, lineWidth: dataset.label === '# Plays' ? 1 : dataset.borderWidth, hidden: !chart.isDatasetVisible(i), datasetIndex: i }; }).filter((item, index) => { // Apply the same filter logic as above const dataset = chart.data.datasets[index]; if (!dataset || !dataset.data) return false; if (dataset.label === '# Plays') return true; // Always show # Plays if (dataset.label && (dataset.label.includes('NCAA Avg SR') || dataset.label.includes('Quarters') || dataset.label.includes('50/50'))) return false; return dataset.data.some((value) => value > 0); }); } return []; } } }, tooltip: { filter: function(tooltipItem) { if ('down-bars'.includes('play-map')) { return !tooltipItem.dataset.label.includes('< 0') && !tooltipItem.dataset.label.includes('Quarters') && !tooltipItem.dataset.label.includes('Drive'); } return !tooltipItem.dataset.label.includes('NCAA Avg SR') && !tooltipItem.dataset.label.includes('50/50') && !tooltipItem.dataset.label.includes('< 0') && !tooltipItem.dataset.label.includes('Quarters'); }, callbacks: { label: function(context) { const label = context.dataset.label || ''; let labelText; // Play maps show yards instead of percentages if ('down-bars'.includes('play-map')) { labelText = label + ': ' + context.parsed.y + ' yards'; } else { const value = Math.round(context.parsed.y * 100); labelText = label + ': ' + value + '%'; } // For line charts, include play text if available if ('bar' === 'line' && context.raw && context.raw.text) { return [labelText, context.raw.text]; } return labelText; } } } }, scales: 'bar' === 'line' ? 'down-bars'.includes('play-map') ? { x: { type: 'linear', position: 'bottom', title: { display: true, text: 'Play Number' }, min: 1, ticks: { stepSize: 1, callback: function(value) { return Math.floor(value); } }, grid: { display: false } }, y: { title: { display: true, text: 'Yards Gained' }, min: chartData.minY, max: chartData.maxY } } : { x: { type: 'linear', position: 'bottom', title: { display: true, text: 'down-bars'.includes('team-lines') ? 'Play Number' : 'Team Play Number' }, min: 1, ticks: { stepSize: 1, callback: function(value) { return Math.floor(value); } }, grid: { display: false } }, y: { max: 1, min: 0, ticks: { callback: function(value) { return Math.round(value * 100) + '%'; } } } } : 'down-bars'.includes('drive-metrics') ? { y: { stacked: false, max: 1, ticks: { callback: function(value) { return Math.round(value * 100) + '%'; } } }, y1: { display: false, type: 'linear', position: 'right' } } : ('down-bars'.includes('top-rushers') || 'down-bars'.includes('top-passers') || 'down-bars'.includes('top-receivers')) ? { x: { stacked: true }, y: { stacked: true } } : { y: { max: 1, min: 0, stacked: false, ticks: { callback: function(value) { return Math.round(value * 100) + '%'; } } } } }; // Add indexAxis for player charts if ('down-bars'.includes('top-rushers') || 'down-bars'.includes('top-passers') || 'down-bars'.includes('top-receivers')) { chartOptions.indexAxis = 'y'; } // Initialize the chart const ctx = canvas.getContext('2d'); const chart = new Chart(ctx, { type: 'bar', data: chartData, options: chartOptions }); // Store reference to prevent re-initialization canvas.chartInstance = chart; console.log('CFB Chart initialized successfully'); } catch (error) { console.error('Error initializing CFB chart:', error); // Fallback: show error message in canvas container const container = document.getElementById('cfb-chart-1759110754393-s6sidqlf1').parentNode; if (container) { container.innerHTML = '
Chart failed to load. Please refresh the page.
'; } } } // Initialize when DOM is ready if (document.readyState === 'loading') { document.addEventListener('DOMContentLoaded', initChart); } else { initChart(); } // Also try initialization after a short delay for WordPress compatibility setTimeout(initChart, 500); })();
This Downs chart is pretty wacky, but it shouldn’t be a surprise to anyone who watched this game and even saw the basic stats start to accrue. Alabama suddenly became a 3rd-down juggernaut in a way that we didn’t even see during our 3rd-down miracle days with QB Bryce Young. But here we are.
Georgia was more efficient than Alabama on 1st downs and 2nd downs, but then completely wet the bed on 3rd downs—while Alabama posted a near 70% success rate on 3rd downs, which is pretty unheard of (at least in this town). Now, that is the kind of line that helps teach you how a team wins a game when they so often look to be on the receiving end of trouble (namely, Georgia’s large running backs).
“Explosiveness” was weird in this one
We’ve had a lot of chatter about explosiveness as a set of metrics and as a game-influencing concept here lately, and it’s because it affects games so profoundly. It’s also been kind of an “explosive” year, at least in Alabama games. In this one, we have some discrepancy with what different metrics see as valuable explosiveness out of each team.
Box Score – Alabama vs Georgia body { font-family: -apple-system, BlinkMacSystemFont, 'Segoe UI', 'Roboto', sans-serif; margin: 0; padding: 0; background: #f8fafc; } .embed-container { background: white; border-radius: 12px; border: 1px solid #e5e5e5; box-shadow: 0 1px 3px rgba(0, 0, 0, 0.1); overflow: hidden; max-width: 800px; margin: 0 auto; padding: 0; } .header { padding: 18px 24px 16px; border-bottom: 1px solid #e5e5e5; background: white; } .title { font-size: 18px; font-weight: 600; color: #171717; margin: 0; } .table-wrapper { padding: 0; } table { min-width: 100%; table-layout: fixed; border-collapse: collapse; } .col-stat { width: auto; } .col-team { width: 140px; } thead tr { background-color: #525252; color: white; } th { padding: 12px 16px; text-align: left; font-size: 14px; font-weight: 600; border-bottom: 4px solid #475569; text-align: center; } th.stat-header { text-align: left; } tbody tr { border-bottom: 1px solid #e5e5e5; } .bg-white { background-color: #ffffff; } .bg-neutral-50 { background-color: #fafafa; } .px-4 { padding-left: 1rem; padding-right: 1rem; } .py-3 { padding-top: 0.75rem; padding-bottom: 0.75rem; } .text-sm { font-size: 0.875rem; } .font-medium { font-weight: 500; } .font-semibold { font-weight: 600; } .text-neutral-900 { color: #171717; } .text-center { text-align: center; } .embed-footer { border-top: 1px solid #e5e5e5; font-size: 12px; color: #737373; } .embed-footer-top { display: flex; justify-content: center; align-items: center; padding: 12px 16px; } .embed-footer-link { color: #737373; text-decoration: none; font-weight: 500; } .embed-footer-link:hover { color: #525252; text-decoration: underline; } @media (max-width: 640px) { .header { padding: 12px 16px; } th, td { padding: 8px 12px; } .title { font-size: 16px; } .embed-footer-top { padding: 8px 12px; } .col-team { width: 80px; } th, td { font-size: 13px; } }
| Alabama |
Georgia |
| Points |
24 |
21 |
| Game Excitement |
6.3 |
6.3 |
| Total yards |
397 |
357 |
| Rush yards |
117 |
227 |
| Rush attempts |
38 |
33 |
| Yards per rush |
3.1 |
6.9 |
| Pass yards |
280 |
130 |
| Pass attempts |
25-39 |
13-20 |
| Yards per pass |
7.2 |
6.5 |
| 1st downs |
25 |
17 |
| 3rd down eff |
13-19 |
2-8 |
| 4th down eff |
0-1 |
0-1 |
| Explosiveness |
1.38 |
1.25 |
| Turnovers |
0 |
1 |
| Tackles |
35 |
46 |
| Sacks |
1 |
1 |
| Penalties-Yds |
4-16 |
6-68 |
| Possession |
35:36 |
24:24 |
If you pick the Explosiveness (index) number out of this, Alabama comes out on top (1.38 to Georgia’s 1.25). Apparently, whatever numbers feed this “quality-and-quantity” metric really favored the way that Alabama peppered in explosive plays, especially in the first half and over the course of this game. Alabama did post a modestly better yards per pass in this one, but we were woefully short of Georgia’s yards per rush number. No surprises there.
But in the first graphs that we just looked at for this game, Georgia did post a notably higher explosiveness rate than Alabama. As anyone with eyes watching this game saw, they had several huge plays that made this a close game. So what gives?
Play Map: Georgia body { font-family: -apple-system, BlinkMacSystemFont, 'Segoe UI', 'Roboto', sans-serif; margin: 0; padding: 20px; background: #f8fafc; } .chart-container { background: white; border-radius: 12px; border: 1px solid #e5e5e5; box-shadow: 0 1px 3px rgba(0, 0, 0, 0.1); overflow: hidden; } .chart-header { padding: 18px 24px 16px; border-bottom: 1px solid #e5e5e5; background: white; } .chart-title { font-size: 18px; font-weight: 600; color: #171717; margin: 0; } .chart-content { padding: 20px 24px 24px !important; } @media (max-width: 640px) { .chart-content { padding: 12px 16px 20px !important; } .chart-header { padding: 12px 16px 12px !important; } .embed-footer-top { padding: 8px 12px !important; } .data-definitions { padding: 12px !important; } body { padding: 12px !important; } } .chart-content.top-receivers { height: 624px; } .chart-content.top-passers { height: 280px !important; } .chart-content.top-rushers { height: 372px; } .chart-content:not(.top-receivers):not(.top-passers):not(.top-rushers) { height: 372px; } .embed-footer { border-top: 1px solid #e5e5e5; font-size: 12px; color: #737373; } .embed-footer-top { display: flex; justify-content: space-between; align-items: center; padding: 12px 16px; } .embed-footer-link { color: #737373; text-decoration: none; font-weight: 500; } .embed-footer-link:hover { color: #525252; text-decoration: underline; } .data-definitions-toggle { background: none; border: none; color: #737373; font-size: 12px; font-weight: 500; cursor: pointer; display: flex; align-items: center; gap: 4px; padding: 0; } .data-definitions-toggle:hover { color: #525252; } .caret { transition: transform 0.2s ease; font-size: 10px; } .caret.expanded { transform: rotate(180deg); } .data-definitions { display: none; padding: 16px; background: #fafafa; border-top: 1px solid #e5e5e5; font-size: 12px; line-height: 1.4; } .data-definitions.expanded { display: block; } .data-definitions ul { margin: 0; padding-left: 0; list-style: none; } .data-definitions li { margin-bottom: 4px; }
// Toggle data definitions accordion - unique function per embed function toggleDefinitions_cfb_chart_1759111654942_7vd1v5es5() { const definitions = document.getElementById('dataDefinitions_cfb-chart-1759111654942-7vd1v5es5'); const caret = document.getElementById('caret_cfb-chart-1759111654942-7vd1v5es5'); if (definitions.classList.contains('expanded')) { definitions.classList.remove('expanded'); caret.classList.remove('expanded'); } else { definitions.classList.add('expanded'); caret.classList.add('expanded'); } } // WordPress-safe chart initialization with defensive checks (function() { 'use strict'; function initChart() { // Check if Chart.js is available if (typeof Chart === 'undefined') { console.warn('Chart.js not loaded yet, retrying...'); setTimeout(initChart, 100); return; } // Check if datalabels plugin is available if (typeof ChartDataLabels === 'undefined') { console.warn('ChartDataLabels plugin not loaded yet, retrying...'); setTimeout(initChart, 100); return; } // Check if canvas element exists const canvas = document.getElementById('cfb-chart-1759111654942-7vd1v5es5'); if (!canvas) { console.warn('Canvas element not found yet, retrying...'); setTimeout(initChart, 100); return; } // Prevent multiple chart instances if (canvas.chartInstance) { console.log('Chart already initialized'); return; } try { // Register the datalabels plugin Chart.register(ChartDataLabels); // Embed actual chart data directly const chartData = { "datasets": [ { "label": " d.label && d.label.includes(' SR') && !d.label.includes('NCAA')); // If this is the first team's SR dataset, use teamCounts if (teamSRDataset && context.dataset.label === teamSRDataset.label && chartData.teamCounts) { return chartData.teamCounts[context.dataIndex] || 0; } // Otherwise, use oppCounts for the second team else if (chartData.oppCounts) { return chartData.oppCounts[context.dataIndex] || 0; } } // For player charts, show value only if > 0 (matches non-embedded behavior) if ('opponent-play-map'.includes('top-rushers') || 'opponent-play-map'.includes('top-passers') || 'opponent-play-map'.includes('top-receivers')) { // Hide data labels for zero or negative values, show actual value for positive values return value > 0 ? value : null; } // For other charts, show values based on type if (typeof value === 'number') { // If value is between 0 and 1, treat as percentage if (value >= 0 && value 0 ? '#26262660' : 'transparent'; }, borderColor: function(context) { const value = context.dataset.data[context.dataIndex]; return value > 0 ? 'rgba(255, 255, 255, 0.2)' : 'transparent'; }, borderRadius: 4, align: 'center', anchor: 'center' }, legend: 'line' === 'line' ? { position: 'top', align: 'start', labels: 'opponent-play-map'.includes('play-map') ? { usePointStyle: true, generateLabels: function(chart) { // Call the original generateLabels to get default styling const original = Chart.defaults.plugins.legend.labels.generateLabels; const labels = original.call(this, chart); // Filter and customize each label const filteredLabels = labels.filter(label => { return !label.text.includes(' { const dataset = chart.data.datasets[label.datasetIndex]; if (dataset && dataset.label) { if (dataset.label.includes('Rush')) { label.pointStyle = 'circle'; label.pointStyleWidth = 4; label.fillStyle = 'white'; } else if (dataset.label.includes('Pass')) { label.pointStyle = 'triangle'; label.pointStyleWidth = 4; label.fillStyle = 'white'; } else { label.pointStyle = 'rect'; label.pointStyleWidth = 4; label.fillStyle = 'white'; } } }); return filteredLabels; }, boxWidth: 20, padding: 12 } : { usePointStyle: false, boxWidth: 12, boxHeight: 12, padding: 12, generateLabels: function(chart) { const original = Chart.defaults.plugins.legend.labels.generateLabels; const labels = original.call(this, chart); // Filter out reference areas and ensure white fill const filteredLabels = labels.filter(label => { return !label.text.includes('NCAA Avg SR') && !label.text.includes('50/50') && !label.text.includes('Quarters'); }); // Ensure white fill for all line chart legend boxes filteredLabels.forEach((label) => { label.fillStyle = 'white'; }); return filteredLabels; } } } : { position: 'top', align: 'start', labels: { usePointStyle: false, boxWidth: 12, boxHeight: 12, padding: 12, filter: function(legendItem, chartData) { return !legendItem.text.includes('NCAA Avg SR') && !legendItem.text.includes('Quarters') && !legendItem.text.includes('50/50'); }, generateLabels: function(chart) { const data = chart.data; if (data.datasets.length) { return data.datasets.map((dataset, i) => { // Handle backgroundColor arrays (like in Overall Team Performance chart) let fillColor = dataset.backgroundColor; if (dataset.label === '# Plays') { fillColor = 'white'; } else if (Array.isArray(dataset.backgroundColor)) { // For datasets with backgroundColor arrays, use the first color for legend fillColor = dataset.backgroundColor[0]; } return { text: dataset.label, fillStyle: fillColor, strokeStyle: dataset.label === '# Plays' ? '#666' : dataset.borderColor, lineWidth: dataset.label === '# Plays' ? 1 : dataset.borderWidth, hidden: !chart.isDatasetVisible(i), datasetIndex: i }; }).filter((item, index) => { // Apply the same filter logic as above const dataset = chart.data.datasets[index]; if (!dataset || !dataset.data) return false; if (dataset.label === '# Plays') return true; // Always show # Plays if (dataset.label && (dataset.label.includes('NCAA Avg SR') || dataset.label.includes('Quarters') || dataset.label.includes('50/50'))) return false; return dataset.data.some((value) => value > 0); }); } return []; } } }, tooltip: { filter: function(tooltipItem) { if ('opponent-play-map'.includes('play-map')) { return !tooltipItem.dataset.label.includes('< 0') && !tooltipItem.dataset.label.includes('Quarters') && !tooltipItem.dataset.label.includes('Drive'); } return !tooltipItem.dataset.label.includes('NCAA Avg SR') && !tooltipItem.dataset.label.includes('50/50') && !tooltipItem.dataset.label.includes('< 0') && !tooltipItem.dataset.label.includes('Quarters'); }, callbacks: { label: function(context) { const label = context.dataset.label || ''; let labelText; // Play maps show yards instead of percentages if ('opponent-play-map'.includes('play-map')) { labelText = label + ': ' + context.parsed.y + ' yards'; } else { const value = Math.round(context.parsed.y * 100); labelText = label + ': ' + value + '%'; } // For line charts, include play text if available if ('line' === 'line' && context.raw && context.raw.text) { return [labelText, context.raw.text]; } return labelText; } } } }, scales: 'line' === 'line' ? 'opponent-play-map'.includes('play-map') ? { x: { type: 'linear', position: 'bottom', title: { display: true, text: 'Play Number' }, min: 1, ticks: { stepSize: 1, callback: function(value) { return Math.floor(value); } }, grid: { display: false } }, y: { title: { display: true, text: 'Yards Gained' }, min: chartData.minY, max: chartData.maxY } } : { x: { type: 'linear', position: 'bottom', title: { display: true, text: 'opponent-play-map'.includes('team-lines') ? 'Play Number' : 'Team Play Number' }, min: 1, ticks: { stepSize: 1, callback: function(value) { return Math.floor(value); } }, grid: { display: false } }, y: { max: 1, min: 0, ticks: { callback: function(value) { return Math.round(value * 100) + '%'; } } } } : 'opponent-play-map'.includes('drive-metrics') ? { y: { stacked: false, max: 1, ticks: { callback: function(value) { return Math.round(value * 100) + '%'; } } }, y1: { display: false, type: 'linear', position: 'right' } } : ('opponent-play-map'.includes('top-rushers') || 'opponent-play-map'.includes('top-passers') || 'opponent-play-map'.includes('top-receivers')) ? { x: { stacked: true }, y: { stacked: true } } : { y: { max: 1, min: 0, stacked: false, ticks: { callback: function(value) { return Math.round(value * 100) + '%'; } } } } }; // Add indexAxis for player charts if ('opponent-play-map'.includes('top-rushers') || 'opponent-play-map'.includes('top-passers') || 'opponent-play-map'.includes('top-receivers')) { chartOptions.indexAxis = 'y'; } // Initialize the chart const ctx = canvas.getContext('2d'); const chart = new Chart(ctx, { type: 'line', data: chartData, options: chartOptions }); // Store reference to prevent re-initialization canvas.chartInstance = chart; console.log('CFB Chart initialized successfully'); } catch (error) { console.error('Error initializing CFB chart:', error); // Fallback: show error message in canvas container const container = document.getElementById('cfb-chart-1759111654942-7vd1v5es5').parentNode; if (container) { container.innerHTML = '
Chart failed to load. Please refresh the page.
'; } } } // Initialize when DOM is ready if (document.readyState === 'loading') { document.addEventListener('DOMContentLoaded', initChart); } else { initChart(); } // Also try initialization after a short delay for WordPress compatibility setTimeout(initChart, 500); })();
Well, I don’t have the access I need to fully explain the Explosiveness index, but it could be something to do with how few plays Georgia actually ran. A good dose of these plays were explosive—you had five big rushes in here (including two real back-breakers), as well as three additional explosive passes. But really, there weren’t that many more successful passes for Georgia in the first place, and there weren’t really many plays for the UGA offense in general (53 plays to Alabama’s 77).
Honestly, you could probably look at both Georgia’s SR and XR and say, “Well, both of those rates are fine, but there just wasn’t a high enough denominator—there just weren’t that many plays run to derive explosiveness and success from.” Credit that to a few three-and-outs and stops that the defense got, especially early, and then to what turned out to be a critical turnover near the Dawg’s end zone.
This honestly reminded me of the Vandy game last year, where Alabama lost it, even with high efficiencies and such, after they just didn’t get enough opportunities. Here’s that:
Alabama Play Map, 2024 @ Vanderbilt
Play Map: Alabama body { font-family: -apple-system, BlinkMacSystemFont, 'Segoe UI', 'Roboto', sans-serif; margin: 0; padding: 20px; background: #f8fafc; } .chart-container { background: white; border-radius: 12px; border: 1px solid #e5e5e5; box-shadow: 0 1px 3px rgba(0, 0, 0, 0.1); overflow: hidden; } .chart-header { padding: 18px 24px 16px; border-bottom: 1px solid #e5e5e5; background: white; } .chart-title { font-size: 18px; font-weight: 600; color: #171717; margin: 0; } .chart-content { padding: 20px 24px 24px !important; } @media (max-width: 640px) { .chart-content { padding: 12px 16px 20px !important; } .chart-header { padding: 12px 16px 12px !important; } .embed-footer-top { padding: 8px 12px !important; } .data-definitions { padding: 12px !important; } body { padding: 12px !important; } } .chart-content.top-receivers { height: 624px; } .chart-content.top-passers { height: 280px !important; } .chart-content.top-rushers { height: 372px; } .chart-content:not(.top-receivers):not(.top-passers):not(.top-rushers) { height: 372px; } .embed-footer { border-top: 1px solid #e5e5e5; font-size: 12px; color: #737373; } .embed-footer-top { display: flex; justify-content: space-between; align-items: center; padding: 12px 16px; } .embed-footer-link { color: #737373; text-decoration: none; font-weight: 500; } .embed-footer-link:hover { color: #525252; text-decoration: underline; } .data-definitions-toggle { background: none; border: none; color: #737373; font-size: 12px; font-weight: 500; cursor: pointer; display: flex; align-items: center; gap: 4px; padding: 0; } .data-definitions-toggle:hover { color: #525252; } .caret { transition: transform 0.2s ease; font-size: 10px; } .caret.expanded { transform: rotate(180deg); } .data-definitions { display: none; padding: 16px; background: #fafafa; border-top: 1px solid #e5e5e5; font-size: 12px; line-height: 1.4; } .data-definitions.expanded { display: block; } .data-definitions ul { margin: 0; padding-left: 0; list-style: none; } .data-definitions li { margin-bottom: 4px; }
// Toggle data definitions accordion - unique function per embed function toggleDefinitions_cfb_chart_1759112511767_pd1skzz5u() { const definitions = document.getElementById('dataDefinitions_cfb-chart-1759112511767-pd1skzz5u'); const caret = document.getElementById('caret_cfb-chart-1759112511767-pd1skzz5u'); if (definitions.classList.contains('expanded')) { definitions.classList.remove('expanded'); caret.classList.remove('expanded'); } else { definitions.classList.add('expanded'); caret.classList.add('expanded'); } } // WordPress-safe chart initialization with defensive checks (function() { 'use strict'; function initChart() { // Check if Chart.js is available if (typeof Chart === 'undefined') { console.warn('Chart.js not loaded yet, retrying...'); setTimeout(initChart, 100); return; } // Check if datalabels plugin is available if (typeof ChartDataLabels === 'undefined') { console.warn('ChartDataLabels plugin not loaded yet, retrying...'); setTimeout(initChart, 100); return; } // Check if canvas element exists const canvas = document.getElementById('cfb-chart-1759112511767-pd1skzz5u'); if (!canvas) { console.warn('Canvas element not found yet, retrying...'); setTimeout(initChart, 100); return; } // Prevent multiple chart instances if (canvas.chartInstance) { console.log('Chart already initialized'); return; } try { // Register the datalabels plugin Chart.register(ChartDataLabels); // Embed actual chart data directly const chartData = { "datasets": [ { "label": " d.label && d.label.includes(' SR') && !d.label.includes('NCAA')); // If this is the first team's SR dataset, use teamCounts if (teamSRDataset && context.dataset.label === teamSRDataset.label && chartData.teamCounts) { return chartData.teamCounts[context.dataIndex] || 0; } // Otherwise, use oppCounts for the second team else if (chartData.oppCounts) { return chartData.oppCounts[context.dataIndex] || 0; } } // For player charts, show value only if > 0 (matches non-embedded behavior) if ('team-play-map'.includes('top-rushers') || 'team-play-map'.includes('top-passers') || 'team-play-map'.includes('top-receivers')) { // Hide data labels for zero or negative values, show actual value for positive values return value > 0 ? value : null; } // For other charts, show values based on type if (typeof value === 'number') { // If value is between 0 and 1, treat as percentage if (value >= 0 && value 0 ? '#26262660' : 'transparent'; }, borderColor: function(context) { const value = context.dataset.data[context.dataIndex]; return value > 0 ? 'rgba(255, 255, 255, 0.2)' : 'transparent'; }, borderRadius: 4, align: 'center', anchor: 'center' }, legend: 'line' === 'line' ? { position: 'top', align: 'start', labels: 'team-play-map'.includes('play-map') ? { usePointStyle: true, generateLabels: function(chart) { // Call the original generateLabels to get default styling const original = Chart.defaults.plugins.legend.labels.generateLabels; const labels = original.call(this, chart); // Filter and customize each label const filteredLabels = labels.filter(label => { return !label.text.includes(' { const dataset = chart.data.datasets[label.datasetIndex]; if (dataset && dataset.label) { if (dataset.label.includes('Rush')) { label.pointStyle = 'circle'; label.pointStyleWidth = 4; label.fillStyle = 'white'; } else if (dataset.label.includes('Pass')) { label.pointStyle = 'triangle'; label.pointStyleWidth = 4; label.fillStyle = 'white'; } else { label.pointStyle = 'rect'; label.pointStyleWidth = 4; label.fillStyle = 'white'; } } }); return filteredLabels; }, boxWidth: 20, padding: 12 } : { usePointStyle: false, boxWidth: 12, boxHeight: 12, padding: 12, generateLabels: function(chart) { const original = Chart.defaults.plugins.legend.labels.generateLabels; const labels = original.call(this, chart); // Filter out reference areas and ensure white fill const filteredLabels = labels.filter(label => { return !label.text.includes('NCAA Avg SR') && !label.text.includes('50/50') && !label.text.includes('Quarters'); }); // Ensure white fill for all line chart legend boxes filteredLabels.forEach((label) => { label.fillStyle = 'white'; }); return filteredLabels; } } } : { position: 'top', align: 'start', labels: { usePointStyle: false, boxWidth: 12, boxHeight: 12, padding: 12, filter: function(legendItem, chartData) { return !legendItem.text.includes('NCAA Avg SR') && !legendItem.text.includes('Quarters') && !legendItem.text.includes('50/50'); }, generateLabels: function(chart) { const data = chart.data; if (data.datasets.length) { return data.datasets.map((dataset, i) => { // Handle backgroundColor arrays (like in Overall Team Performance chart) let fillColor = dataset.backgroundColor; if (dataset.label === '# Plays') { fillColor = 'white'; } else if (Array.isArray(dataset.backgroundColor)) { // For datasets with backgroundColor arrays, use the first color for legend fillColor = dataset.backgroundColor[0]; } return { text: dataset.label, fillStyle: fillColor, strokeStyle: dataset.label === '# Plays' ? '#666' : dataset.borderColor, lineWidth: dataset.label === '# Plays' ? 1 : dataset.borderWidth, hidden: !chart.isDatasetVisible(i), datasetIndex: i }; }).filter((item, index) => { // Apply the same filter logic as above const dataset = chart.data.datasets[index]; if (!dataset || !dataset.data) return false; if (dataset.label === '# Plays') return true; // Always show # Plays if (dataset.label && (dataset.label.includes('NCAA Avg SR') || dataset.label.includes('Quarters') || dataset.label.includes('50/50'))) return false; return dataset.data.some((value) => value > 0); }); } return []; } } }, tooltip: { filter: function(tooltipItem) { if ('team-play-map'.includes('play-map')) { return !tooltipItem.dataset.label.includes('< 0') && !tooltipItem.dataset.label.includes('Quarters') && !tooltipItem.dataset.label.includes('Drive'); } return !tooltipItem.dataset.label.includes('NCAA Avg SR') && !tooltipItem.dataset.label.includes('50/50') && !tooltipItem.dataset.label.includes('< 0') && !tooltipItem.dataset.label.includes('Quarters'); }, callbacks: { label: function(context) { const label = context.dataset.label || ''; let labelText; // Play maps show yards instead of percentages if ('team-play-map'.includes('play-map')) { labelText = label + ': ' + context.parsed.y + ' yards'; } else { const value = Math.round(context.parsed.y * 100); labelText = label + ': ' + value + '%'; } // For line charts, include play text if available if ('line' === 'line' && context.raw && context.raw.text) { return [labelText, context.raw.text]; } return labelText; } } } }, scales: 'line' === 'line' ? 'team-play-map'.includes('play-map') ? { x: { type: 'linear', position: 'bottom', title: { display: true, text: 'Play Number' }, min: 1, ticks: { stepSize: 1, callback: function(value) { return Math.floor(value); } }, grid: { display: false } }, y: { title: { display: true, text: 'Yards Gained' }, min: chartData.minY, max: chartData.maxY } } : { x: { type: 'linear', position: 'bottom', title: { display: true, text: 'team-play-map'.includes('team-lines') ? 'Play Number' : 'Team Play Number' }, min: 1, ticks: { stepSize: 1, callback: function(value) { return Math.floor(value); } }, grid: { display: false } }, y: { max: 1, min: 0, ticks: { callback: function(value) { return Math.round(value * 100) + '%'; } } } } : 'team-play-map'.includes('drive-metrics') ? { y: { stacked: false, max: 1, ticks: { callback: function(value) { return Math.round(value * 100) + '%'; } } }, y1: { display: false, type: 'linear', position: 'right' } } : ('team-play-map'.includes('top-rushers') || 'team-play-map'.includes('top-passers') || 'team-play-map'.includes('top-receivers')) ? { x: { stacked: true }, y: { stacked: true } } : { y: { max: 1, min: 0, stacked: false, ticks: { callback: function(value) { return Math.round(value * 100) + '%'; } } } } }; // Add indexAxis for player charts if ('team-play-map'.includes('top-rushers') || 'team-play-map'.includes('top-passers') || 'team-play-map'.includes('top-receivers')) { chartOptions.indexAxis = 'y'; } // Initialize the chart const ctx = canvas.getContext('2d'); const chart = new Chart(ctx, { type: 'line', data: chartData, options: chartOptions }); // Store reference to prevent re-initialization canvas.chartInstance = chart; console.log('CFB Chart initialized successfully'); } catch (error) { console.error('Error initializing CFB chart:', error); // Fallback: show error message in canvas container const container = document.getElementById('cfb-chart-1759112511767-pd1skzz5u').parentNode; if (container) { container.innerHTML = '
Chart failed to load. Please refresh the page.
'; } } } // Initialize when DOM is ready if (document.readyState === 'loading') { document.addEventListener('DOMContentLoaded', initChart); } else { initChart(); } // Also try initialization after a short delay for WordPress compatibility setTimeout(initChart, 500); })();
Some other oddities and delicious sprinkles of joy
Here are some more fun ones from this game.
SR, XR, and Play Count by Drive: Alabama body { font-family: -apple-system, BlinkMacSystemFont, 'Segoe UI', 'Roboto', sans-serif; margin: 0; padding: 20px; background: #f8fafc; } .chart-container { background: white; border-radius: 12px; border: 1px solid #e5e5e5; box-shadow: 0 1px 3px rgba(0, 0, 0, 0.1); overflow: hidden; } .chart-header { padding: 18px 24px 16px; border-bottom: 1px solid #e5e5e5; background: white; } .chart-title { font-size: 18px; font-weight: 600; color: #171717; margin: 0; } .chart-content { padding: 20px 24px 24px !important; } @media (max-width: 640px) { .chart-content { padding: 12px 16px 20px !important; } .chart-header { padding: 12px 16px 12px !important; } .embed-footer-top { padding: 8px 12px !important; } .data-definitions { padding: 12px !important; } body { padding: 12px !important; } } .chart-content.top-receivers { height: 624px; } .chart-content.top-passers { height: 280px !important; } .chart-content.top-rushers { height: 372px; } .chart-content:not(.top-receivers):not(.top-passers):not(.top-rushers) { height: 372px; } .embed-footer { border-top: 1px solid #e5e5e5; font-size: 12px; color: #737373; } .embed-footer-top { display: flex; justify-content: space-between; align-items: center; padding: 12px 16px; } .embed-footer-link { color: #737373; text-decoration: none; font-weight: 500; } .embed-footer-link:hover { color: #525252; text-decoration: underline; } .data-definitions-toggle { background: none; border: none; color: #737373; font-size: 12px; font-weight: 500; cursor: pointer; display: flex; align-items: center; gap: 4px; padding: 0; } .data-definitions-toggle:hover { color: #525252; } .caret { transition: transform 0.2s ease; font-size: 10px; } .caret.expanded { transform: rotate(180deg); } .data-definitions { display: none; padding: 16px; background: #fafafa; border-top: 1px solid #e5e5e5; font-size: 12px; line-height: 1.4; } .data-definitions.expanded { display: block; } .data-definitions ul { margin: 0; padding-left: 0; list-style: none; } .data-definitions li { margin-bottom: 4px; }
// Toggle data definitions accordion - unique function per embed function toggleDefinitions_cfb_chart_1759111817524_buya80ia5() { const definitions = document.getElementById('dataDefinitions_cfb-chart-1759111817524-buya80ia5'); const caret = document.getElementById('caret_cfb-chart-1759111817524-buya80ia5'); if (definitions.classList.contains('expanded')) { definitions.classList.remove('expanded'); caret.classList.remove('expanded'); } else { definitions.classList.add('expanded'); caret.classList.add('expanded'); } } // WordPress-safe chart initialization with defensive checks (function() { 'use strict'; function initChart() { // Check if Chart.js is available if (typeof Chart === 'undefined') { console.warn('Chart.js not loaded yet, retrying...'); setTimeout(initChart, 100); return; } // Check if datalabels plugin is available if (typeof ChartDataLabels === 'undefined') { console.warn('ChartDataLabels plugin not loaded yet, retrying...'); setTimeout(initChart, 100); return; } // Check if canvas element exists const canvas = document.getElementById('cfb-chart-1759111817524-buya80ia5'); if (!canvas) { console.warn('Canvas element not found yet, retrying...'); setTimeout(initChart, 100); return; } // Prevent multiple chart instances if (canvas.chartInstance) { console.log('Chart already initialized'); return; } try { // Register the datalabels plugin Chart.register(ChartDataLabels); // Embed actual chart data directly const chartData = { "labels": [ "Drive 2", "Drive 4", "Drive 6", "Drive 8", "Drive 10", "Drive 12", "Drive 14", "Drive 16", "Drive 18", "Drive 20" ], "datasets": [ { "label": "Alabama XR", "data": [ 0.14285714285714285, 0.07142857142857142, 0.25, 0, 0.25, 0.1111111111111111, 0, 0, 0.1111111111111111, 0.125 ], "backgroundColor": "rgba(101, 0, 20, 0.8)", "stack": "SRXR", "yAxisID": "y", "datalabels": { "display": false } }, { "label": "Alabama SR", "data": [ 0.35714285714285715, 0.5, 0.25, 0, 0.75, 0.3333333333333333, 0.4, 0, 0.3333333333333333, 0.5 ], "backgroundColor": "rgba(175, 40, 60, 0.8)", "stack": "SRXR", "yAxisID": "y", "datalabels": { "display": false } }, { "label": "Plays in drive", "data": [ 14, 14, 4, 3, 8, 9, 5, 3, 9, 8 ], "backgroundColor": "rgba(148, 148, 148, 0.8)", "stack": "Plays", "yAxisID": "y1", "datalabels": { "display": true } } ], "currentParams": { "year": 2025, "week": 5, "seasonType": "regular", "team": "Alabama", "gameId": "401752718" } }; // Chart options (WordPress-safe) const chartOptions = { responsive: true, maintainAspectRatio: false, animation: { duration: 0 // Disable animations to prevent conflicts }, elements: 'bar' === 'line' ? 'team-drive-metrics'.includes('play-map') ? { line: { tension: 0, borderWidth: 0 } } : { line: { tension: 0.25, borderWidth: 2.2 }, point: { pointRadius: 'team-drive-metrics'.includes('team-lines') ? 0 : undefined } } : {}, plugins: { datalabels: { display: function(context) { // Suppress data labels on line charts if ('bar' === 'line') { return false; } return context.dataset.datalabels && context.dataset.datalabels.display === true; }, formatter: function(value, context) { // Special handling for Overall Team Performance chart if ('team-drive-metrics' === 'overall-team-performance' && context.dataset.label === 'Success Rate (SR)') { // Use the stored play count data if (context.dataset.playCountData && context.dataset.playCountData[context.dataIndex]) { return context.dataset.playCountData[context.dataIndex]; } // Fallback to percentage if play count data not available return Math.round(value * 100) + '%'; } // Handle bar charts with count data (play-type, quarter, down, etc.) if (context.dataset.label && context.dataset.label.includes(' SR') && (chartData.teamCounts || chartData.oppCounts)) { // Find the first team SR dataset in the chart to determine team order const allDatasets = context.chart.data.datasets; const teamSRDataset = allDatasets.find(d => d.label && d.label.includes(' SR') && !d.label.includes('NCAA')); // If this is the first team's SR dataset, use teamCounts if (teamSRDataset && context.dataset.label === teamSRDataset.label && chartData.teamCounts) { return chartData.teamCounts[context.dataIndex] || 0; } // Otherwise, use oppCounts for the second team else if (chartData.oppCounts) { return chartData.oppCounts[context.dataIndex] || 0; } } // For player charts, show value only if > 0 (matches non-embedded behavior) if ('team-drive-metrics'.includes('top-rushers') || 'team-drive-metrics'.includes('top-passers') || 'team-drive-metrics'.includes('top-receivers')) { // Hide data labels for zero or negative values, show actual value for positive values return value > 0 ? value : null; } // For other charts, show values based on type if (typeof value === 'number') { // If value is between 0 and 1, treat as percentage if (value >= 0 && value 0 ? '#26262660' : 'transparent'; }, borderColor: function(context) { const value = context.dataset.data[context.dataIndex]; return value > 0 ? 'rgba(255, 255, 255, 0.2)' : 'transparent'; }, borderRadius: 4, align: 'center', anchor: 'center' }, legend: 'bar' === 'line' ? { position: 'top', align: 'start', labels: 'team-drive-metrics'.includes('play-map') ? { usePointStyle: true, generateLabels: function(chart) { // Call the original generateLabels to get default styling const original = Chart.defaults.plugins.legend.labels.generateLabels; const labels = original.call(this, chart); // Filter and customize each label const filteredLabels = labels.filter(label => { return !label.text.includes(' { const dataset = chart.data.datasets[label.datasetIndex]; if (dataset && dataset.label) { if (dataset.label.includes('Rush')) { label.pointStyle = 'circle'; label.pointStyleWidth = 4; label.fillStyle = 'white'; } else if (dataset.label.includes('Pass')) { label.pointStyle = 'triangle'; label.pointStyleWidth = 4; label.fillStyle = 'white'; } else { label.pointStyle = 'rect'; label.pointStyleWidth = 4; label.fillStyle = 'white'; } } }); return filteredLabels; }, boxWidth: 20, padding: 12 } : { usePointStyle: false, boxWidth: 12, boxHeight: 12, padding: 12, generateLabels: function(chart) { const original = Chart.defaults.plugins.legend.labels.generateLabels; const labels = original.call(this, chart); // Filter out reference areas and ensure white fill const filteredLabels = labels.filter(label => { return !label.text.includes('NCAA Avg SR') && !label.text.includes('50/50') && !label.text.includes('Quarters'); }); // Ensure white fill for all line chart legend boxes filteredLabels.forEach((label) => { label.fillStyle = 'white'; }); return filteredLabels; } } } : { position: 'top', align: 'start', labels: { usePointStyle: false, boxWidth: 12, boxHeight: 12, padding: 12, filter: function(legendItem, chartData) { return !legendItem.text.includes('NCAA Avg SR') && !legendItem.text.includes('Quarters') && !legendItem.text.includes('50/50'); }, generateLabels: function(chart) { const data = chart.data; if (data.datasets.length) { return data.datasets.map((dataset, i) => { // Handle backgroundColor arrays (like in Overall Team Performance chart) let fillColor = dataset.backgroundColor; if (dataset.label === '# Plays') { fillColor = 'white'; } else if (Array.isArray(dataset.backgroundColor)) { // For datasets with backgroundColor arrays, use the first color for legend fillColor = dataset.backgroundColor[0]; } return { text: dataset.label, fillStyle: fillColor, strokeStyle: dataset.label === '# Plays' ? '#666' : dataset.borderColor, lineWidth: dataset.label === '# Plays' ? 1 : dataset.borderWidth, hidden: !chart.isDatasetVisible(i), datasetIndex: i }; }).filter((item, index) => { // Apply the same filter logic as above const dataset = chart.data.datasets[index]; if (!dataset || !dataset.data) return false; if (dataset.label === '# Plays') return true; // Always show # Plays if (dataset.label && (dataset.label.includes('NCAA Avg SR') || dataset.label.includes('Quarters') || dataset.label.includes('50/50'))) return false; return dataset.data.some((value) => value > 0); }); } return []; } } }, tooltip: { filter: function(tooltipItem) { if ('team-drive-metrics'.includes('play-map')) { return !tooltipItem.dataset.label.includes('< 0') && !tooltipItem.dataset.label.includes('Quarters') && !tooltipItem.dataset.label.includes('Drive'); } return !tooltipItem.dataset.label.includes('NCAA Avg SR') && !tooltipItem.dataset.label.includes('50/50') && !tooltipItem.dataset.label.includes('< 0') && !tooltipItem.dataset.label.includes('Quarters'); }, callbacks: { label: function(context) { const label = context.dataset.label || ''; let labelText; // Play maps show yards instead of percentages if ('team-drive-metrics'.includes('play-map')) { labelText = label + ': ' + context.parsed.y + ' yards'; } else { const value = Math.round(context.parsed.y * 100); labelText = label + ': ' + value + '%'; } // For line charts, include play text if available if ('bar' === 'line' && context.raw && context.raw.text) { return [labelText, context.raw.text]; } return labelText; } } } }, scales: 'bar' === 'line' ? 'team-drive-metrics'.includes('play-map') ? { x: { type: 'linear', position: 'bottom', title: { display: true, text: 'Play Number' }, min: 1, ticks: { stepSize: 1, callback: function(value) { return Math.floor(value); } }, grid: { display: false } }, y: { title: { display: true, text: 'Yards Gained' }, min: chartData.minY, max: chartData.maxY } } : { x: { type: 'linear', position: 'bottom', title: { display: true, text: 'team-drive-metrics'.includes('team-lines') ? 'Play Number' : 'Team Play Number' }, min: 1, ticks: { stepSize: 1, callback: function(value) { return Math.floor(value); } }, grid: { display: false } }, y: { max: 1, min: 0, ticks: { callback: function(value) { return Math.round(value * 100) + '%'; } } } } : 'team-drive-metrics'.includes('drive-metrics') ? { y: { stacked: false, max: 1, ticks: { callback: function(value) { return Math.round(value * 100) + '%'; } } }, y1: { display: false, type: 'linear', position: 'right' } } : ('team-drive-metrics'.includes('top-rushers') || 'team-drive-metrics'.includes('top-passers') || 'team-drive-metrics'.includes('top-receivers')) ? { x: { stacked: true }, y: { stacked: true } } : { y: { max: 1, min: 0, stacked: false, ticks: { callback: function(value) { return Math.round(value * 100) + '%'; } } } } }; // Add indexAxis for player charts if ('team-drive-metrics'.includes('top-rushers') || 'team-drive-metrics'.includes('top-passers') || 'team-drive-metrics'.includes('top-receivers')) { chartOptions.indexAxis = 'y'; } // Initialize the chart const ctx = canvas.getContext('2d'); const chart = new Chart(ctx, { type: 'bar', data: chartData, options: chartOptions }); // Store reference to prevent re-initialization canvas.chartInstance = chart; console.log('CFB Chart initialized successfully'); } catch (error) { console.error('Error initializing CFB chart:', error); // Fallback: show error message in canvas container const container = document.getElementById('cfb-chart-1759111817524-buya80ia5').parentNode; if (container) { container.innerHTML = '
Chart failed to load. Please refresh the page.
'; } } } // Initialize when DOM is ready if (document.readyState === 'loading') { document.addEventListener('DOMContentLoaded', initChart); } else { initChart(); } // Also try initialization after a short delay for WordPress compatibility setTimeout(initChart, 500); })();
Alabama has made an odd habit this year of suddenly putting together long drives—something that we’ve been complaining about for years round here, and across a few quarterbacks and OCs.
In this game, we put together another double-digit drive (a whopping 14 plays) to open it, and then, by god, we just went back and did it again with another 14-play drive. That is an absolutely bizarre anchor at the beginning of this game.
SR and XR by Red Zone body { font-family: -apple-system, BlinkMacSystemFont, 'Segoe UI', 'Roboto', sans-serif; margin: 0; padding: 20px; background: #f8fafc; } .chart-container { background: white; border-radius: 12px; border: 1px solid #e5e5e5; box-shadow: 0 1px 3px rgba(0, 0, 0, 0.1); overflow: hidden; } .chart-header { padding: 18px 24px 16px; border-bottom: 1px solid #e5e5e5; background: white; } .chart-title { font-size: 18px; font-weight: 600; color: #171717; margin: 0; } .chart-content { padding: 20px 24px 24px !important; } @media (max-width: 640px) { .chart-content { padding: 12px 16px 20px !important; } .chart-header { padding: 12px 16px 12px !important; } .embed-footer-top { padding: 8px 12px !important; } .data-definitions { padding: 12px !important; } body { padding: 12px !important; } } .chart-content.top-receivers { height: 624px; } .chart-content.top-passers { height: 280px !important; } .chart-content.top-rushers { height: 372px; } .chart-content:not(.top-receivers):not(.top-passers):not(.top-rushers) { height: 372px; } .embed-footer { border-top: 1px solid #e5e5e5; font-size: 12px; color: #737373; } .embed-footer-top { display: flex; justify-content: space-between; align-items: center; padding: 12px 16px; } .embed-footer-link { color: #737373; text-decoration: none; font-weight: 500; } .embed-footer-link:hover { color: #525252; text-decoration: underline; } .data-definitions-toggle { background: none; border: none; color: #737373; font-size: 12px; font-weight: 500; cursor: pointer; display: flex; align-items: center; gap: 4px; padding: 0; } .data-definitions-toggle:hover { color: #525252; } .caret { transition: transform 0.2s ease; font-size: 10px; } .caret.expanded { transform: rotate(180deg); } .data-definitions { display: none; padding: 16px; background: #fafafa; border-top: 1px solid #e5e5e5; font-size: 12px; line-height: 1.4; } .data-definitions.expanded { display: block; } .data-definitions ul { margin: 0; padding-left: 0; list-style: none; } .data-definitions li { margin-bottom: 4px; }
// Toggle data definitions accordion - unique function per embed function toggleDefinitions_cfb_chart_1759111941683_fjcitps09() { const definitions = document.getElementById('dataDefinitions_cfb-chart-1759111941683-fjcitps09'); const caret = document.getElementById('caret_cfb-chart-1759111941683-fjcitps09'); if (definitions.classList.contains('expanded')) { definitions.classList.remove('expanded'); caret.classList.remove('expanded'); } else { definitions.classList.add('expanded'); caret.classList.add('expanded'); } } // WordPress-safe chart initialization with defensive checks (function() { 'use strict'; function initChart() { // Check if Chart.js is available if (typeof Chart === 'undefined') { console.warn('Chart.js not loaded yet, retrying...'); setTimeout(initChart, 100); return; } // Check if datalabels plugin is available if (typeof ChartDataLabels === 'undefined') { console.warn('ChartDataLabels plugin not loaded yet, retrying...'); setTimeout(initChart, 100); return; } // Check if canvas element exists const canvas = document.getElementById('cfb-chart-1759111941683-fjcitps09'); if (!canvas) { console.warn('Canvas element not found yet, retrying...'); setTimeout(initChart, 100); return; } // Prevent multiple chart instances if (canvas.chartInstance) { console.log('Chart already initialized'); return; } try { // Register the datalabels plugin Chart.register(ChartDataLabels); // Embed actual chart data directly const chartData = { "labels": [ "Red Zone", "Other" ], "datasets": [ { "data": [ 0, 0.13846153846153847 ], "stack": "Team", "label": "Alabama XR", "backgroundColor": "rgba(101, 0, 20, 0.8)", "datalabels": { "display": false } }, { "data": [ 0.4166666666666667, 0.4 ], "stack": "Team", "label": "Alabama SR", "backgroundColor": "rgba(175, 40, 60, 0.8)", "datalabels": { "display": true } }, { "data": [ 0, 0.2 ], "stack": "Opponent", "label": "Georgia XR", "backgroundColor": "#991B1BCC", "datalabels": { "display": false } }, { "data": [ 0.5, 0.425 ], "stack": "Opponent", "label": "Georgia SR", "backgroundColor": "#DC2626CC", "datalabels": { "display": true } }, { "type": "line", "data": [ 0.42, 0.42 ], "label": "NCAA Avg SR", "borderColor": "#757575", "borderWidth": 2, "borderDash": [ 3, 3 ], "pointRadius": 0, "datalabels": { "display": false } }, { "type": "line", "data": [ null, null ], "label": "# Plays", "backgroundColor": "rgba(0, 0, 0, 0)", "borderColor": "rgba(0, 0, 0, 0)", "borderWidth": 0, "pointRadius": 0, "showLine": false, "fill": false, "datalabels": { "display": false } } ], "teamCounts": [ 12, 65 ], "oppCounts": [ 12, 40 ], "currentParams": { "year": 2025, "week": 5, "seasonType": "regular", "team": "Alabama", "gameId": "401752718" } }; // Chart options (WordPress-safe) const chartOptions = { responsive: true, maintainAspectRatio: false, animation: { duration: 0 // Disable animations to prevent conflicts }, elements: 'bar' === 'line' ? 'red-zone-bars'.includes('play-map') ? { line: { tension: 0, borderWidth: 0 } } : { line: { tension: 0.25, borderWidth: 2.2 }, point: { pointRadius: 'red-zone-bars'.includes('team-lines') ? 0 : undefined } } : {}, plugins: { datalabels: { display: function(context) { // Suppress data labels on line charts if ('bar' === 'line') { return false; } return context.dataset.datalabels && context.dataset.datalabels.display === true; }, formatter: function(value, context) { // Special handling for Overall Team Performance chart if ('red-zone-bars' === 'overall-team-performance' && context.dataset.label === 'Success Rate (SR)') { // Use the stored play count data if (context.dataset.playCountData && context.dataset.playCountData[context.dataIndex]) { return context.dataset.playCountData[context.dataIndex]; } // Fallback to percentage if play count data not available return Math.round(value * 100) + '%'; } // Handle bar charts with count data (play-type, quarter, down, etc.) if (context.dataset.label && context.dataset.label.includes(' SR') && (chartData.teamCounts || chartData.oppCounts)) { // Find the first team SR dataset in the chart to determine team order const allDatasets = context.chart.data.datasets; const teamSRDataset = allDatasets.find(d => d.label && d.label.includes(' SR') && !d.label.includes('NCAA')); // If this is the first team's SR dataset, use teamCounts if (teamSRDataset && context.dataset.label === teamSRDataset.label && chartData.teamCounts) { return chartData.teamCounts[context.dataIndex] || 0; } // Otherwise, use oppCounts for the second team else if (chartData.oppCounts) { return chartData.oppCounts[context.dataIndex] || 0; } } // For player charts, show value only if > 0 (matches non-embedded behavior) if ('red-zone-bars'.includes('top-rushers') || 'red-zone-bars'.includes('top-passers') || 'red-zone-bars'.includes('top-receivers')) { // Hide data labels for zero or negative values, show actual value for positive values return value > 0 ? value : null; } // For other charts, show values based on type if (typeof value === 'number') { // If value is between 0 and 1, treat as percentage if (value >= 0 && value 0 ? '#26262660' : 'transparent'; }, borderColor: function(context) { const value = context.dataset.data[context.dataIndex]; return value > 0 ? 'rgba(255, 255, 255, 0.2)' : 'transparent'; }, borderRadius: 4, align: 'center', anchor: 'center' }, legend: 'bar' === 'line' ? { position: 'top', align: 'start', labels: 'red-zone-bars'.includes('play-map') ? { usePointStyle: true, generateLabels: function(chart) { // Call the original generateLabels to get default styling const original = Chart.defaults.plugins.legend.labels.generateLabels; const labels = original.call(this, chart); // Filter and customize each label const filteredLabels = labels.filter(label => { return !label.text.includes(' { const dataset = chart.data.datasets[label.datasetIndex]; if (dataset && dataset.label) { if (dataset.label.includes('Rush')) { label.pointStyle = 'circle'; label.pointStyleWidth = 4; label.fillStyle = 'white'; } else if (dataset.label.includes('Pass')) { label.pointStyle = 'triangle'; label.pointStyleWidth = 4; label.fillStyle = 'white'; } else { label.pointStyle = 'rect'; label.pointStyleWidth = 4; label.fillStyle = 'white'; } } }); return filteredLabels; }, boxWidth: 20, padding: 12 } : { usePointStyle: false, boxWidth: 12, boxHeight: 12, padding: 12, generateLabels: function(chart) { const original = Chart.defaults.plugins.legend.labels.generateLabels; const labels = original.call(this, chart); // Filter out reference areas and ensure white fill const filteredLabels = labels.filter(label => { return !label.text.includes('NCAA Avg SR') && !label.text.includes('50/50') && !label.text.includes('Quarters'); }); // Ensure white fill for all line chart legend boxes filteredLabels.forEach((label) => { label.fillStyle = 'white'; }); return filteredLabels; } } } : { position: 'top', align: 'start', labels: { usePointStyle: false, boxWidth: 12, boxHeight: 12, padding: 12, filter: function(legendItem, chartData) { return !legendItem.text.includes('NCAA Avg SR') && !legendItem.text.includes('Quarters') && !legendItem.text.includes('50/50'); }, generateLabels: function(chart) { const data = chart.data; if (data.datasets.length) { return data.datasets.map((dataset, i) => { // Handle backgroundColor arrays (like in Overall Team Performance chart) let fillColor = dataset.backgroundColor; if (dataset.label === '# Plays') { fillColor = 'white'; } else if (Array.isArray(dataset.backgroundColor)) { // For datasets with backgroundColor arrays, use the first color for legend fillColor = dataset.backgroundColor[0]; } return { text: dataset.label, fillStyle: fillColor, strokeStyle: dataset.label === '# Plays' ? '#666' : dataset.borderColor, lineWidth: dataset.label === '# Plays' ? 1 : dataset.borderWidth, hidden: !chart.isDatasetVisible(i), datasetIndex: i }; }).filter((item, index) => { // Apply the same filter logic as above const dataset = chart.data.datasets[index]; if (!dataset || !dataset.data) return false; if (dataset.label === '# Plays') return true; // Always show # Plays if (dataset.label && (dataset.label.includes('NCAA Avg SR') || dataset.label.includes('Quarters') || dataset.label.includes('50/50'))) return false; return dataset.data.some((value) => value > 0); }); } return []; } } }, tooltip: { filter: function(tooltipItem) { if ('red-zone-bars'.includes('play-map')) { return !tooltipItem.dataset.label.includes('< 0') && !tooltipItem.dataset.label.includes('Quarters') && !tooltipItem.dataset.label.includes('Drive'); } return !tooltipItem.dataset.label.includes('NCAA Avg SR') && !tooltipItem.dataset.label.includes('50/50') && !tooltipItem.dataset.label.includes('< 0') && !tooltipItem.dataset.label.includes('Quarters'); }, callbacks: { label: function(context) { const label = context.dataset.label || ''; let labelText; // Play maps show yards instead of percentages if ('red-zone-bars'.includes('play-map')) { labelText = label + ': ' + context.parsed.y + ' yards'; } else { const value = Math.round(context.parsed.y * 100); labelText = label + ': ' + value + '%'; } // For line charts, include play text if available if ('bar' === 'line' && context.raw && context.raw.text) { return [labelText, context.raw.text]; } return labelText; } } } }, scales: 'bar' === 'line' ? 'red-zone-bars'.includes('play-map') ? { x: { type: 'linear', position: 'bottom', title: { display: true, text: 'Play Number' }, min: 1, ticks: { stepSize: 1, callback: function(value) { return Math.floor(value); } }, grid: { display: false } }, y: { title: { display: true, text: 'Yards Gained' }, min: chartData.minY, max: chartData.maxY } } : { x: { type: 'linear', position: 'bottom', title: { display: true, text: 'red-zone-bars'.includes('team-lines') ? 'Play Number' : 'Team Play Number' }, min: 1, ticks: { stepSize: 1, callback: function(value) { return Math.floor(value); } }, grid: { display: false } }, y: { max: 1, min: 0, ticks: { callback: function(value) { return Math.round(value * 100) + '%'; } } } } : 'red-zone-bars'.includes('drive-metrics') ? { y: { stacked: false, max: 1, ticks: { callback: function(value) { return Math.round(value * 100) + '%'; } } }, y1: { display: false, type: 'linear', position: 'right' } } : ('red-zone-bars'.includes('top-rushers') || 'red-zone-bars'.includes('top-passers') || 'red-zone-bars'.includes('top-receivers')) ? { x: { stacked: true }, y: { stacked: true } } : { y: { max: 1, min: 0, stacked: false, ticks: { callback: function(value) { return Math.round(value * 100) + '%'; } } } } }; // Add indexAxis for player charts if ('red-zone-bars'.includes('top-rushers') || 'red-zone-bars'.includes('top-passers') || 'red-zone-bars'.includes('top-receivers')) { chartOptions.indexAxis = 'y'; } // Initialize the chart const ctx = canvas.getContext('2d'); const chart = new Chart(ctx, { type: 'bar', data: chartData, options: chartOptions }); // Store reference to prevent re-initialization canvas.chartInstance = chart; console.log('CFB Chart initialized successfully'); } catch (error) { console.error('Error initializing CFB chart:', error); // Fallback: show error message in canvas container const container = document.getElementById('cfb-chart-1759111941683-fjcitps09').parentNode; if (container) { container.innerHTML = '
Chart failed to load. Please refresh the page.
'; } } } // Initialize when DOM is ready if (document.readyState === 'loading') { document.addEventListener('DOMContentLoaded', initChart); } else { initChart(); } // Also try initialization after a short delay for WordPress compatibility setTimeout(initChart, 500); })();
Well, maybe Alabama just won it because they did better in the red zones, right? Nope. Alabama was less efficient across all plays in this game, and was especially less efficient in the red zone.
As a caveat, I suppose with the fumble recovery in the red zone, some of this inefficiency is actually coming from that single drive where we ended up having to settle for a field goal. Those ended up being the deciding points of the game, but… maybe that turnover just sort of forgives this gap in efficiency for Alabama. I suppose without that drive, their red zone efficiency would have looked similar to the Dawgs, or maybe even slightly better here.
SR by Play Type: Alabama body { font-family: -apple-system, BlinkMacSystemFont, 'Segoe UI', 'Roboto', sans-serif; margin: 0; padding: 20px; background: #f8fafc; } .chart-container { background: white; border-radius: 12px; border: 1px solid #e5e5e5; box-shadow: 0 1px 3px rgba(0, 0, 0, 0.1); overflow: hidden; } .chart-header { padding: 18px 24px 16px; border-bottom: 1px solid #e5e5e5; background: white; } .chart-title { font-size: 18px; font-weight: 600; color: #171717; margin: 0; } .chart-content { padding: 20px 24px 24px !important; } @media (max-width: 640px) { .chart-content { padding: 12px 16px 20px !important; } .chart-header { padding: 12px 16px 12px !important; } .embed-footer-top { padding: 8px 12px !important; } .data-definitions { padding: 12px !important; } body { padding: 12px !important; } } .chart-content.top-receivers { height: 624px; } .chart-content.top-passers { height: 280px !important; } .chart-content.top-rushers { height: 372px; } .chart-content:not(.top-receivers):not(.top-passers):not(.top-rushers) { height: 372px; } .embed-footer { border-top: 1px solid #e5e5e5; font-size: 12px; color: #737373; } .embed-footer-top { display: flex; justify-content: space-between; align-items: center; padding: 12px 16px; } .embed-footer-link { color: #737373; text-decoration: none; font-weight: 500; } .embed-footer-link:hover { color: #525252; text-decoration: underline; } .data-definitions-toggle { background: none; border: none; color: #737373; font-size: 12px; font-weight: 500; cursor: pointer; display: flex; align-items: center; gap: 4px; padding: 0; } .data-definitions-toggle:hover { color: #525252; } .caret { transition: transform 0.2s ease; font-size: 10px; } .caret.expanded { transform: rotate(180deg); } .data-definitions { display: none; padding: 16px; background: #fafafa; border-top: 1px solid #e5e5e5; font-size: 12px; line-height: 1.4; } .data-definitions.expanded { display: block; } .data-definitions ul { margin: 0; padding-left: 0; list-style: none; } .data-definitions li { margin-bottom: 4px; }
// Toggle data definitions accordion - unique function per embed function toggleDefinitions_cfb_chart_1759112005056_q7tkidw7o() { const definitions = document.getElementById('dataDefinitions_cfb-chart-1759112005056-q7tkidw7o'); const caret = document.getElementById('caret_cfb-chart-1759112005056-q7tkidw7o'); if (definitions.classList.contains('expanded')) { definitions.classList.remove('expanded'); caret.classList.remove('expanded'); } else { definitions.classList.add('expanded'); caret.classList.add('expanded'); } } // WordPress-safe chart initialization with defensive checks (function() { 'use strict'; function initChart() { // Check if Chart.js is available if (typeof Chart === 'undefined') { console.warn('Chart.js not loaded yet, retrying...'); setTimeout(initChart, 100); return; } // Check if datalabels plugin is available if (typeof ChartDataLabels === 'undefined') { console.warn('ChartDataLabels plugin not loaded yet, retrying...'); setTimeout(initChart, 100); return; } // Check if canvas element exists const canvas = document.getElementById('cfb-chart-1759112005056-q7tkidw7o'); if (!canvas) { console.warn('Canvas element not found yet, retrying...'); setTimeout(initChart, 100); return; } // Prevent multiple chart instances if (canvas.chartInstance) { console.log('Chart already initialized'); return; } try { // Register the datalabels plugin Chart.register(ChartDataLabels); // Embed actual chart data directly const chartData = { "datasets": [ { "label": "NCAA Avg SR", "data": [ { "x": 1, "y": 0 }, { "x": 1, "y": 0.42 }, { "x": 77, "y": 0.42 }, { "x": 77, "y": 0 } ], "backgroundColor": "rgba(0,0,0,0.03)", "borderColor": "transparent", "pointRadius": 0, "fill": true, "tension": 0, "showLine": true, "datalabels": { "display": false } }, { "data": [ { "x": 1, "y": 0, "text": "Jam Miller run for 2 yds to the ALA 28" }, { "x": 2, "y": 0, "text": "Ty Simpson pass incomplete to Isaiah Horton" }, { "x": 3, "y": 0.5, "text": "Ty Simpson run for 10 yds to the ALA 38 for a 1ST down" }, { "x": 4, "y": 0.3333333333333333, "text": "Jam Miller run for no gain to the ALA 38" }, { "x": 5, "y": 0.3333333333333333, "text": "Ty Simpson pass incomplete to Ryan Williams" }, { "x": 6, "y": 0.3333333333333333, "text": "Ty Simpson pass complete to Isaiah Horton for 10 yds to the ALA 48 for a 1ST down" }, { "x": 7, "y": 0.3333333333333333, "text": "Ty Simpson pass incomplete to Isaiah Horton" }, { "x": 8, "y": 0.25, "text": "Kevin Riley run for 5 yds to the UGA 47" }, { "x": 9, "y": 0.25, "text": "Ty Simpson pass complete to Isaiah Horton for 24 yds to the UGA 23 for a 1ST down" }, { "x": 10, "y": 0.2, "text": "Jam Miller run for 2 yds to the UGA 26" }, { "x": 11, "y": 0.2, "text": "Ty Simpson pass complete to Germie Bernard for 18 yds to the UGA 8 for a 1ST down" }, { "x": 12, "y": 0.16666666666666666, "text": "Jam Miller run for 2 yds to the UGA 6" }, { "x": 13, "y": 0.16666666666666666, "text": "Ty Simpson pass incomplete to Isaiah Horton" }, { "x": 14, "y": 0.16666666666666666, "text": "Ty Simpson pass complete to Germie Bernard for 6 yds for a TD (Conor Talty KICK)" }, { "x": 15, "y": 0.14285714285714285, "text": "Jam Miller run for 3 yds to the ALA 20" }, { "x": 16, "y": 0.14285714285714285, "text": "Ty Simpson pass incomplete to Germie Bernard" }, { "x": 17, "y": 0.14285714285714285, "text": "Ty Simpson pass complete to Josh Cuevas for 12 yds to the ALA 32 for a 1ST down" }, { "x": 18, "y": 0.14285714285714285, "text": "Germie Bernard sacked by Chris Cole for a loss of 6 yards to the ALA 26" }, { "x": 19, "y": 0.14285714285714285, "text": "Ty Simpson pass complete to Kevin Riley for 10 yds to the ALA 36" }, { "x": 20, "y": 0.14285714285714285, "text": "Ty Simpson pass complete to Ryan Williams for 7 yds to the ALA 43 for a 1ST down" }, { "x": 21, "y": 0.14285714285714285, "text": "Ty Simpson pass complete to Germie Bernard for 5 yds to the ALA 48" }, { "x": 22, "y": 0.125, "text": "Jam Miller run for 3 yds to the UGA 49" }, { "x": 23, "y": 0.2222222222222222, "text": "Germie Bernard run for 11 yds to the UGA 38 for a 1ST down" }, { "x": 24, "y": 0.2222222222222222, "text": "Ty Simpson pass complete to Lotzeir Brooks for 19 yds to the UGA 19 for a 1ST down" }, { "x": 25, "y": 0.2, "text": "Kevin Riley run for 4 yds to the UGA 15" }, { "x": 26, "y": 0.18181818181818182, "text": "Jam Miller run for 2 yds to the UGA 13" }, { "x": 27, "y": 0.25, "text": "Jam Miller run for 7 yds to the UGA 6 for a 1ST down" }, { "x": 28, "y": 0.25, "text": "Ty Simpson pass complete to Isaiah Horton for 6 yds for a TD (Conor Talty KICK)" }, { "x": 29, "y": 0.25, "text": "Ty Simpson pass complete to Kevin Riley for 27 yds to the UGA 48 for a 1ST down" }, { "x": 30, "y": 0.25, "text": "Ty Simpson pass complete to Germie Bernard for 2 yds to the UGA 46" }, { "x": 31, "y": 0.23076923076923078, "text": "Kevin Riley run for 1 yd to the UGA 45" }, { "x": 32, "y": 0.23076923076923078, "text": "Ty Simpson pass incomplete to Rico Scott" }, { "x": 33, "y": 0.21428571428571427, "text": "Jam Miller run for 3 yds to the UGA 8" }, { "x": 34, "y": 0.2, "text": "Jam Miller run for 2 yds to the UGA 6" }, { "x": 35, "y": 0.2, "text": "Ty Simpson pass incomplete to Germie Bernard" }, { "x": 36, "y": 0.1875, "text": "Kevin Riley run for 2 yds to the ALA 27" }, { "x": 37, "y": 0.1875, "text": "Ty Simpson pass complete to Ryan Williams for 7 yds to the ALA 34" }, { "x": 38, "y": 0.1875, "text": "Germie Bernard pass complete to Isaiah Horton for 4 yds to the ALA 38 for a 1ST down" }, { "x": 39, "y": 0.1875, "text": "Ty Simpson pass complete to Ryan Williams for 18 yds to the UGA 44 for a 1ST down" }, { "x": 40, "y": 0.1875, "text": "Ty Simpson pass incomplete to Ryan Williams" }, { "x": 41, "y": 0.1875, "text": "Ty Simpson pass complete to Lotzeir Brooks for 21 yds to the UGA 23 for a 1ST down" }, { "x": 42, "y": 0.23529411764705882, "text": "Kadyn Proctor run for 11 yds to the UGA 2 for a 1ST down" }, { "x": 43, "y": 0.2777777777777778, "text": "Ty Simpson run for 2 yds for a TD (Conor Talty KICK)" }, { "x": 44, "y": 0.2777777777777778, "text": "Ty Simpson pass complete to Jam Miller for 14 yds to the ALA 39 for a 1ST down" }, { "x": 45, "y": 0.2631578947368421, "text": "Jam Miller run for 4 yds to the ALA 43" }, { "x": 46, "y": 0.3, "text": "Germie Bernard run for 8 yds to the UGA 49 for a 1ST down" }, { "x": 47, "y": 0.2857142857142857, "text": "Kevin Riley run for 4 yds to the UGA 45" }, { "x": 48, "y": 0.2727272727272727, "text": "Kevin Riley run for 3 yds to the UGA 42" }, { "x": 49, "y": 0.2727272727272727, "text": "Ty Simpson pass complete to Kaleb Edwards for 17 yds to the UGA 25 for a 1ST down" }, { "x": 50, "y": 0.2727272727272727, "text": "Ty Simpson pass complete to Jam Miller for a loss of 2 yards to the UGA 27" }, { "x": 51, "y": 0.2608695652173913, "text": "Germie Bernard run for 1 yd to the UGA 26" }, { "x": 52, "y": 0.2608695652173913, "text": "Ty Simpson pass incomplete to Josh Cuevas" }, { "x": 53, "y": 0.2608695652173913, "text": "Ty Simpson pass complete to Germie Bernard for 4 yds to the ALA 29" }, { "x": 54, "y": 0.2916666666666667, "text": "Kevin Riley run for 5 yds to the ALA 49" }, { "x": 55, "y": 0.32, "text": "Kevin Riley run for 4 yds to the UGA 47" }, { "x": 56, "y": 0.3076923076923077, "text": "Kevin Riley run for no gain to the UGA 47" }, { "x": 57, "y": 0.2962962962962963, "text": "Ty Simpson run for a loss of 2 yards to the UGA 49" }, { "x": 58, "y": 0.2962962962962963, "text": "Ty Simpson pass incomplete to Germie Bernard" }, { "x": 59, "y": 0.2962962962962963, "text": "Ty Simpson pass incomplete to Rico Scott" }, { "x": 60, "y": 0.2962962962962963, "text": "Ty Simpson pass incomplete to Ryan Williams" }, { "x": 61, "y": 0.2857142857142857, "text": "Kevin Riley run for 2 yds to the ALA 13" }, { "x": 62, "y": 0.2857142857142857, "text": "Ty Simpson pass incomplete to Germie Bernard" }, { "x": 63, "y": 0.2857142857142857, "text": "Ty Simpson pass complete to Ryan Williams for 9 yds to the ALA 22 for a 1ST down" }, { "x": 64, "y": 0.27586206896551724, "text": "Jam Miller run for 2 yds to the ALA 24" }, { "x": 65, "y": 0.27586206896551724, "text": "Ty Simpson pass complete to Isaiah Horton for 21 yds to the ALA 45 for a 1ST down" }, { "x": 66, "y": 0.27586206896551724, "text": "Ty Simpson pass complete to Josh Cuevas for 12 yds to the UGA 43 for a 1ST down" }, { "x": 67, "y": 0.27586206896551724, "text": "Ty Simpson pass complete to Ryan Williams for 2 yds to the UGA 46" }, { "x": 68, "y": 0.26666666666666666, "text": "Germie Bernard run for 6 yds to the UGA 40" }, { "x": 69, "y": 0.26666666666666666, "text": "Ty Simpson pass incomplete to Isaiah Horton" }, { "x": 70, "y": 0.2903225806451613, "text": "Jam Miller run for 7 yds to the ALA 19" }, { "x": 71, "y": 0.28125, "text": "Jam Miller run for 2 yds to the ALA 21" }, { "x": 72, "y": 0.30303030303030304, "text": "Ty Simpson run for 2 yds to the ALA 23 for a 1ST down Georgia Penalty, Personal Foul (Ellis Robinson IV) to the ALA 38 for a 1ST down" }, { "x": 73, "y": 0.3235294117647059, "text": "Jam Miller run for 6 yds to the ALA 44" }, { "x": 74, "y": 0.3142857142857143, "text": "Jam Miller run for a loss of 1 yard to the ALA 43" }, { "x": 75, "y": 0.3142857142857143, "text": "Ty Simpson pass complete to Jam Miller for 7 yds to the 50 yard line for a 1ST down" }, { "x": 76, "y": 0.3055555555555556, "text": "TEAM run for a loss of 1 yard to the ALA 49" }, { "x": 77, "y": 0.2972972972972973, "text": "TEAM run for a loss of 1 yard to the ALA 48" } ], "label": "Alabama Rush SR", "borderColor": "rgba(101, 0, 20, 0.8)", "backgroundColor": [ "rgba(255,255,255,0.9)", "rgba(255,255,255,0.9)", "rgba(175, 40, 60, 0.8)", "rgba(255,255,255,0.9)", "rgba(255,255,255,0.9)", "rgba(255,255,255,0.9)", "rgba(255,255,255,0.9)", "rgba(255,255,255,0.9)", "rgba(255,255,255,0.9)", "rgba(255,255,255,0.9)", "rgba(255,255,255,0.9)", "rgba(255,255,255,0.9)", "rgba(255,255,255,0.9)", "rgba(255,255,255,0.9)", "rgba(255,255,255,0.9)", "rgba(255,255,255,0.9)", "rgba(255,255,255,0.9)", "rgba(255,255,255,0.9)", "rgba(255,255,255,0.9)", "rgba(255,255,255,0.9)", "rgba(255,255,255,0.9)", "rgba(255,255,255,0.9)", "rgba(175, 40, 60, 0.8)", "rgba(255,255,255,0.9)", "rgba(255,255,255,0.9)", "rgba(255,255,255,0.9)", "rgba(175, 40, 60, 0.8)", "rgba(255,255,255,0.9)", "rgba(255,255,255,0.9)", "rgba(255,255,255,0.9)", "rgba(255,255,255,0.9)", "rgba(255,255,255,0.9)", "rgba(255,255,255,0.9)", "rgba(255,255,255,0.9)", "rgba(255,255,255,0.9)", "rgba(255,255,255,0.9)", "rgba(255,255,255,0.9)", "rgba(255,255,255,0.9)", "rgba(255,255,255,0.9)", "rgba(255,255,255,0.9)", "rgba(255,255,255,0.9)", "rgba(175, 40, 60, 0.8)", "rgba(175, 40, 60, 0.8)", "rgba(255,255,255,0.9)", "rgba(255,255,255,0.9)", "rgba(175, 40, 60, 0.8)", "rgba(255,255,255,0.9)", "rgba(255,255,255,0.9)", "rgba(255,255,255,0.9)", "rgba(255,255,255,0.9)", "rgba(255,255,255,0.9)", "rgba(255,255,255,0.9)", "rgba(255,255,255,0.9)", "rgba(175, 40, 60, 0.8)", "rgba(175, 40, 60, 0.8)", "rgba(255,255,255,0.9)", "rgba(255,255,255,0.9)", "rgba(255,255,255,0.9)", "rgba(255,255,255,0.9)", "rgba(255,255,255,0.9)", "rgba(255,255,255,0.9)", "rgba(255,255,255,0.9)", "rgba(255,255,255,0.9)", "rgba(255,255,255,0.9)", "rgba(255,255,255,0.9)", "rgba(255,255,255,0.9)", "rgba(255,255,255,0.9)", "rgba(255,255,255,0.9)", "rgba(255,255,255,0.9)", "rgba(175, 40, 60, 0.8)", "rgba(255,255,255,0.9)", "rgba(101, 0, 20, 0.8)", "rgba(175, 40, 60, 0.8)", "rgba(255,255,255,0.9)", "rgba(255,255,255,0.9)", "rgba(255,255,255,0.9)", "rgba(255,255,255,0.9)" ], "borderWidth": 2, "pointStyle": "circle", "pointRadius": [ 4, 0, 4, 4, 0, 0, 0, 4, 0, 4, 0, 4, 0, 0, 4, 0, 0, 0, 0, 0, 0, 4, 4, 0, 4, 4, 4, 0, 0, 0, 4, 0, 4, 4, 0, 4, 0, 0, 0, 0, 0, 4, 4, 0, 4, 4, 4, 4, 0, 0, 4, 0, 0, 4, 4, 4, 4, 0, 0, 0, 4, 0, 0, 4, 0, 0, 0, 4, 0, 4, 4, 4, 4, 4, 0, 4, 4 ], "pointBorderWidth": 1, "pointBorderColor": "rgba(101, 0, 20, 0.8)", "showLine": true }, { "data": [ { "x": 1, "y": 0, "text": "Jam Miller run for 2 yds to the ALA 28" }, { "x": 2, "y": 0, "text": "Ty Simpson pass incomplete to Isaiah Horton" }, { "x": 3, "y": 0, "text": "Ty Simpson run for 10 yds to the ALA 38 for a 1ST down" }, { "x": 4, "y": 0, "text": "Jam Miller run for no gain to the ALA 38" }, { "x": 5, "y": 0, "text": "Ty Simpson pass incomplete to Ryan Williams" }, { "x": 6, "y": 0.3333333333333333, "text": "Ty Simpson pass complete to Isaiah Horton for 10 yds to the ALA 48 for a 1ST down" }, { "x": 7, "y": 0.25, "text": "Ty Simpson pass incomplete to Isaiah Horton" }, { "x": 8, "y": 0.25, "text": "Kevin Riley run for 5 yds to the UGA 47" }, { "x": 9, "y": 0.4, "text": "Ty Simpson pass complete to Isaiah Horton for 24 yds to the UGA 23 for a 1ST down" }, { "x": 10, "y": 0.4, "text": "Jam Miller run for 2 yds to the UGA 26" }, { "x": 11, "y": 0.5, "text": "Ty Simpson pass complete to Germie Bernard for 18 yds to the UGA 8 for a 1ST down" }, { "x": 12, "y": 0.5, "text": "Jam Miller run for 2 yds to the UGA 6" }, { "x": 13, "y": 0.42857142857142855, "text": "Ty Simpson pass incomplete to Isaiah Horton" }, { "x": 14, "y": 0.5, "text": "Ty Simpson pass complete to Germie Bernard for 6 yds for a TD (Conor Talty KICK)" }, { "x": 15, "y": 0.5, "text": "Jam Miller run for 3 yds to the ALA 20" }, { "x": 16, "y": 0.4444444444444444, "text": "Ty Simpson pass incomplete to Germie Bernard" }, { "x": 17, "y": 0.5, "text": "Ty Simpson pass complete to Josh Cuevas for 12 yds to the ALA 32 for a 1ST down" }, { "x": 18, "y": 0.45454545454545453, "text": "Germie Bernard sacked by Chris Cole for a loss of 6 yards to the ALA 26" }, { "x": 19, "y": 0.4166666666666667, "text": "Ty Simpson pass complete to Kevin Riley for 10 yds to the ALA 36" }, { "x": 20, "y": 0.46153846153846156, "text": "Ty Simpson pass complete to Ryan Williams for 7 yds to the ALA 43 for a 1ST down" }, { "x": 21, "y": 0.5, "text": "Ty Simpson pass complete to Germie Bernard for 5 yds to the ALA 48" }, { "x": 22, "y": 0.5, "text": "Jam Miller run for 3 yds to the UGA 49" }, { "x": 23, "y": 0.5, "text": "Germie Bernard run for 11 yds to the UGA 38 for a 1ST down" }, { "x": 24, "y": 0.5333333333333333, "text": "Ty Simpson pass complete to Lotzeir Brooks for 19 yds to the UGA 19 for a 1ST down" }, { "x": 25, "y": 0.5333333333333333, "text": "Kevin Riley run for 4 yds to the UGA 15" }, { "x": 26, "y": 0.5333333333333333, "text": "Jam Miller run for 2 yds to the UGA 13" }, { "x": 27, "y": 0.5333333333333333, "text": "Jam Miller run for 7 yds to the UGA 6 for a 1ST down" }, { "x": 28, "y": 0.5625, "text": "Ty Simpson pass complete to Isaiah Horton for 6 yds for a TD (Conor Talty KICK)" }, { "x": 29, "y": 0.5882352941176471, "text": "Ty Simpson pass complete to Kevin Riley for 27 yds to the UGA 48 for a 1ST down" }, { "x": 30, "y": 0.5555555555555556, "text": "Ty Simpson pass complete to Germie Bernard for 2 yds to the UGA 46" }, { "x": 31, "y": 0.5555555555555556, "text": "Kevin Riley run for 1 yd to the UGA 45" }, { "x": 32, "y": 0.5263157894736842, "text": "Ty Simpson pass incomplete to Rico Scott" }, { "x": 33, "y": 0.5263157894736842, "text": "Jam Miller run for 3 yds to the UGA 8" }, { "x": 34, "y": 0.5263157894736842, "text": "Jam Miller run for 2 yds to the UGA 6" }, { "x": 35, "y": 0.5, "text": "Ty Simpson pass incomplete to Germie Bernard" }, { "x": 36, "y": 0.5, "text": "Kevin Riley run for 2 yds to the ALA 27" }, { "x": 37, "y": 0.5238095238095238, "text": "Ty Simpson pass complete to Ryan Williams for 7 yds to the ALA 34" }, { "x": 38, "y": 0.5454545454545454, "text": "Germie Bernard pass complete to Isaiah Horton for 4 yds to the ALA 38 for a 1ST down" }, { "x": 39, "y": 0.5652173913043478, "text": "Ty Simpson pass complete to Ryan Williams for 18 yds to the UGA 44 for a 1ST down" }, { "x": 40, "y": 0.5416666666666666, "text": "Ty Simpson pass incomplete to Ryan Williams" }, { "x": 41, "y": 0.56, "text": "Ty Simpson pass complete to Lotzeir Brooks for 21 yds to the UGA 23 for a 1ST down" }, { "x": 42, "y": 0.56, "text": "Kadyn Proctor run for 11 yds to the UGA 2 for a 1ST down" }, { "x": 43, "y": 0.56, "text": "Ty Simpson run for 2 yds for a TD (Conor Talty KICK)" }, { "x": 44, "y": 0.5769230769230769, "text": "Ty Simpson pass complete to Jam Miller for 14 yds to the ALA 39 for a 1ST down" }, { "x": 45, "y": 0.5769230769230769, "text": "Jam Miller run for 4 yds to the ALA 43" }, { "x": 46, "y": 0.5769230769230769, "text": "Germie Bernard run for 8 yds to the UGA 49 for a 1ST down" }, { "x": 47, "y": 0.5769230769230769, "text": "Kevin Riley run for 4 yds to the UGA 45" }, { "x": 48, "y": 0.5769230769230769, "text": "Kevin Riley run for 3 yds to the UGA 42" }, { "x": 49, "y": 0.5925925925925926, "text": "Ty Simpson pass complete to Kaleb Edwards for 17 yds to the UGA 25 for a 1ST down" }, { "x": 50, "y": 0.5714285714285714, "text": "Ty Simpson pass complete to Jam Miller for a loss of 2 yards to the UGA 27" }, { "x": 51, "y": 0.5714285714285714, "text": "Germie Bernard run for 1 yd to the UGA 26" }, { "x": 52, "y": 0.5517241379310345, "text": "Ty Simpson pass incomplete to Josh Cuevas" }, { "x": 53, "y": 0.5333333333333333, "text": "Ty Simpson pass complete to Germie Bernard for 4 yds to the ALA 29" }, { "x": 54, "y": 0.5333333333333333, "text": "Kevin Riley run for 5 yds to the ALA 49" }, { "x": 55, "y": 0.5333333333333333, "text": "Kevin Riley run for 4 yds to the UGA 47" }, { "x": 56, "y": 0.5333333333333333, "text": "Kevin Riley run for no gain to the UGA 47" }, { "x": 57, "y": 0.5333333333333333, "text": "Ty Simpson run for a loss of 2 yards to the UGA 49" }, { "x": 58, "y": 0.5161290322580645, "text": "Ty Simpson pass incomplete to Germie Bernard" }, { "x": 59, "y": 0.5, "text": "Ty Simpson pass incomplete to Rico Scott" }, { "x": 60, "y": 0.48484848484848486, "text": "Ty Simpson pass incomplete to Ryan Williams" }, { "x": 61, "y": 0.48484848484848486, "text": "Kevin Riley run for 2 yds to the ALA 13" }, { "x": 62, "y": 0.47058823529411764, "text": "Ty Simpson pass incomplete to Germie Bernard" }, { "x": 63, "y": 0.4857142857142857, "text": "Ty Simpson pass complete to Ryan Williams for 9 yds to the ALA 22 for a 1ST down" }, { "x": 64, "y": 0.4857142857142857, "text": "Jam Miller run for 2 yds to the ALA 24" }, { "x": 65, "y": 0.5, "text": "Ty Simpson pass complete to Isaiah Horton for 21 yds to the ALA 45 for a 1ST down" }, { "x": 66, "y": 0.5135135135135135, "text": "Ty Simpson pass complete to Josh Cuevas for 12 yds to the UGA 43 for a 1ST down" }, { "x": 67, "y": 0.5, "text": "Ty Simpson pass complete to Ryan Williams for 2 yds to the UGA 46" }, { "x": 68, "y": 0.5, "text": "Germie Bernard run for 6 yds to the UGA 40" }, { "x": 69, "y": 0.48717948717948717, "text": "Ty Simpson pass incomplete to Isaiah Horton" }, { "x": 70, "y": 0.48717948717948717, "text": "Jam Miller run for 7 yds to the ALA 19" }, { "x": 71, "y": 0.48717948717948717, "text": "Jam Miller run for 2 yds to the ALA 21" }, { "x": 72, "y": 0.48717948717948717, "text": "Ty Simpson run for 2 yds to the ALA 23 for a 1ST down Georgia Penalty, Personal Foul (Ellis Robinson IV) to the ALA 38 for a 1ST down" }, { "x": 73, "y": 0.48717948717948717, "text": "Jam Miller run for 6 yds to the ALA 44" }, { "x": 74, "y": 0.48717948717948717, "text": "Jam Miller run for a loss of 1 yard to the ALA 43" }, { "x": 75, "y": 0.5, "text": "Ty Simpson pass complete to Jam Miller for 7 yds to the 50 yard line for a 1ST down" }, { "x": 76, "y": 0.5, "text": "TEAM run for a loss of 1 yard to the ALA 49" }, { "x": 77, "y": 0.5, "text": "TEAM run for a loss of 1 yard to the ALA 48" } ], "label": "Alabama Pass SR", "borderColor": "rgba(101, 0, 20, 0.8)", "backgroundColor": [ "rgba(255,255,255,0.9)", "rgba(255,255,255,0.9)", "rgba(255,255,255,0.9)", "rgba(255,255,255,0.9)", "rgba(255,255,255,0.9)", "rgba(175, 40, 60, 0.8)", "rgba(255,255,255,0.9)", "rgba(255,255,255,0.9)", "rgba(101, 0, 20, 0.8)", "rgba(255,255,255,0.9)", "rgba(101, 0, 20, 0.8)", "rgba(255,255,255,0.9)", "rgba(255,255,255,0.9)", "rgba(175, 40, 60, 0.8)", "rgba(255,255,255,0.9)", "rgba(255,255,255,0.9)", "rgba(175, 40, 60, 0.8)", "rgba(255,255,255,0.9)", "rgba(255,255,255,0.9)", "rgba(175, 40, 60, 0.8)", "rgba(175, 40, 60, 0.8)", "rgba(255,255,255,0.9)", "rgba(255,255,255,0.9)", "rgba(101, 0, 20, 0.8)", "rgba(255,255,255,0.9)", "rgba(255,255,255,0.9)", "rgba(255,255,255,0.9)", "rgba(175, 40, 60, 0.8)", "rgba(101, 0, 20, 0.8)", "rgba(255,255,255,0.9)", "rgba(255,255,255,0.9)", "rgba(255,255,255,0.9)", "rgba(255,255,255,0.9)", "rgba(255,255,255,0.9)", "rgba(255,255,255,0.9)", "rgba(255,255,255,0.9)", "rgba(175, 40, 60, 0.8)", "rgba(175, 40, 60, 0.8)", "rgba(101, 0, 20, 0.8)", "rgba(255,255,255,0.9)", "rgba(101, 0, 20, 0.8)", "rgba(255,255,255,0.9)", "rgba(255,255,255,0.9)", "rgba(175, 40, 60, 0.8)", "rgba(255,255,255,0.9)", "rgba(255,255,255,0.9)", "rgba(255,255,255,0.9)", "rgba(255,255,255,0.9)", "rgba(101, 0, 20, 0.8)", "rgba(255,255,255,0.9)", "rgba(255,255,255,0.9)", "rgba(255,255,255,0.9)", "rgba(255,255,255,0.9)", "rgba(255,255,255,0.9)", "rgba(255,255,255,0.9)", "rgba(255,255,255,0.9)", "rgba(255,255,255,0.9)", "rgba(255,255,255,0.9)", "rgba(255,255,255,0.9)", "rgba(255,255,255,0.9)", "rgba(255,255,255,0.9)", "rgba(255,255,255,0.9)", "rgba(175, 40, 60, 0.8)", "rgba(255,255,255,0.9)", "rgba(101, 0, 20, 0.8)", "rgba(175, 40, 60, 0.8)", "rgba(255,255,255,0.9)", "rgba(255,255,255,0.9)", "rgba(255,255,255,0.9)", "rgba(255,255,255,0.9)", "rgba(255,255,255,0.9)", "rgba(255,255,255,0.9)", "rgba(255,255,255,0.9)", "rgba(255,255,255,0.9)", "rgba(175, 40, 60, 0.8)", "rgba(255,255,255,0.9)", "rgba(255,255,255,0.9)" ], "borderWidth": 2, "pointStyle": "triangle", "pointRadius": [ 0, 6, 0, 0, 6, 6, 6, 0, 6, 0, 6, 0, 6, 6, 0, 6, 6, 0, 6, 6, 6, 0, 0, 6, 0, 0, 0, 6, 6, 6, 0, 6, 0, 0, 6, 0, 6, 6, 6, 6, 6, 0, 0, 6, 0, 0, 0, 0, 6, 6, 0, 6, 6, 0, 0, 0, 0, 6, 6, 6, 0, 6, 6, 0, 6, 6, 6, 0, 6, 0, 0, 0, 0, 0, 6, 0, 0 ], "pointBorderWidth": 1, "pointBorderColor": "rgba(101, 0, 20, 0.8)", "borderDash": [ 4, 4 ], "showLine": true }, { "label": "Quarters", "data": [ { "x": 1, "y": 0 }, { "x": 1, "y": 1 }, { "x": 77, "y": 1 }, { "x": 77, "y": 0 }, { "x": 26, "y": 0 }, { "x": 26, "y": 1 }, { "x": 77, "y": 1 }, { "x": 77, "y": 0 }, { "x": 44, "y": 0 }, { "x": 44, "y": 1 }, { "x": 77, "y": 1 }, { "x": 77, "y": 0 }, { "x": 61, "y": 0 }, { "x": 61, "y": 1 }, { "x": 77, "y": 1 }, { "x": 77, "y": 0 } ], "borderColor": "rgba(0,0,0,0.1)", "borderWidth": 1, "tension": 0, "fill": false, "pointRadius": 0, "showLine": true, "datalabels": { "display": false } } ], "currentParams": { "year": 2025, "week": 5, "seasonType": "regular", "team": "Alabama", "gameId": "401752718" } }; // Chart options (WordPress-safe) const chartOptions = { responsive: true, maintainAspectRatio: false, animation: { duration: 0 // Disable animations to prevent conflicts }, elements: 'line' === 'line' ? 'team-play-type-lines'.includes('play-map') ? { line: { tension: 0, borderWidth: 0 } } : { line: { tension: 0.25, borderWidth: 2.2 }, point: { pointRadius: 'team-play-type-lines'.includes('team-lines') ? 0 : undefined } } : {}, plugins: { datalabels: { display: function(context) { // Suppress data labels on line charts if ('line' === 'line') { return false; } return context.dataset.datalabels && context.dataset.datalabels.display === true; }, formatter: function(value, context) { // Special handling for Overall Team Performance chart if ('team-play-type-lines' === 'overall-team-performance' && context.dataset.label === 'Success Rate (SR)') { // Use the stored play count data if (context.dataset.playCountData && context.dataset.playCountData[context.dataIndex]) { return context.dataset.playCountData[context.dataIndex]; } // Fallback to percentage if play count data not available return Math.round(value * 100) + '%'; } // Handle bar charts with count data (play-type, quarter, down, etc.) if (context.dataset.label && context.dataset.label.includes(' SR') && (chartData.teamCounts || chartData.oppCounts)) { // Find the first team SR dataset in the chart to determine team order const allDatasets = context.chart.data.datasets; const teamSRDataset = allDatasets.find(d => d.label && d.label.includes(' SR') && !d.label.includes('NCAA')); // If this is the first team's SR dataset, use teamCounts if (teamSRDataset && context.dataset.label === teamSRDataset.label && chartData.teamCounts) { return chartData.teamCounts[context.dataIndex] || 0; } // Otherwise, use oppCounts for the second team else if (chartData.oppCounts) { return chartData.oppCounts[context.dataIndex] || 0; } } // For player charts, show value only if > 0 (matches non-embedded behavior) if ('team-play-type-lines'.includes('top-rushers') || 'team-play-type-lines'.includes('top-passers') || 'team-play-type-lines'.includes('top-receivers')) { // Hide data labels for zero or negative values, show actual value for positive values return value > 0 ? value : null; } // For other charts, show values based on type if (typeof value === 'number') { // If value is between 0 and 1, treat as percentage if (value >= 0 && value 0 ? '#26262660' : 'transparent'; }, borderColor: function(context) { const value = context.dataset.data[context.dataIndex]; return value > 0 ? 'rgba(255, 255, 255, 0.2)' : 'transparent'; }, borderRadius: 4, align: 'center', anchor: 'center' }, legend: 'line' === 'line' ? { position: 'top', align: 'start', labels: 'team-play-type-lines'.includes('play-map') ? { usePointStyle: true, generateLabels: function(chart) { // Call the original generateLabels to get default styling const original = Chart.defaults.plugins.legend.labels.generateLabels; const labels = original.call(this, chart); // Filter and customize each label const filteredLabels = labels.filter(label => { return !label.text.includes(' { const dataset = chart.data.datasets[label.datasetIndex]; if (dataset && dataset.label) { if (dataset.label.includes('Rush')) { label.pointStyle = 'circle'; label.pointStyleWidth = 4; label.fillStyle = 'white'; } else if (dataset.label.includes('Pass')) { label.pointStyle = 'triangle'; label.pointStyleWidth = 4; label.fillStyle = 'white'; } else { label.pointStyle = 'rect'; label.pointStyleWidth = 4; label.fillStyle = 'white'; } } }); return filteredLabels; }, boxWidth: 20, padding: 12 } : { usePointStyle: false, boxWidth: 12, boxHeight: 12, padding: 12, generateLabels: function(chart) { const original = Chart.defaults.plugins.legend.labels.generateLabels; const labels = original.call(this, chart); // Filter out reference areas and ensure white fill const filteredLabels = labels.filter(label => { return !label.text.includes('NCAA Avg SR') && !label.text.includes('50/50') && !label.text.includes('Quarters'); }); // Ensure white fill for all line chart legend boxes filteredLabels.forEach((label) => { label.fillStyle = 'white'; }); return filteredLabels; } } } : { position: 'top', align: 'start', labels: { usePointStyle: false, boxWidth: 12, boxHeight: 12, padding: 12, filter: function(legendItem, chartData) { return !legendItem.text.includes('NCAA Avg SR') && !legendItem.text.includes('Quarters') && !legendItem.text.includes('50/50'); }, generateLabels: function(chart) { const data = chart.data; if (data.datasets.length) { return data.datasets.map((dataset, i) => { // Handle backgroundColor arrays (like in Overall Team Performance chart) let fillColor = dataset.backgroundColor; if (dataset.label === '# Plays') { fillColor = 'white'; } else if (Array.isArray(dataset.backgroundColor)) { // For datasets with backgroundColor arrays, use the first color for legend fillColor = dataset.backgroundColor[0]; } return { text: dataset.label, fillStyle: fillColor, strokeStyle: dataset.label === '# Plays' ? '#666' : dataset.borderColor, lineWidth: dataset.label === '# Plays' ? 1 : dataset.borderWidth, hidden: !chart.isDatasetVisible(i), datasetIndex: i }; }).filter((item, index) => { // Apply the same filter logic as above const dataset = chart.data.datasets[index]; if (!dataset || !dataset.data) return false; if (dataset.label === '# Plays') return true; // Always show # Plays if (dataset.label && (dataset.label.includes('NCAA Avg SR') || dataset.label.includes('Quarters') || dataset.label.includes('50/50'))) return false; return dataset.data.some((value) => value > 0); }); } return []; } } }, tooltip: { filter: function(tooltipItem) { if ('team-play-type-lines'.includes('play-map')) { return !tooltipItem.dataset.label.includes('< 0') && !tooltipItem.dataset.label.includes('Quarters') && !tooltipItem.dataset.label.includes('Drive'); } return !tooltipItem.dataset.label.includes('NCAA Avg SR') && !tooltipItem.dataset.label.includes('50/50') && !tooltipItem.dataset.label.includes('< 0') && !tooltipItem.dataset.label.includes('Quarters'); }, callbacks: { label: function(context) { const label = context.dataset.label || ''; let labelText; // Play maps show yards instead of percentages if ('team-play-type-lines'.includes('play-map')) { labelText = label + ': ' + context.parsed.y + ' yards'; } else { const value = Math.round(context.parsed.y * 100); labelText = label + ': ' + value + '%'; } // For line charts, include play text if available if ('line' === 'line' && context.raw && context.raw.text) { return [labelText, context.raw.text]; } return labelText; } } } }, scales: 'line' === 'line' ? 'team-play-type-lines'.includes('play-map') ? { x: { type: 'linear', position: 'bottom', title: { display: true, text: 'Play Number' }, min: 1, ticks: { stepSize: 1, callback: function(value) { return Math.floor(value); } }, grid: { display: false } }, y: { title: { display: true, text: 'Yards Gained' }, min: chartData.minY, max: chartData.maxY } } : { x: { type: 'linear', position: 'bottom', title: { display: true, text: 'team-play-type-lines'.includes('team-lines') ? 'Play Number' : 'Team Play Number' }, min: 1, ticks: { stepSize: 1, callback: function(value) { return Math.floor(value); } }, grid: { display: false } }, y: { max: 1, min: 0, ticks: { callback: function(value) { return Math.round(value * 100) + '%'; } } } } : 'team-play-type-lines'.includes('drive-metrics') ? { y: { stacked: false, max: 1, ticks: { callback: function(value) { return Math.round(value * 100) + '%'; } } }, y1: { display: false, type: 'linear', position: 'right' } } : ('team-play-type-lines'.includes('top-rushers') || 'team-play-type-lines'.includes('top-passers') || 'team-play-type-lines'.includes('top-receivers')) ? { x: { stacked: true }, y: { stacked: true } } : { y: { max: 1, min: 0, stacked: false, ticks: { callback: function(value) { return Math.round(value * 100) + '%'; } } } } }; // Add indexAxis for player charts if ('team-play-type-lines'.includes('top-rushers') || 'team-play-type-lines'.includes('top-passers') || 'team-play-type-lines'.includes('top-receivers')) { chartOptions.indexAxis = 'y'; } // Initialize the chart const ctx = canvas.getContext('2d'); const chart = new Chart(ctx, { type: 'line', data: chartData, options: chartOptions }); // Store reference to prevent re-initialization canvas.chartInstance = chart; console.log('CFB Chart initialized successfully'); } catch (error) { console.error('Error initializing CFB chart:', error); // Fallback: show error message in canvas container const container = document.getElementById('cfb-chart-1759112005056-q7tkidw7o').parentNode; if (container) { container.innerHTML = '
Chart failed to load. Please refresh the page.
'; } } } // Initialize when DOM is ready if (document.readyState === 'loading') { document.addEventListener('DOMContentLoaded', initChart); } else { initChart(); } // Also try initialization after a short delay for WordPress compatibility setTimeout(initChart, 500); })();
Alabama hired Washington’s old head coach, and now it’s old OC, and now Alabama is solidly a passing team. I mentioned earlier that Alabama actually showed a surprising amount of balance, at least relatively speaking, by the end of this game. But it was obvious to anyone watching that Ty Simpson’s arm was the key to success.
To the team’s credit, they did continue trying to run, even after these first two quarters (where we almost went into the half with a 20% rush success rate; except for that Kadyn Proctor big boy rush—yes, it counted as a lateral, so a rush—and Ty’s scamper into the end zone).
Fortunately (or maybe not), the Tide ran just enough and found just enough success in the 2nd half to burn out clock and end it. (I’ll also note that the Alabama efficiency did drop slightly in these last few plays when they were in victory formation. That happens whenever there’s victory formation, but you could certainly suggest that Alabama’s rushing success would have been above 30% here instead of slightly below it if you didn’t count those).
Top receivers body { font-family: -apple-system, BlinkMacSystemFont, 'Segoe UI', 'Roboto', sans-serif; margin: 0; padding: 20px; background: #f8fafc; } .chart-container { background: white; border-radius: 12px; border: 1px solid #e5e5e5; box-shadow: 0 1px 3px rgba(0, 0, 0, 0.1); overflow: hidden; } .chart-header { padding: 18px 24px 16px; border-bottom: 1px solid #e5e5e5; background: white; } .chart-title { font-size: 18px; font-weight: 600; color: #171717; margin: 0; } .chart-content { padding: 20px 24px 24px !important; } @media (max-width: 640px) { .chart-content { padding: 12px 16px 20px !important; } .chart-header { padding: 12px 16px 12px !important; } .embed-footer-top { padding: 8px 12px !important; } .data-definitions { padding: 12px !important; } body { padding: 12px !important; } } .chart-content.top-receivers { height: 624px; } .chart-content.top-passers { height: 280px !important; } .chart-content.top-rushers { height: 372px; } .chart-content:not(.top-receivers):not(.top-passers):not(.top-rushers) { height: 372px; } .embed-footer { border-top: 1px solid #e5e5e5; font-size: 12px; color: #737373; } .embed-footer-top { display: flex; justify-content: space-between; align-items: center; padding: 12px 16px; } .embed-footer-link { color: #737373; text-decoration: none; font-weight: 500; } .embed-footer-link:hover { color: #525252; text-decoration: underline; } .data-definitions-toggle { background: none; border: none; color: #737373; font-size: 12px; font-weight: 500; cursor: pointer; display: flex; align-items: center; gap: 4px; padding: 0; } .data-definitions-toggle:hover { color: #525252; } .caret { transition: transform 0.2s ease; font-size: 10px; } .caret.expanded { transform: rotate(180deg); } .data-definitions { display: none; padding: 16px; background: #fafafa; border-top: 1px solid #e5e5e5; font-size: 12px; line-height: 1.4; } .data-definitions.expanded { display: block; } .data-definitions ul { margin: 0; padding-left: 0; list-style: none; } .data-definitions li { margin-bottom: 4px; }
// Toggle data definitions accordion - unique function per embed function toggleDefinitions_cfb_chart_1759112134108_h2qi42bk6() { const definitions = document.getElementById('dataDefinitions_cfb-chart-1759112134108-h2qi42bk6'); const caret = document.getElementById('caret_cfb-chart-1759112134108-h2qi42bk6'); if (definitions.classList.contains('expanded')) { definitions.classList.remove('expanded'); caret.classList.remove('expanded'); } else { definitions.classList.add('expanded'); caret.classList.add('expanded'); } } // WordPress-safe chart initialization with defensive checks (function() { 'use strict'; function initChart() { // Check if Chart.js is available if (typeof Chart === 'undefined') { console.warn('Chart.js not loaded yet, retrying...'); setTimeout(initChart, 100); return; } // Check if datalabels plugin is available if (typeof ChartDataLabels === 'undefined') { console.warn('ChartDataLabels plugin not loaded yet, retrying...'); setTimeout(initChart, 100); return; } // Check if canvas element exists const canvas = document.getElementById('cfb-chart-1759112134108-h2qi42bk6'); if (!canvas) { console.warn('Canvas element not found yet, retrying...'); setTimeout(initChart, 100); return; } // Prevent multiple chart instances if (canvas.chartInstance) { console.log('Chart already initialized'); return; } try { // Register the datalabels plugin Chart.register(ChartDataLabels); // Embed actual chart data directly const chartData = { "labels": [ "Isaiah Horton", "Germie Bernard", "Ryan Williams", "Jam Miller", "Josh Cuevas", "Kevin Riley", "Lotzeir Brooks", "Kaleb Edwards", "Colbie Young", "Chauncey Bowe…", "Zachariah Bra…", "London Humphr…", "Sacovie White…" ], "datasets": [ { "label": "Explosive catches", "data": [ 2, 1, 1, 0, 0, 1, 2, 1, 2, 0, 1, 0, 0 ], "backgroundColor": [ "rgba(101, 0, 20, 0.8)", "rgba(101, 0, 20, 0.8)", "rgba(101, 0, 20, 0.8)", "rgba(101, 0, 20, 0.8)", "rgba(101, 0, 20, 0.8)", "rgba(101, 0, 20, 0.8)", "rgba(101, 0, 20, 0.8)", "rgba(101, 0, 20, 0.8)", "#991B1BCC", "#991B1BCC", "#991B1BCC", "#991B1BCC", "#991B1BCC" ], "borderColor": "#374151", "borderWidth": 1 }, { "label": "Successful catches", "data": [ 3, 2, 3, 2, 2, 0, 0, 0, 0, 2, 2, 1, 1 ], "backgroundColor": [ "rgba(175, 40, 60, 0.8)", "rgba(175, 40, 60, 0.8)", "rgba(175, 40, 60, 0.8)", "rgba(175, 40, 60, 0.8)", "rgba(175, 40, 60, 0.8)", "rgba(175, 40, 60, 0.8)", "rgba(175, 40, 60, 0.8)", "rgba(175, 40, 60, 0.8)", "#DC2626CC", "#DC2626CC", "#DC2626CC", "#DC2626CC", "#DC2626CC" ], "borderColor": "#374151", "borderWidth": 1 }, { "label": "Other catches", "data": [ 0, 2, 1, 1, 0, 1, 0, 0, 2, 2, 0, 0, 0 ], "backgroundColor": [ "rgba(245, 229, 233, 0.8)", "rgba(245, 229, 233, 0.8)", "rgba(245, 229, 233, 0.8)", "rgba(245, 229, 233, 0.8)", "rgba(245, 229, 233, 0.8)", "rgba(245, 229, 233, 0.8)", "rgba(245, 229, 233, 0.8)", "rgba(245, 229, 233, 0.8)", "#FEE2E2CC", "#FEE2E2CC", "#FEE2E2CC", "#FEE2E2CC", "#FEE2E2CC" ], "borderColor": "#374151", "borderWidth": 1 } ], "currentParams": { "year": 2025, "week": 5, "seasonType": "regular", "team": "Alabama", "gameId": "401752718" } }; // Chart options (WordPress-safe) const chartOptions = { responsive: true, maintainAspectRatio: false, animation: { duration: 0 // Disable animations to prevent conflicts }, elements: 'bar' === 'line' ? 'top-receivers'.includes('play-map') ? { line: { tension: 0, borderWidth: 0 } } : { line: { tension: 0.25, borderWidth: 2.2 }, point: { pointRadius: 'top-receivers'.includes('team-lines') ? 0 : undefined } } : {}, plugins: { datalabels: { display: function(context) { // Suppress data labels on line charts if ('bar' === 'line') { return false; } return context.dataset.datalabels && context.dataset.datalabels.display === true; }, formatter: function(value, context) { // Special handling for Overall Team Performance chart if ('top-receivers' === 'overall-team-performance' && context.dataset.label === 'Success Rate (SR)') { // Use the stored play count data if (context.dataset.playCountData && context.dataset.playCountData[context.dataIndex]) { return context.dataset.playCountData[context.dataIndex]; } // Fallback to percentage if play count data not available return Math.round(value * 100) + '%'; } // Handle bar charts with count data (play-type, quarter, down, etc.) if (context.dataset.label && context.dataset.label.includes(' SR') && (chartData.teamCounts || chartData.oppCounts)) { // Find the first team SR dataset in the chart to determine team order const allDatasets = context.chart.data.datasets; const teamSRDataset = allDatasets.find(d => d.label && d.label.includes(' SR') && !d.label.includes('NCAA')); // If this is the first team's SR dataset, use teamCounts if (teamSRDataset && context.dataset.label === teamSRDataset.label && chartData.teamCounts) { return chartData.teamCounts[context.dataIndex] || 0; } // Otherwise, use oppCounts for the second team else if (chartData.oppCounts) { return chartData.oppCounts[context.dataIndex] || 0; } } // For player charts, show value only if > 0 (matches non-embedded behavior) if ('top-receivers'.includes('top-rushers') || 'top-receivers'.includes('top-passers') || 'top-receivers'.includes('top-receivers')) { // Hide data labels for zero or negative values, show actual value for positive values return value > 0 ? value : null; } // For other charts, show values based on type if (typeof value === 'number') { // If value is between 0 and 1, treat as percentage if (value >= 0 && value 0 ? '#26262660' : 'transparent'; }, borderColor: function(context) { const value = context.dataset.data[context.dataIndex]; return value > 0 ? 'rgba(255, 255, 255, 0.2)' : 'transparent'; }, borderRadius: 4, align: 'center', anchor: 'center' }, legend: 'bar' === 'line' ? { position: 'top', align: 'start', labels: 'top-receivers'.includes('play-map') ? { usePointStyle: true, generateLabels: function(chart) { // Call the original generateLabels to get default styling const original = Chart.defaults.plugins.legend.labels.generateLabels; const labels = original.call(this, chart); // Filter and customize each label const filteredLabels = labels.filter(label => { return !label.text.includes(' { const dataset = chart.data.datasets[label.datasetIndex]; if (dataset && dataset.label) { if (dataset.label.includes('Rush')) { label.pointStyle = 'circle'; label.pointStyleWidth = 4; label.fillStyle = 'white'; } else if (dataset.label.includes('Pass')) { label.pointStyle = 'triangle'; label.pointStyleWidth = 4; label.fillStyle = 'white'; } else { label.pointStyle = 'rect'; label.pointStyleWidth = 4; label.fillStyle = 'white'; } } }); return filteredLabels; }, boxWidth: 20, padding: 12 } : { usePointStyle: false, boxWidth: 12, boxHeight: 12, padding: 12, generateLabels: function(chart) { const original = Chart.defaults.plugins.legend.labels.generateLabels; const labels = original.call(this, chart); // Filter out reference areas and ensure white fill const filteredLabels = labels.filter(label => { return !label.text.includes('NCAA Avg SR') && !label.text.includes('50/50') && !label.text.includes('Quarters'); }); // Ensure white fill for all line chart legend boxes filteredLabels.forEach((label) => { label.fillStyle = 'white'; }); return filteredLabels; } } } : { position: 'top', align: 'start', labels: { usePointStyle: false, boxWidth: 12, boxHeight: 12, padding: 12, filter: function(legendItem, chartData) { return !legendItem.text.includes('NCAA Avg SR') && !legendItem.text.includes('Quarters') && !legendItem.text.includes('50/50'); }, generateLabels: function(chart) { const data = chart.data; if (data.datasets.length) { return data.datasets.map((dataset, i) => { // Handle backgroundColor arrays (like in Overall Team Performance chart) let fillColor = dataset.backgroundColor; if (dataset.label === '# Plays') { fillColor = 'white'; } else if (Array.isArray(dataset.backgroundColor)) { // For datasets with backgroundColor arrays, use the first color for legend fillColor = dataset.backgroundColor[0]; } return { text: dataset.label, fillStyle: fillColor, strokeStyle: dataset.label === '# Plays' ? '#666' : dataset.borderColor, lineWidth: dataset.label === '# Plays' ? 1 : dataset.borderWidth, hidden: !chart.isDatasetVisible(i), datasetIndex: i }; }).filter((item, index) => { // Apply the same filter logic as above const dataset = chart.data.datasets[index]; if (!dataset || !dataset.data) return false; if (dataset.label === '# Plays') return true; // Always show # Plays if (dataset.label && (dataset.label.includes('NCAA Avg SR') || dataset.label.includes('Quarters') || dataset.label.includes('50/50'))) return false; return dataset.data.some((value) => value > 0); }); } return []; } } }, tooltip: { filter: function(tooltipItem) { if ('top-receivers'.includes('play-map')) { return !tooltipItem.dataset.label.includes('< 0') && !tooltipItem.dataset.label.includes('Quarters') && !tooltipItem.dataset.label.includes('Drive'); } return !tooltipItem.dataset.label.includes('NCAA Avg SR') && !tooltipItem.dataset.label.includes('50/50') && !tooltipItem.dataset.label.includes('< 0') && !tooltipItem.dataset.label.includes('Quarters'); }, callbacks: { label: function(context) { const label = context.dataset.label || ''; let labelText; // Play maps show yards instead of percentages if ('top-receivers'.includes('play-map')) { labelText = label + ': ' + context.parsed.y + ' yards'; } else { const value = Math.round(context.parsed.y * 100); labelText = label + ': ' + value + '%'; } // For line charts, include play text if available if ('bar' === 'line' && context.raw && context.raw.text) { return [labelText, context.raw.text]; } return labelText; } } } }, scales: 'bar' === 'line' ? 'top-receivers'.includes('play-map') ? { x: { type: 'linear', position: 'bottom', title: { display: true, text: 'Play Number' }, min: 1, ticks: { stepSize: 1, callback: function(value) { return Math.floor(value); } }, grid: { display: false } }, y: { title: { display: true, text: 'Yards Gained' }, min: chartData.minY, max: chartData.maxY } } : { x: { type: 'linear', position: 'bottom', title: { display: true, text: 'top-receivers'.includes('team-lines') ? 'Play Number' : 'Team Play Number' }, min: 1, ticks: { stepSize: 1, callback: function(value) { return Math.floor(value); } }, grid: { display: false } }, y: { max: 1, min: 0, ticks: { callback: function(value) { return Math.round(value * 100) + '%'; } } } } : 'top-receivers'.includes('drive-metrics') ? { y: { stacked: false, max: 1, ticks: { callback: function(value) { return Math.round(value * 100) + '%'; } } }, y1: { display: false, type: 'linear', position: 'right' } } : ('top-receivers'.includes('top-rushers') || 'top-receivers'.includes('top-passers') || 'top-receivers'.includes('top-receivers')) ? { x: { stacked: true }, y: { stacked: true } } : { y: { max: 1, min: 0, stacked: false, ticks: { callback: function(value) { return Math.round(value * 100) + '%'; } } } } }; // Add indexAxis for player charts if ('top-receivers'.includes('top-rushers') || 'top-receivers'.includes('top-passers') || 'top-receivers'.includes('top-receivers')) { chartOptions.indexAxis = 'y'; } // Initialize the chart const ctx = canvas.getContext('2d'); const chart = new Chart(ctx, { type: 'bar', data: chartData, options: chartOptions }); // Store reference to prevent re-initialization canvas.chartInstance = chart; console.log('CFB Chart initialized successfully'); } catch (error) { console.error('Error initializing CFB chart:', error); // Fallback: show error message in canvas container const container = document.getElementById('cfb-chart-1759112134108-h2qi42bk6').parentNode; if (container) { container.innerHTML = '
Chart failed to load. Please refresh the page.
'; } } } // Initialize when DOM is ready if (document.readyState === 'loading') { document.addEventListener('DOMContentLoaded', initChart); } else { initChart(); } // Also try initialization after a short delay for WordPress compatibility setTimeout(initChart, 500); })();
And I suppose there’s something to be said for receiver depth, but it shows up because it shows up in big ways in this chart. For one, I thought I would be singing the praises of one of our more headline-y receivers, but instead, transfer Isaiah Horton had himself a low-key day here. His two explosives and three successful catches made him the leading receiver as far as successful plays are concerned. (Yes he also didn’t catch an early one, and no we get receiver targets in this data).
This Alabama line for receivers is also much longer than what Georgia showed. The Dawgs passed to five receivers, which suggests a tight rotation (and is more how we would expect to see Alabama play a few years ago). But Alabama spread this thing out, likely in part to creative playcalling.
On this list, you see four receivers including freshman Lottie Brooks; you see two running backs with five catches across them; and then you see two tight ends, including freshman Kaleb Edwards, with three targets total. That is good ball distribution, and that’s both a compliment to the quarterback and the offensive coordinator in making this all (just barely) work.
We’re back? Or just back around
This team has been a whirlwind, even after the departure of our resident “human whirlwind,” Jalen Milroe. I didn’t expect for us to continue to be so prone to oddities, but this season has surprised me. Hopefully, what we’re seeing now is actually a trend and a set of tendencies that will rinse and repeat, rather than the “scatter plot effort” that we saw towards the end of last season and the beginning of this season. But who knows?
Hopefully, I’ll be showing a set of much less bizarre charts (um, in the direction you’re thinking, not the other direction) after the Vanderbilt game; the Universe must heal, must begin to right itself. (Right? Please?).
So whether we’re “coming back around again” or “we’re back,” I will see you next week. Feel free to check out the rest of this game’s charts here; and visit that site to see the graphs for any game since 2014!