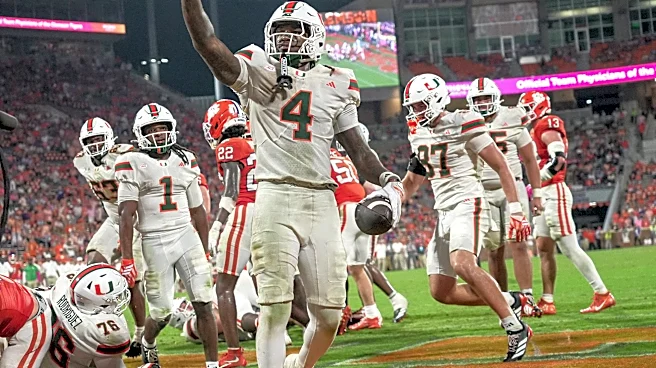







Clemson didn’t lose this game because Miami was simply too talented to compete with. The Tigers lost because they were unable to consistently execute the things required to stay in the game. There were stretches where Clemson moved the ball, pressured the quarterback and looked capable of making Miami work for it. But those moments were overwhelmed by fundamental problems — costly penalties at the absolute wrong time, an ineffective run game, inconsistent protection, missed opportunities in scoring
territory and too little disruption when Miami had the ball. The result was a game that was competitive in spots but increasingly one-sided as it wore on. For all the progress Clemson has shown this season (if any at all), this was a reminder that there is still a considerable gap between being functional and being capable of beating a team of Miami’s caliber.
Clemson Offense — PFF 64.6
EPA/play: -0.17 (16th percentile)
Success rate: 37% (21st percentile)
Total offense: 350 yards
Yards/play: 4.72 (21st percentile)
First downs: 22
Third down: 8-18 (44%)
Red zone: 2-3
Turnovers: 2
Penalties: 10-91
Key Takeaways
- Volume without efficiency: Clemson ran 75 plays and produced 22 first downs, but averaged just 4.72 yards per play and -0.17 EPA/play.
- Situational execution fell short: While the Tigers moved the chains and converted a modest 44% on third down, they failed to generate many red-zone chances (2-of-3) and only one of those ended in a touchdowns. This TD arguably occurred in garbage time.
- Flashes of efficiency: Clemson posted a +0.15 EPA/play during the middle eight, but finished at -0.17 overall as the offense couldn’t sustain any long-term consistency.
- Self-inflicted mistakes compounded issues: Two turnovers directly yielded 10 Miami points, while 10 penalties for 91 yards repeatedly stalled momentum.
Clemson Pass Offense — PFF 57.1
Pass EPA/play: -0.01 (40th percentile)
Passing yards: 295
Yards/pass: 5.90 (43rd percentile)
Pass success rate: 44%
Explosive pass plays: 4 (8%)
Completions: 29
Attempts: 44
Interceptions: 1
Sacks: 6-35 yards
Key Takeaways
- Efficiency boosted by garbage time output: The 295 passing yards were aided by 86 late fourth-quarter yards (30% of total) while yielding 5.90 yards per dropback and -0.01 EPA/play.
- Protection was highly volatile: Miami registered six sacks, putting Reynolds under frequent stress despite three linemen grading above 85 in pass protection.
- Explosive plays lacked scoring payoff: All four of Clemson’s explosive plays came through the air (matching Miami’s total), but while Miami converted theirs into 14 points, Clemson’s yielded primarily field position.
- Overburdened by run game ineffectiveness: Lacking ground support, Clemson was forced to throw on 65% of early downs and 70% on late downs, forcing the passing game into predictable, high-leverage situations.
Clemson Rush Offense — PFF 61.3
Rush EPA/play: -0.49 (1st percentile)
Rushing yards: 55
Yards/rush: 1.8
Rush success rate: 24%
Opportunity runs: 9 of 25 (36%)
Stopped runs: 12 of 25 (48%)
Stuffed runs: 4 (16%)
OL line yards: 59.9
Line yards/carry: 2.40
Highlight yards: 29.5
Key Takeaways
- Lost the line of scrimmage: Clemson produced just 2.40 line yards per carry compared to Miami’s 3.48, failing to push the defensive front or establish any baseline foundation.
- Complete lack of efficiency or explosion: The ground game produced a 24% success rate overall (21% on early downs), generated zero explosive runs, and registered -0.49 EPA per rush (1st percentile).
- Late yards masked total stagnation: The offense managed just 13 net rushing yards through three quarters before picking up 42 yards in the fourth quarter.
Clemson Defense — PFF 66.5
EPA/play allowed: +0.21
Success rate allowed: 51%
Total yards allowed: 419
Yards/play allowed: 6.76
First downs allowed: 25
Third down: 4-11 (36%)
Red zone: 3-3
Havoc: 13%
Turnovers forced: 0
Key Takeaways
- Lack of overall down-to-down control: Miami scored 41 points by operating at a 51% success rate and +0.21 EPA/play; Clemson simply couldn’t create enough splash plays to slow them down.
- The defense struggled to get off the field consistently. Miami sustained a 51% overall success rate and averaged 6.76 yards per play, allowing the Hurricanes to control possessions despite Clemson generating some pressure and coverage disruption.
- Zero takeaways proved costly: While Miami scored 10 points off two Clemson takeaways, the Tigers forced zero turnovers, leaving no margin for error against an efficient offense.
Clemson Pass Defense — PFF 60.4
Pass EPA/play allowed: +0.22
Passing yards allowed: 227
Yards/pass allowed: 7.83
Pass success rate allowed: 48%
Passing havoc: 8 (28%)
Sacks: 2
Pass breakups: 6
Interceptions: 0
Key Takeaways
- Disruption was present, but unrewarded: Clemson generated 8 passing havoc plays (28%), 2 sacks and 6 PBUs, but failed to turn that disruption into a takeaway.
- Miami maximized low volume: The Hurricanes needed only 27 pass attempts to generate 227 yards, averaging 7.83 yards per dropback and a 48% pass success rate.
- Clemson couldn’t force Miami into obvious passing situations: Miami remained efficient on early downs and could stay balanced, preventing Clemson from consistently pinning the Hurricanes in predictable passing situations.
Clemson Rush Defense — PFF 66.3
Rushing EPA/play allowed: +0.19
Rushing yards allowed: 192
Yards/rush allowed: 5.5
Rush success rate allowed: 55%
Opportunity runs allowed: 21 (64%)
Stuffed runs: 2 (6%)
Stopped runs: 7 (21%)
Rushing havoc: 0%
Key Takeaways
- Pounded on normal downs: Miami’s +0.19 EPA per rush came through sustained, down-to-down efficiency rather than isolated big plays, gaining at least 4 yards on 64% of carries.
- Inability to penetrate or reset the line: Clemson created zero rushing havoc and managed only 2 stuffed runs (6%), allowing Miami to consistently stay ahead of the chains.
- Allowed Miami to close out the game: By averaging 5.5 yards per carry with a 55% success rate, Miami controlled the game script late, bleeding the clock out without ever needing to rely on its passing game.