
Man, I wish I never had to talk about this again. But, y’know, I do, apparently. Also, it makes easy fodder for a daily question post.
If you haven’t, you should peruse this page: https://baseballsavant.mlb.com/drag-dashboard. There’s not a lot there. I’ll replicate the top chart here:

Each dot is an average of the day’s readings of drag, i.e., averaged across all games. The blue line is a rolling average. The higher the blue line, the draggier the ball, that is, the less far fly balls travel, on average. You
can see two things: drag tends to change over the course of the season, likely as different balls are introduced (it’s not weather because the pattern isn’t the same), and that there’s been a correction (deliberate or not) from 2020-2025 relative to 2017-2019.
Based on this, 2025 was the highest-drag season for which we have data. (Though, to be clear: the original juiced ball was introduced in mid-2015, so if we had the same charts for 2014 and earlier, they’d probably have dots and lines much higher than anything seen here.) Drag has also increased year-over-year from 2023-onward, with a particularly big jump from 2024 to 2025. If you go to the link above, there’s a second chart that gives you annual average drag, along with the distribution. The jump from 2024 to 2025 was the highest in a single season since the correction began in 2021 vis-a-vis 2020.
Now, we don’t know what 2026 holds in store. But through a few days, as seen on that page, drag in 2026 is (marginally) higher than in 2025.
Again, I wish there was only player-related and team-related stuff to talk about. That’s what baseball should be about. But this has a problematic way of inserting itself into the context of the games played. Why bring this up now? You know why: yesterday the Braves lost while massively outperforming the Royals.
- Braves: .404 xwOBA, but a .243 wOBA
- Royals: .255 xwOBA, .274 wOBA
Winning with a sub-.300 wOBA and xwOBA is rare, but it’s even rarer when your opponent has a really good day in terms of striking the ball. The Braves’ .161-point gap is the sixth-largest for the team in the Statcast era, and only the second where they had a substantial underperformance with a .400+ xwOBA. (Some of these numbers may change if and when xwOBA is recalibrated for 2026, but the gist will likely stay the same unless the ball ends up really dramatically different.)
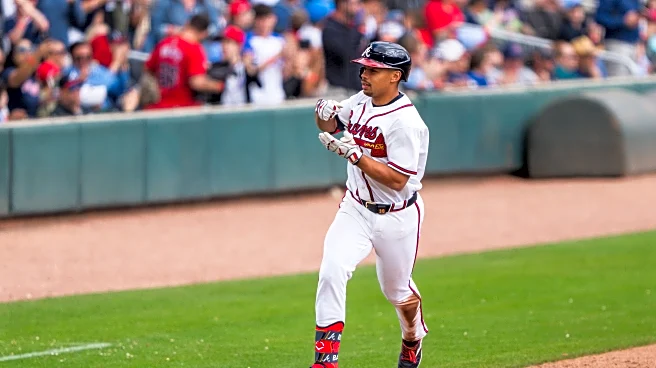
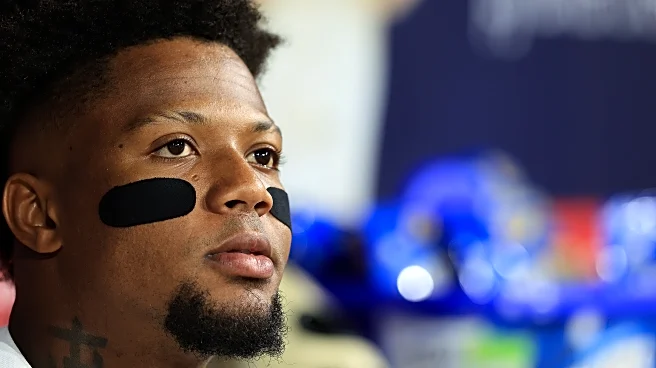
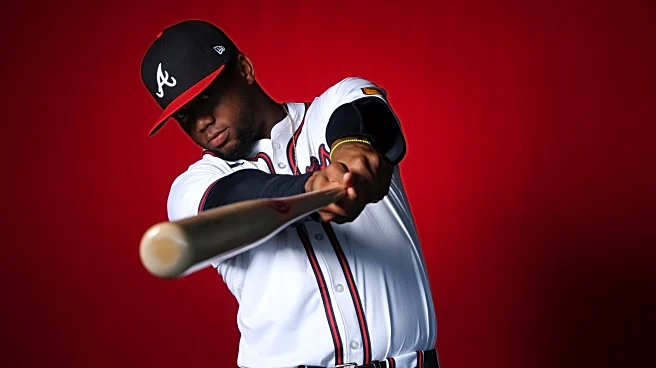
The ball Ronald Acuña Jr. hit was a homer 83 percent of the time last year; it traveled eight feet less than the average ball hit with the same velocity and launch angle last year, which was already a high-drag year. The one Michael Harris II hit was even more comical: it was a homer 97 percent of the time last year, and it lost 22 feet relative to the average ball with the same specs in 2025. Was there wind blowing in-ish to center and cross-wise that mattered here? Sure was. But we might be seeing another high in drag. Who knows, but we’ll see.
As a coda, I do want to point out that though yesterday’s game was absurd, the Royals actually out-xwOBAed the Braves in both of the prior two games. The first game was pretty close (.322 Royals, .319 Braves), but the second game was not (.321 Royals, .281 Braves). The first game was greatly aided by the Braves’ defense, and the second game was basically the opposite of this one, albeit with the Royals not actually crushing the ball.
Basically:

Anyway, stay tuned for… well, you know.