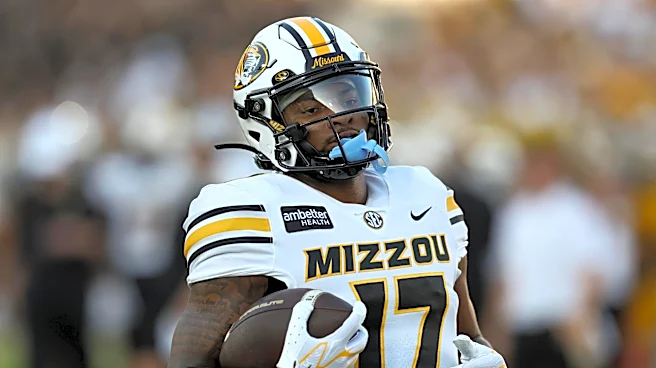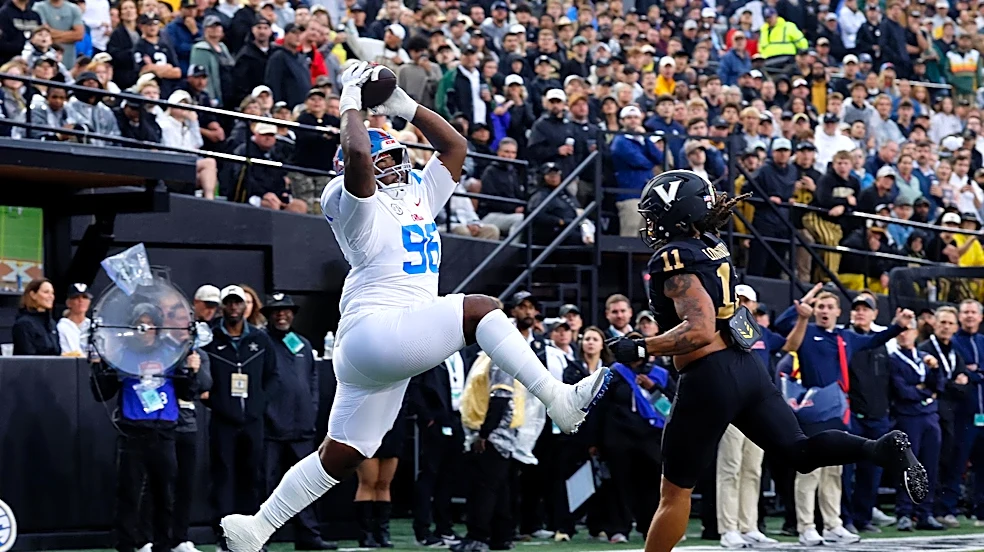



What better way to run out the clock on Friday than gorging on delicious numbers while we wait for Ole Miss and Missouri to step into the figurative squared circle.
Ideally, these numbers will help us see the advantages, disadvantages, and boring pushes for both teams. And, given the relatively small sample sizes, maybe we’ll find out some of these numbers are fraudulent. Who knows!
So let me stop dragging out this introduction and get into it. For today’s exercise, we’ll lean on TeamRankings, and Parker
Fleming’s Ole Miss/Missouri preview and focus on the Five Factors. As a note, Team Rankings only uses FBS vs. FBS stats, and Fleming uses FBS vs. FBS with garbage time stats removed.
As a reminder, the Five Factors are:
- Explosiveness
- Efficiency
- Finishing Drives
- Field Position
- Turnovers
If you win all or most of those categories, you’re probably going to win the game.
Explosiveness
Two ways to measure this are yards per play and points per play. The more explosive plays you have, the easier it is to have scoring drives.
Yards per play (via TeamRankings):
- Ole Miss offense – 24th (6.4) vs. Missouri defense – 15th (4.5)
- Missouri offense – 31st (6.1) vs. Ole Miss defense – 72nd (5.5)
Points per play (via TeamRankings):
- Ole Miss offense – 8th (0.571) vs. Missouri defense – 19th (0.256)
- Missouri offense – 32nd (0.476) vs. Ole Miss defense – 73rd (0.391)
Numbers you might expect from Ole Miss, though the Ole Miss defensive numbers got a nice bounce after dominating Vanderbilt.
As for Missouri, not an explosive offense, but the defensive numbers are strong. It should be noted the one dynamic offense they played (Mississippi State) torched them, which makes me lean in the direction of they’ve benefited from playing bad offenses in Troy, Kansas, and Texas A&M.
Florida was not a bad offense prior to the Missouri game (Ole Miss can confirm this!), but the Tigers showed everyone how to make them a bad offense, which South Carolina did one week later.
Efficiency
The best ways to measure this are success rate* and 3rd/4th down conversions.
*Rate at which offenses gain 50 percent of yards needed on 1st down, 75 percent on second down, and 100 percent on 3rd/4th down.
Ole Miss offense vs. Missouri defense success rates (via Fleming’s numbers):
- Ole Miss overall – 7th vs. Missouri overall – 14th
- Ole Miss rush – 19th vs. Missouri rush – 16th
- Ole Miss pass – 6th vs. Missouri pass – 18th
The Ole Miss offense does what it does, and like the explosive numbers above, we’ll find out whether Missouri’s numbers are inflated.
Missouri offense vs. Ole Miss defense success rates (via Fleming’s numbers):
- Missouri overall – 83rd vs. Ole Miss overall – 79th
- Missouri rush – 102nd vs. Ole Miss rush – 86th
- Missouri pass – 60th vs. Ole Miss pass – 56th
Missouri’s success rate numbers indicate they’re inconsistent from drive to drive and series to series, but they’re able to put together enough scoring drives with explosive plays and Austin Simmons making throws. They also get the benefit of a defense giving them great field position (more on that later!).
Now, let’s look at 3rd/4th down conversions:
- Ole Miss offense – 48th vs. Missouri defense – 57th
- Missouri offense – 98th vs. Ole Miss defense – 84th
The Missouri offense against the Ole Miss defense is quite the matchup. An offense that’s ready to see their punter take the field, and a defense that does not want to see their opponent’s punter take the field.
Finishing Drives
We’ll look at three things here. First, Fleming’s metric of points per drive:
- Ole Miss offense – 17th vs. Missouri defense – 17th
- Missouri offense – 60th vs. Ole Miss defense – 94th
Again, Missouri’s offensive rankings point to the inconsistency mentioned above, and Ole Miss’ defensive numbers are obliterated due to the Florida game and second half of the Louisville game.
If those three halves are outliers, we’ll see Ole Miss’ numbers steadily improve. If not, Ole Miss is going to give up a lot of points the rest of the way.
The second thing we’ll peruse is TeamRankings’ red zone and touchdowns per game numbers.
Red zone scoring percentage:
- Ole Miss offense – 1st (100 percent) vs. Missouri defense – 19th (75 percent)
- Missouri offense – 114th (75 percent) vs. Ole Miss defense – 71st (75 percent)
Touchdowns per game:
- Ole Miss offense – 14th (4.6) vs. Missouri defense – 21st (2.0)
- Missouri offense – 41st (3.6) vs. Ole Miss defense – 77th (3.2)
More copy and paste here. We’ll find out if the Missouri defense has feasted on bad offenses and if the Ole Miss defense is better than their three halves of disaster.
Field Position
If your offense gets the ball with shorter fields, that’s fewer yards they need to score points. And if your defense takes the field with an offense backed up, that’s more yards they need to score points.
Fleming’s numbers have the Missouri offense 12th in field position (via the defense), and Ole Miss’ offense checks in at 64th. As noted above, Missouri can get away with their inefficiency when the field is shorter.
Turnovers
Turnovers take away scoring opportunities from offenses and creating turnovers gives offenses more scoring opportunities.
- Ole Miss offense giveaways per game – 85th (1.4) vs. Missouri defense takeaways per game – 22nd (1.6)
- Missouri offense giveaways per game – 6th (0.4) vs. Ole Miss defense takeaways per game – 55th (1.2)
Trinidad Chambliss has turned it over 6 times (4 interceptions and 2 fumbles), which is a problem that needs fixing ASAP. Austin Simmons had turnover problems at Ole Miss, but he’s only thrown one interception in 2026, though he has fumbled twice. However, in watching him against Mississippi State and Texas A&M, he threw 3-ish passes that probably should’ve been intercepted, but he got away with it.
The point being, he still seems turnover prone, but, outside of the Vanderbilt game, the Ole Miss defense has been poor to quite poor at generating turnovers. So if he wants to throw passes to Ole Miss defenders, they should catch them.
TL;DR
The primary unknowns are:
- Is the Missouri defense as good as their numbers suggest or have they benefited from playing bad offenses?
- Is the Ole Miss defense as bad as their Florida and Louisville (2nd half) numbers suggest or are they in the process of righting the ship to be similar to last year’s defense (fine but not great)?
If the Ole Miss defense is trending in a non-trash direction and the Missouri defense will deflate against better offenses, Ole Miss should be fine, but we’ll know nothing definitive until early Saturday evening.