

Authors note: The data in this article is from early this past week. The theme was written before yesterday’s come-from-ahead, then come-from-behind win, but you will see many of characteristics I laid out here played out in the series ending game against the A’s.
To start with a high-level summary, the 2026 edition of the Cardinal pitching staff really isn’t that much different (performance wise) than the 2025 version. Under-lying metrics are inline, maybe slightly worse, but in a way that can almost
be fully attributed to the departure of Sonny Gray and all the K’s he racked up.
What is different is that this version of the pitching staff is considerably less expensive than the 2025 version. The Cardinals do not have a high payroll investment in this group, and they are not getting a high return. There is some equilibrium there and that is an improvement. The benefit of this improvement should become more apparent over time, and the reduced impact of aging, underwater contracts ostensibly can free up resources to improve the roster.
Now to some sordid details. I will go in the order of the title.
The good
Beyond cost-efficiency, what has gone well?
Health. Anything else? Well, actually, yes.
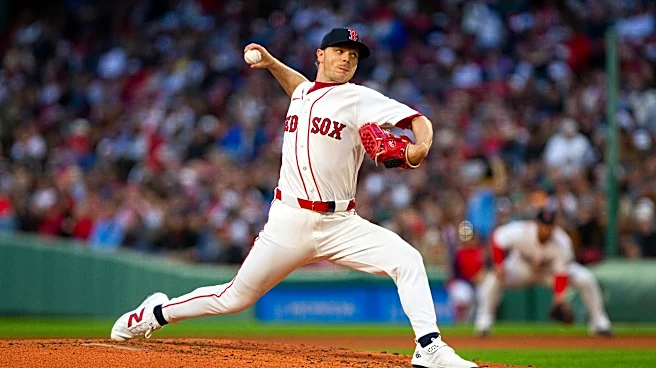
The Cardinal’s starting pitchers are tied for 13th place in MLB for BB% (top half!).
They are also top-half (tied for 12th) in MLB for Quality Starts and tied for 11th in the number of starter pitched innings.
What can we infer from these numbers? The QS and innings pitched by starters tell us that the starters are helping fuel this nice start by keeping the team in games and keeping the burden off a poorly performing bullpen. The decent walk rate tells us they have been slightly above average at not complicating their innings with walks.
The starters are also 11th in MLB in overall ERA at 3.96. This is a measure of how they have performed, not a good predictor of how they will perform. Their starter FIP is 4.53, so they are over-performing the FIP metric by more than half a run a game.
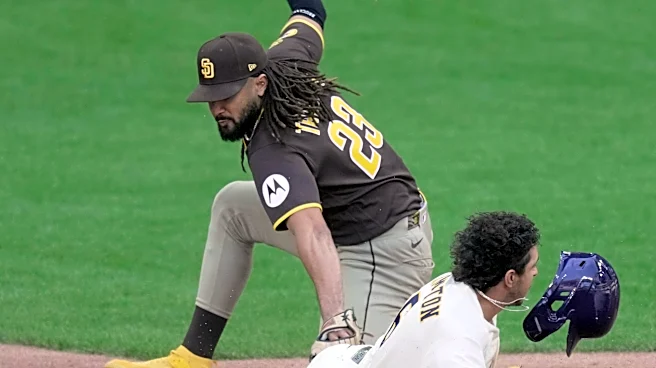
I’ll digress a bit into run prevention just a bit, which is more than pitching. The Cardinals are 6th in OAA, 5th in FRV and 3rd in DRS. Pick your preferred metric, they are quite good defensively. I will offer an opinion that the defensive prowess and the relative cap on walks likely explain some of the difference between ERA and FIP.
To carry this thought further, a very solid infield is kept active by a staff that is 2nd in MLB in GB%, just below the 50% mark. For the record, they are pretty much average (15th in MLB) with a BABIP at .288.
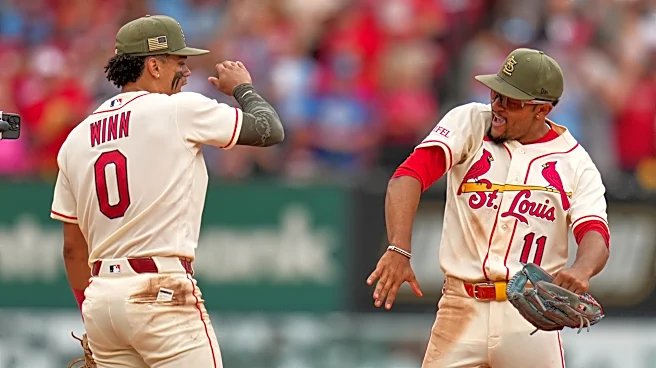
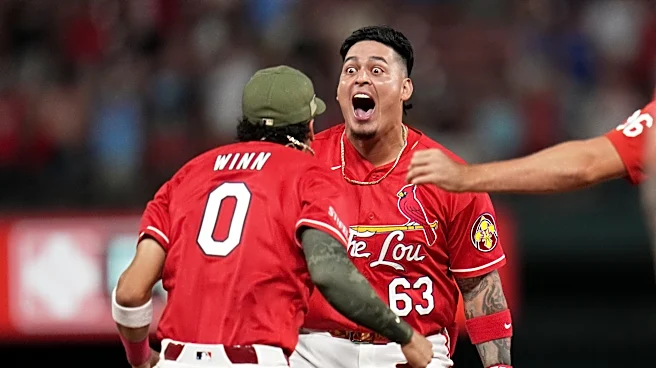
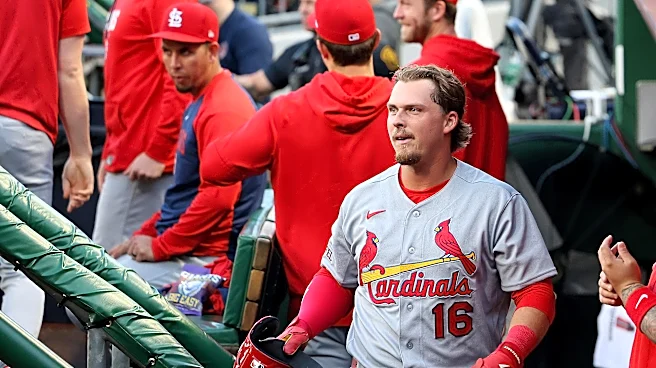
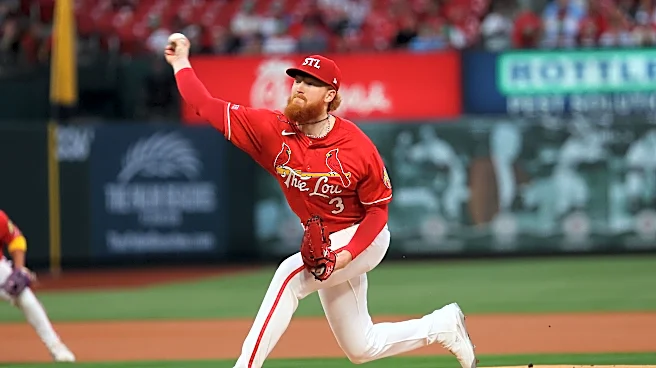
Enough about the starters. In the bullpen, well, most of the analysis is down below, in a different section. They are 2nd in the MLB in saves. By and large, this is a reflection of the outstanding performance of one player – Riley O’Brien.
The middling (a little creative license here)
Staff WPA is 1.60. 11th in MLB, they are providing a bit of value towards the winning side. By comparison, they were 24th at -1.43 in 2025. Improvement noted. It’s not great, but a little positive is better than a little negative.
This staff appears skilled at inducing weak contact overall, as their EV (exit velocity against) is 2nd in all MLB at 90.5, just behind Seattle’s premier staff. Fascinatingly, Cardinal pitchers have had double the batted ball events that Seattle pitchers have, so this is a two-faced metric (and also a much larger sample size).
The bullpen has some Jekyll and Hyde in them. On the good side, they are tied for 4th in the MLB in SD (Shutdown) appearance be relievers. An SD is tagged anytime a reliever adds at least .06 to the team’s odds of winning. Unfortunately, the group flat out leads MLB in number of MD (Meltdown) appearances, which is the inverse of a shutdown.
The bad
Batted ball metrics, particularly hard hit%, show the pitching staff at 2nd worst in the league at 36.4% hard hit rate. Given the earlier recognition that average EV is 2nd lowest in the league, what this says is they give up weak contact or really, really hard contact. A low average EV, a high hard-hit rate and an average BABIP tells us…what? BABIP is backwards looking. The hard-hit rate tells us that BABIP may not hold, and hints at how crucial positioning and defensive acumen is to this team.
Total fWAR of the staff is 28th in MLB. This is a direct result of the very low K% this team is producing, which at 18.9% is dead last in MLB. Probably another explanatory factor in the difference between ERA and FIP. ERA doesn’t care how you got the outs. FIP does. K% is more reliable at predicting future outcomes, because BABIP doesn’t influence strikeouts like it does ground balls. Food for thought.
The Ugly
The Cardinals have employed 8 relievers who have thrown more than 1 inning. Not a lot of churn so far. Five of the eight pitchers have walk rates 11% or greater, with group average of 11.4%. This poor number surprisingly is not the worst in baseball, ranking 24th in MLB. Too many extra runners.
Likewise, the Cardinals rank 26th in MLB in reliever K%. With the evolution of pitching, high K guys in the bullpen are a thing, and walks are tolerated because walks and strikeouts tend to not do much damage if the hitters can’t hit you (see O’Brien, Riley). In the extreme, a pitcher can walk 3 guys and strike out 3 guys and get away with no runs scored. But this group definitively lacks K power with a K rate of 19.9% against a league average of 23% and in this metric, a team wants to be above average, not 15% below it.
All this results in a group K%-BB% rate of 8.5% (15 or better is good), which ranks 28t in MLB. You can get away with low K rates as a pitcher, but only if they keep their walk rate down. They haven’t.
While they call them relievers, this group has not provided much relief. They are 28th in the league in LOB% at 68.4%. Average would be ~74%. The Cardinal bullpen is 2nd worst in the league in hard hit% at 37.8%, whereas average is more like 33%.
In summary
Well, the front office did not do a grand job building the bullpen. I think we kind of knew this. Building bullpens is a thing a team does when it thinks they have a competitive roster, not when they are rebuilding, so the reason is clear, even if the outcome is poor.
At some point in time, they need to add some firepower to the relief corps and find pitchers with better command. Let’s face it, though. That firepower is not in Memphis, nor is it found on the waiver wire. If it was, they would already be in St. Louis. What to do?
On the starter side, it’s OK. Not great, but not horrible either. The starters are keeping the team in most games. You could ask for more, but won’t get it until guys like Franklin, Doyle, Cijntje and Fajardo matriculate to the MLB roster.
The general trend in the first 40 games has been some incremental improvement in K rate and innings pitched. Looking down the road, innings are going to be a problem with Leahy and will be even more complicated if they trade May at the deadline. It does feel like Mautz and Dobbins could step in and take some IP, and perhaps Mathews will take that last step and be ready, so it is not as if the cupboard is bare like it was last year.