

On Thursday, Brady asked you which part of the roster was most responsible for the Giants’ not-so-good start to the season and here is the latest SB Nation Reacts survey response!

Respondents have it exactly right, which is always great to see. Whatever one’s feelings about the lineup might be — and, to be sure, there’s a range from “Best lineup the team has had since 2021 — maybe even better” to “Eh.” to “Seriously?” — there’s no question that its fecklessness has not only been a major embarrassment
to start the season, it has almost certainly cost the Giants a win or two. 7-9 or 8-8 look a lot better than 6-10.
The Giants have scored the fewest runs in the National League (51) and are 29th in MLB. Only the White Sox have scored fewer runs (49). If you lop off that 3-game series against the Yankees to open the season, their 50 runs scored raises them to 11th in the NL and 23rd in MLB. Meaningful? Well, two teams that are expected to be much, much better than the Giants have scored worse (Blue Jays: 46, Phillies: 44). I’m going to lop off those first three games for the purposes of this analysis, of course, because it suits me. Plus, if you do that, then the Giants are a 97 wRC+ team, tied with the Jays and the Brewers for middle of the pack.
So, given that… is the lineup really so bad?
Well, yes. The team doesn’t do things very well like avoid outs and hit the ball hard. Their 5.5% walk rate over the last 13 games (5.8% on the season) is dead last and their isolated power (ISO) is 23rd in MLB (13th in the NL).
A few days ago, I spotlighted the team’s walk rate as one of the red flags to keep an eye on this month. The team’s emphasis on contact has led to a massive shift in swing decisions which has manifested itself in batters drawing fewer walks. The philosophy would appear to be more contact means more on base. Is there something to that? From 2021-2025, the Giants’ 9.1% walk rate ranked 6th in MLB. Over this same stretch, their team OBP was just .315 (18th) with a batting average of .238 (25th) all of these factors leading to just 17th in runs scored. If I subtract 2021 from this analysis, then all of these rankings drop, of course.
But that’s a really dire walk rate to be sporting here in 2026. The lowest walk rate of the five previous seasons (so, since 2021) is 6.3%, which both the 2022 and 2023 White Sox sported “achieved,” along with records of 81-81 and 61-101, respectively. The bottom 10 seasons of walk rates over this span features one playoff team:
2023 White Sox: 6.3 BB% | .238/.291/.384 | 641 RS (3.96 runs/game) | W-L: 61-101
2022 White Sox: 6.3 BB% | .256/310/.387 | 686 RS (4.23 runs/game) | W-L: 81-81
2022 Tigers: 6.5 BB% | .231/.286/.346 | 557 RS (3.44 runs/game) | W-L: 66-96
2024 Marlins: 6.7 BB% | .244/.300/.378 | 637 RS (3.93 runs/game) | W-L: 62-100
2025 Rockies: 6.7 BB% | .237/.293/.386 | 597 RS (3.69 runs/game) | W-L: 43-119
2024 White Sox: 6.7 BB% | .221/.278/.340 | 507 RS (3.13 runs/game) | W-L: 41-121
2023 Royals: 6.9 BB% | .244/.303/.398 | 676 RS (4.17 runs/game) | W-L: 56-106
2023 Nationals: 7.0 BB% | .254/.314/.396 | 700 RS (4.32 runs/game) | W-L: 71-91
2021 Royals: 7.0 BB% | .249/.306/.396 | 686 RS (4.23 runs/game) | W-L: 74-88
2023 Marlins: 7.1 BB% | .259/.316/.405 | 666 RS (4.11 runs/game) | W-L: 84-78
So, there you have it. Evidence that walk rates matter. That the key to scoring runs is getting on base and hitting the ball hard — oh, but wait. I’ve got to hold on there. Those pesky 2023 Marlins. In the bottom 10 of runs scored and just 19th in OBP but they did have a .259 batting average, which ranked 4th in MLB. Maybe the Giants Giants feel that maybe the key to scoring runs is through batting average?
It’s certainly more entertaining, as Jay Jaffe pointed out last year. Despite there being extensive research showing that average “doesn’t correlate as well with run scoring as OBP, SLG, or more advanced metrics,” it’s still a major component of OBP and SLG. Two years prior to Jaffe’s post, a former FanGraphs writer said batting average “is REALLY important” by way of spotlighting this Ben Clemens post at FanGraphs which said that it’s only slightly additive.
[…] if you were making a prediction of how many runs a team would score and had only their OBP and SLG handy, you’d do fairly well. But if I whispered that team’s batting average in your ear, you could improve your prediction very slightly. The higher the number I whispered in your ear, the lower you’d revise your estimate. It wouldn’t be by much – there’s almost no useful predictive power in batting average – but to the extent that you moved your estimate, it’d be in an unintuitive direction. If you know a team’s OBP and SLG, batting average gives you very little additional predictive power, essentially noise in a weird direction.
It should be said that the pitching has gotten so much better that batting average is not as simple as putting a bat to a ball. For one thing, velocity tends to get more popups and flyouts than line drives or grounders. That said, this part of the discussion has done is cause me to go back and reconsider using ISO as a factor in labeling the Giants’ offense as bad, which we know it is, but if we want to be more exact about it then we shouldn’t simply look at the bad numbers without context. ISO strips away batting average and it basically says here is the team’s average on non-singles. Well, the thing is, the Giants love singles! They are better than walks! So, let’s instead examine the team’s slugging percentage. In that case, we see that it’s .392 since the end of the Yankees series. That’s 9th in MLB. They also have a .262 average — that’s 5th in MLB! Ah, but their OBP is just .301 — 26th.
So, drawing walks is a meaningful component of the game and is one of the better ways of increasing the offensive production of a lineup, absent power. If we just look at the top 10 batting average seasons since 2021, we see this statement supported by the data:
10. 2021 Red Sox: .261/.328/.449 | 829 RS RS (5.12 runs/game) | W-L: 92-70 | Walk rate: 8.6%
9. 2024 Astros: .262/.322/.419 | 740 RS (4.57 runs/game) | W-L: 88-73 | Walk rate: 9.0%
8. 2023 Rangers: .263/.337/.452 | 881 RS (5.44 runs/game) | W-L: 90-72 | Walk rate: 8.2%
7. 2024 Diamondbacks: .263/.337/.440 | 886 RS (5.47 runs/game) |W-L: 89-73 | Walk rate: 8.4%
6. 2024 Padres: .263/.324/.420 | 760 RS (4.69 runs/game) | W-L: 93-69 | Walk rate: 8.1%
5. 2022 Blue Jays: .264/.329/.431 | 775 RS (4.78 runs/game) | W-L: 92-70 | Walk rate: 7.5%
4. 2025 Blue Jays: .265/.333/.427 | 798 RS (4.93 runs/game) | W-L: 94-68 | Walk rate: 9.1%
3. 2021 Blue Jays: .266/.330/.466 | 846 RS (5.22 runs/game) | W-L: 91-71 | Walk rate: 9.5%
2. 2021 Astros: .267/.339/.444 | 863 RS (5.33 runs/game) | W-L: 95-67 | Walk rate: 7.3%
1. 2023 Atlanta: .276/.344/.501 | 947 RS (5.85 runs/game) | W-L: 104-58 | Walk rate: 8.4%
The Giants might be aiming for the Toronto Blue Jays model, but as you can see, that model doesn’t preclude hitters from drawing walks. Having the right personnel is very important for the “mostly contact” lineup strategy and if the Giants really wanted to make it a reality, then they might’ve pursued Bo Bichette in the offseason. He hit .297/.337/.469 for the Jays during his time with them (748 games over 7 seasons) and had just a 5.7% walk rate and 19.4% strikeout rate. He and Luis Arraez might’ve really forced the strategy to the fore.
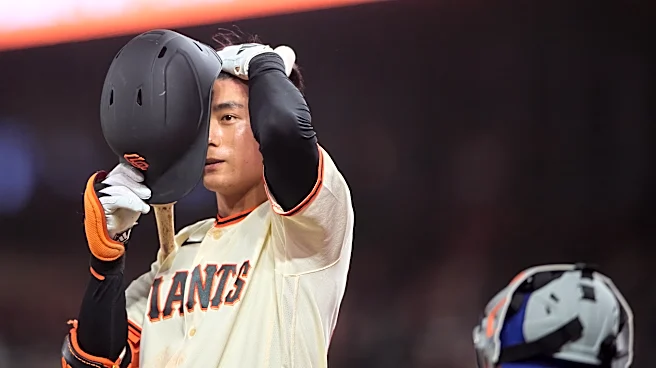
Of course, Jung Hoo Lee is supposed to be a high batting average guy. It just hasn’t worked out that way. If he could get his bat going, that might go a long way towards fixing the Giants’ lineup. Grandson of the Wind has had an 0-for-4 or worse in 35 of the 203 (17.2%) games he’s played for the Giants. For comparison’s sake, Aaron Rowand had 80 0-for-4+s in 509 games for the Giants from 2008 through 2011. That’s 15.7%.
The national question was pretty straightforward, as was the response.