

Every time I attend a Major League Baseball game with someone eclipsing my forty-and-a-half years, a similar scene plays out: the person will look up at the Target Field scoreboard—where batting averages are listed—and shake their head and/or let out some sort of derogatory phlegmatic noise.
Because of ever-increasing pitcher velocities and more reliance on (and perfection of) breaking pitches than ever before, hitters not named Luis Arraez are now largely “selling out” for hard contact because weak
contact no longer leads to as many base knocks as it used to. As such, batting average has taken a nosedive league-wide. But for decades, BA was held as the gold standard of player performance. So now, if viewed through that same lens, most batsmen look like “schlubs” in comparison to the .300+ hitters of yore.
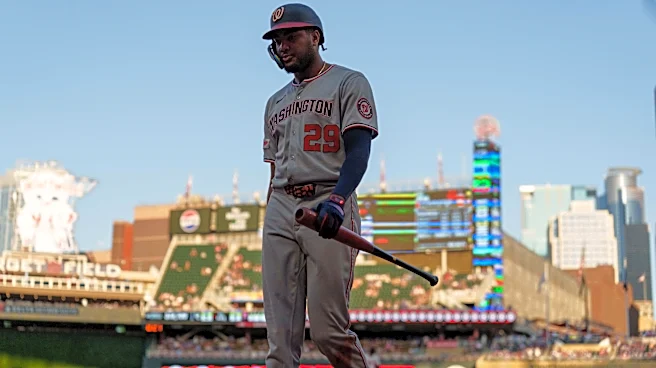
Well, not long ago the Washington Nationals’ TV broadcast dug up this interesting stat about star player James Wood that went viral and helps further explain why batting averages have bottomed out…

After not even three whole years in Major League Baseball, Wood has faced as many pitchers—more now—than all-time superstar Ted Williams ever did. Besides just being a “fun fact”, which it most certainly is, this little nugget has some pretty big things to say about why the current league batting average is .244—one of the paltriest figures since the mound was lowered in the late-1960s.
I’m not going to quest to prove this next assertion, but simply rely on the hitting expertise of Tony Oliva, who always maintained that the more times he stared down an opposing hurler, the more the advantage shifted in his favor. It stands to reason, then, that when analytical thinking began seeping—and then flowing—into baseball, this became a big area to gain the minuscule advantages separating winning ball clubs from losing ones. Entire pitching staffs are now constructed—for better or for worse—to limit not only pitcher overwork, but also overexposure. Studies have shown that even a theoretically less-talented fresh arm is better than a theoretically more-talented tired one going through the batting order a third or (God-forbid!) fourth time.

With that in mind, I thought it would be interesting to look at some plate appearances-per-pitcher history to see how dramatically things have shifted. No more rhyme or reason was put into the players chosen here other than trying to gain a chronological cross-section of various eras and throwing in some Twins for good measure.
I begin with Babe Ruth, who faced 456 pitchers over 10,628 plate appearances—or 23 PA/P. I realize that in reality a number like PA/P doesn’t mean a whole lot, but in terms of historical analysis it is easy to show the changes in pitcher deployment.
Let’s continue…
- Teddy Ballgame: 22 PA/P
- Mickey Mantle: 19 PA/P
- Willie Mays: 20 PA/P
- Harmon Killebrew: 16 PA/P
- Pete Rose: 20 PA/P

- Rickey Henderson: 10 PA/P
- Kirby Puckett: 12 PA/P
- Tony Gwynn: 12 PA/P
- Ken Griffey Jr.: 8 PA/P

- Albert Pujols: 7 PA/P
- Mike Trout: 6 PA/P
- Byron Buxton: 4 PA/P
- Aaron Judge: 5 PA/P

That brings us back to James Wood, who since his MLB debut in those olden days of ‘24 has faced 468 pitchers in 1,465 PA—or a paltry 3 PA/P. Utterly astounding.
It really helps to understand how one stat—especially one as fundamentally limiting as batting average—cannot forever define performance. If players like Buxton & Judge would have faced the same pitcher 4-5 times every game, they’d certainly be .300+ hitters. Whereas, if the Bambino & the Splendid Splinter were digging in 2-3 times a game against LHP relievers throwing 95+ mph gas and devastating sweepers/cutters/splitters, they’d perhaps be .260 hitters with power as well.