


Baseball is a game of numbers. It’s played on the field, with balls and bats and gloves, but every action, decision, and outcome is measured by a number. Those numbers are presented to us during broadcasts, in gambling ads, and by people like me on Twitter and in pieces here on OTM. Most of the numbers we see are presented without context.
Just this week, there was plenty of chatter about how Payton Tolle has reverse splits and performs better against righties than he does against lefties. If you
say that Tolle stats against righties are superior to those against lefties, you are correct. If you claim that opponents should start lefties against Tolle for that reason, citing that stat as evidence, you’d be a little bit off base.
In short, Tolle’s stats against lefties were worse than those against righties because he only throws to the best left-handed hitters. If he faced a lineup of nine lefties, he’d rack up strikeouts and groundball outs because of the pitches he has at his disposal. Tolle isn’t the point of this piece, though, so I digress.
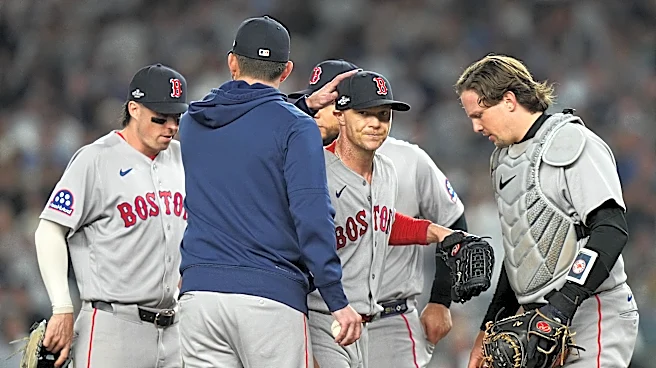
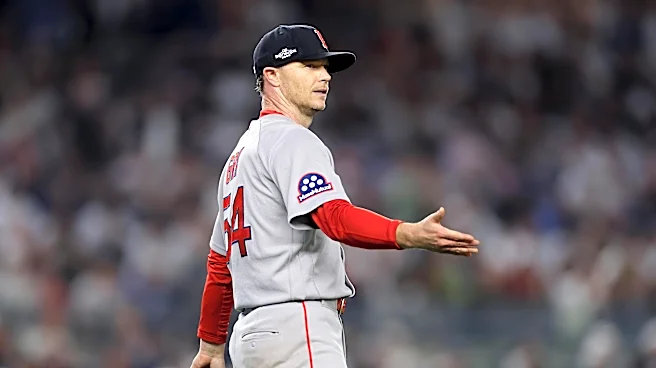
Another example of this came after the final game of the season. The Red Sox bullpen got caved in by the Yankees, and the season ended in embarrassing fashion. During the postmortem, Sonny Gray, who was pulled after just 4.2 innings and 70 pitches, expressed his displeasure at not being allowed to continue. He said that he’s the best pitcher in the American League at facing a lineup for a third time.
His numbers facing hitters for a third time are in fact excellent: .515 OPS against, 21.6% strikeout rate, 6.8% walk rate, and a .180 batting average in 162 plate appearances across 28 games this season. Despite this, Gray wasn’t allowed to see Cody Bellinger for a third time; Erik Miller came in and gave up a run, and the game snowballed from there, ending the Red Sox season.
If you read my work, you know I like numbers. I do my best to provide context and try to blend the stats with on-field applications, but I admit that I tend to believe what the numbers say even if they go against conventional wisdom. Those choices that go against conventional wisdom have come to be known as “analytics”. If people don’t agree with something, they blame “analytics” without knowing what information was actually used in that decision.
In this case, the consensus was that Gray was removed because “analytics” say that seeing a lineup for the third time is a disadvantage. The numbers presented above disagree with that sentiment, but the Boston Red Sox, who pay people to research these types of things, aren’t making decisions based on slash lines in 150 plate appearance samples. Still, the decision was, at least in some part, motivated by statistics.
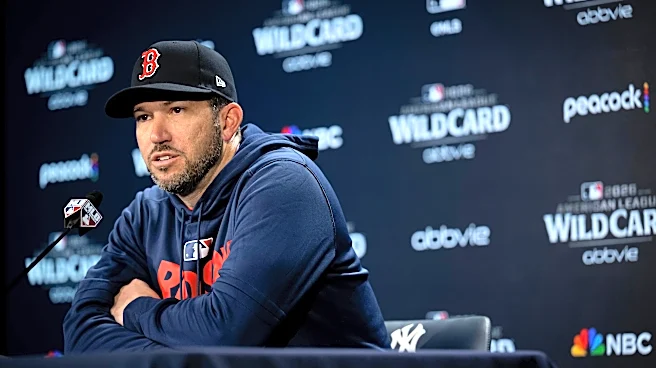
This piece is not in defense of Chad Tracy, Craig Breslow, or anyone else who might have had a hand in the decision-making process or game planning. In fact, I’ll go as far as to say that I staunchly disagree with the decision. I didn’t have a suite of statistics at my disposal at the time, but I thought Gray had a better chance of getting the out than Miller. I actually messaged the rest of the OTM staff and said: “So this is insane, right?” Before the game, I published a piece on how the Red Sox needed Sonny Gray to go deep into the game, for the sake of both Game 2 and a potential Game 3. Even after looking at the numbers that I’ll share momentarily, I disagree with the decision, although that’s easy to do in hindsight.
Instead of supporting or tearing down the decision, what I’m trying to do here is reverse-engineer the thought process and provide some context, because despite what sports talk radio or faceless Twitter accounts might tell you, it is much more nuanced than “third time through the order bad”. Let’s do it.
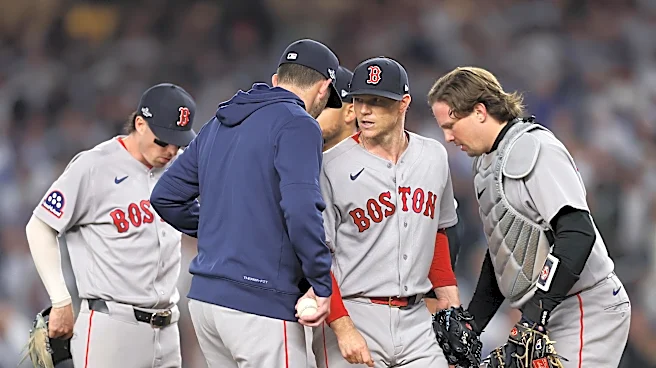
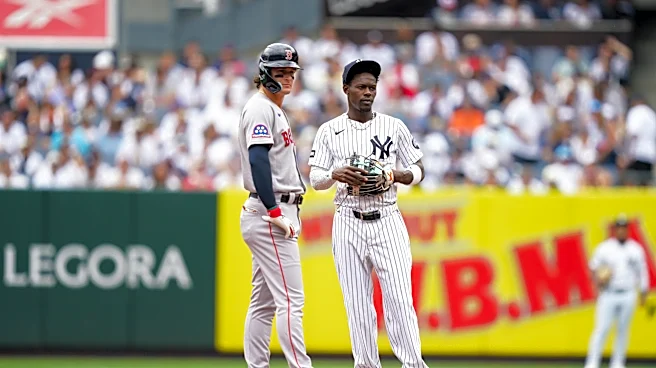
I’ll set the scene. It’s the fifth inning with the Yankees leading, 1-0. Trent Grisham has reached on a single to start the inning, and swapped places on the bases with Austin Wells, who grounded out to second base but beat the throw from Trevor Story to break up the double play. Ryan McMahon struck out on a good sweeper, and Ben Rice singled on a hard ground ball through the infield to move Wells up to third base. After 70 pitches and one earned run, Gray walked off the mound.
The first thing I’ll look at is Bellinger’s other at-bats against Gray. In his first trip to the plate, he roped a first-pitch sinker to Nick Sogard, who made a great pick to get the out. His second time up, he grounded out again, this time after fouling off three two-strike pitches and spitting on a good sweeper to his back foot. If you’re judging based on those two matchups alone, I could understand the decision to not give Bellinger a third crack at Gray. Bellinger looked like he was seeing the ball well.
Next, let’s look at how Gray approached the lineup to that point.

Against the eight lefties in the Yankees’ lineup, Gray used his four-seam and sinker a combined 59% of the time. The rest of his arsenal was made up of 12 sweepers, 10 curveballs, and three changeups. The fastballs were in the zone (~60% zone rate on both the four-seam and the sinker), while all three of his secondary pitches returned zone rates between 20% and 33%. While that might seem intuitive — fastballs in the zone, putaway pitches below it — that’s not always the case for Gray. He’s usually willing to flip his curveball in for called strikes, and occasionally does the same with his sweeper. On Wednesday, the plan was clearly to attack with fastballs for strikes, and breaking balls below the zone.
The Yankees’ lefties had the second-highest hard-hit rate against in-zone breaking balls from righties this season, as well as the seventh-highest barrel rate. They had the second-highest whiff rate, but Gray’s breaking balls didn’t miss bats in the zone this season. With those statistics in mind, it’s likely that Gray wasn’t going to change his game plan.
Now let’s look at the fastballs. The third time through the lineup, their performance seriously suffers. Entering the postseason, he threw his four-seam and sinker each about 18% of the time. He also used his cutter 15% of the time, but didn’t throw a single cutter to lefties on Wednesday and used it sparingly in his final start of the regular season, so it appeared to be removed from his game plan. The fastballs that he did use weren’t nearly as effective as they were early in games. The shape and velocity held, but the results did not. His four-seam ideal contact rate jumped from 40% to 56%, as the pitch found the middle of the plate often.

The sinker returned weak contact, but that was likely because the zone rate dropped from 60% the first two times through to 40% the third time through. Because of this, the called strike rate plummeted, and the strike rate fell to near 50%.
His breaking stuff wasn’t much better. The curveball had a huge swinging strike rate and chase rate, but when hitters did connect, it was hammered to the tune of a 67% ideal contact rate. The sweeper, his best whiff pitch, saw its chase rate drop 15% the third time through, thanks to bigger misses off the plate.

Bellinger is an excellent breaking ball hitter. Gray’s fastballs lose effectiveness later in games, and hitters don’t expand the zone as frequently against his sweepers. If those are your cards, you probably want to fold that hand in favor of another. The card that Tracy chose to play is a whole other can of worms, but there was a case for Gray to be removed.
If you read this and thought, “the analytics have gone too far, who cares that Gray’s sweeper is less effective the third time through the order it’s playoff baseball you pitch with your nuts not your arm blah blah blah”, I don’t blame you. As I wrote this, I questioned if I was too in the weeds myself, and still would have probably rolled the dice with Gray. Regardless of whether you agree or disagree with Gray’s early exit, I hope this provided some insight into what the team might have been thinking, because it really is deeper than blanket truths discovered by “analytics” that have been parroted 1,000 times by people who think Billy Beane ruined baseball.