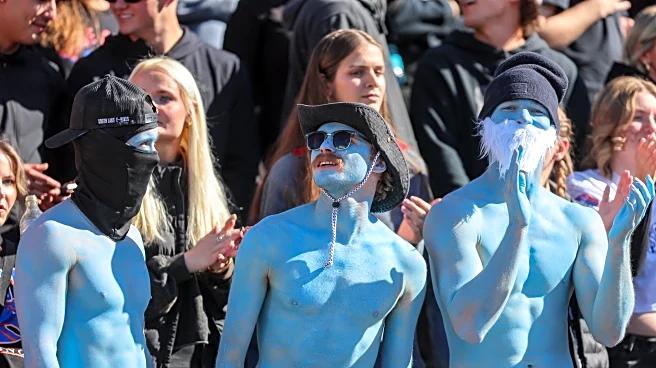
For the last three weeks, I have written about home field advantage, whether there is one, and which teams in the MWC travel the best. This week on Stats Corner, we are going to look at which stadiums
are advantageous for in each category. I realize that some of these advantages are based on teams and not stadiums, is the Blue Turf that advantageous or is it Boise State football? However, Boise State did also travel to other stadiums which affects the stats as well. Also, I did not always use Stadium names, but rather school names for example, I used San Diego State not Snap Dragon so as to not confuse readers who have not memorized all 12 stadiums, although Aloha Stadium is pretty obvious. And remember, all statistics represent the visiting team’s performance. For example, those 17.7 points aren’t what Fresno State scored at home, but rather what their opponents averaged in Valley Children’s Stadium. Finally, with some teams playing three and others four conference home games, averages are key, but outliers can certainly skew results – like Air Force’s 0-3 passing record with one interception significantly influencing Mackay Stadium’s (Nevada) completion percentage.
Scoring Average Per Game: The Toughest Fortresses
Fresno State 17.7
Colorado State 19.3
UNLV 19.3
Air Force 22.0
Wyoming 22.5
Boise State 25.0
Hawaii 25.0
San Diego State 25.3
Nevada 28.0
San Jose State 28.5
Utah State 32.5
New Mexico 41.3
Could it be the stadium’s atmosphere, the picturesque scenery, or perhaps the allure of local nightlife distracting opposing players? Whatever the reason, Fresno State stands out with the lowest scoring average allowed to visitors in the conference. In stark contrast, New Mexico and Utah State’s venues see the highest offensive explosions. It’s no shock, perhaps, that the stadiums allowing the fewest points hosted teams that collectively boasted a dominant 16-5 conference record, while the bottom six all played host to losing teams.
Average Yards Per Game: Where Offenses Go to Die
Nevada 320.3
Air Force 334.0
UNLV 342.3
Wyoming 351.5
Boise State 360.7
Fresno State 377.7
San Jose State 394.0
Colorado State 405.8
San Diego State 411.7
Hawaii 443.8
Utah State 454.8
New Mexico 474.3
Maybe there is something to the stadiums, Nevada went 0-7 (the only MW team to not win at least 2 conference games), but they have the lowest yards per game. Teams could not move the football inside Mackay Stadium. Air Force, with a losing conference record, made it tough for visitors to move the chains. While high altitude might be a factor, it can’t be the sole explanation, as some of the “worst” performing stadiums are also at elevation.
Average Yards Per Play: Small Gains, Big Impact
Fresno State 4.8
UNLV 5.0
Nevada 5.4
San Jose State 5.4
Boise State 5.7
Wyoming 5.7
Colorado State 5.9
Hawaii 6.1
New Mexico 6.3
Air Force 6.4
Utah State 6.4
San Diego State 6.8
Not only do opponents struggle to score in Valley Children’s Stadium, but their plays also appear to be stifled, averaging just 4.8 yards. However, just a short trip down the road to San Diego State’s turf, visitors gain a remarkable two additional yards per play. That’s a massive swing in efficiency.
Turnovers Per Game: The Takeaway Zones
Fresno State 2.3
Utah State 2.3
Colorado State 2.0
UNLV 2.0
Boise State 1.7
San Jose State 1.5
Air Force 1.3
Hawaii 0.8
Nevada 0.7
New Mexico 0.7
San Diego State 0.3
Wyoming 0.3
When facing the Bulldogs or Aggies at home, visiting teams better be prepared to share the ball – or rather, give it away, as these stadiums see the most opponent turnovers. Interestingly, nearly half of the conference stadiums average less than one turnover per visit.
Average Penalty Yards Per Game: Flags Flying High
Colorado State 90.3
Utah State 76.5
Hawaii 73.0
Fresno State 67.0
UNLV 67.0
San Diego State 65.0
San Jose State 64.8
Wyoming 60.0
Boise State 46.3
Air Force 44.0
New Mexico 43.3
Nevada 30.3
I cannot come up with a reason why teams who visit Canvas Stadium have three times as many penalty yards as teams going to Nevada. While extreme differences in altitude (Colorado State, Utah State) and travel distance (Hawaii) might play a minor role, this doesn’t fully explain the stark contrast, especially when other high-altitude venues like New Mexico, Air Force, and Boise State see far fewer flags. Utah State’s “The Herd” is known for its raucous environment, but is the same true for the Rams’ student section?
Average Passing Completion Rate: Airing it Out or Shutting it Down?
Nevada 40.4%
Fresno State 48.9%
Wyoming 55.7%
Colorado State 56.9%
Boise State 59.8%
Hawaii 60.6%
UNLV 62.2%
San Jose State 62.5%
Air Force 64.8%
Utah State 66.7%
New Mexico 67.6%
San Diego State 75.3%
As mentioned, Air Force’s specific game certainly boosted Nevada’s numbers, but Mackay Stadium remains a tough place for visiting quarterbacks, holding them to a paltry 40.4% completion rate. Fresno State’s stadium also keeps opposing QBs under 50%. On the other side of the spectrum, road quarterbacks seem to relish playing at Snap Dragon, where the completion rate soars to an astonishing 75.3% – a full 8 percentage points higher than any other venue.
Average Number of 1st Downs Per Game: Sustaining Drives
Air Force 15.0
Boise State 15.3
Nevada 17.7
Wyoming 18.3
Colorado State 20.0
UNLV 20.3
Fresno State 22.0
San Diego State 22.1
Utah State 22.8
San Jose State 23.3
Hawaii 24.0
New Mexico 24.3
First downs are the lifeblood of sustained drives and scoring. The high-altitude stadiums of Air Force and Boise State restrict opponents to roughly 15 first downs per game. Compare that to Hawaii and New Mexico, where visiting teams consistently rack up over 24 first downs, allowing them to methodically march down the field.
3rd Down Conversion Rate: The Critical Down
Wyoming 23.4%
UNLV 27.5%
Boise State 31.9%
Air Force 32.3%
Fresno State 32.7%
Colorado State 37.5%
Hawaii 40.4%
Utah State 42.1%
San Jose State 46.9%
New Mexico 50.0%
Nevada 51.2%
San Diego State 55.9%
Playing in the highest stadium in the country, Wyoming’s War Memorial Stadium makes 3rd down conversions a nightmare for visitors, with less than one in four attempts succeeding. Conversely, three MWC stadiums allow opponents to convert a staggering 50% or more of their 3rd downs, highlighting significant defensive differences.
4th Down Conversion Rate: Going for It
Air Force 0%
Wyoming 14.3%
San Diego State 33.3%
Colorado State 50.0%
Utah State 50.0%
UNLV 58.3%
Fresno State 66.7%
New Mexico 70.0%
Hawaii 72.7%
Nevada 75.0%
San Jose State 76.5%
Boise State 76.9%
A stark warning to aggressive play-callers: Do not attempt a 4th down conversion in Falcon Stadium. It simply won’t go well. War Memorial Stadium isn’t much more forgiving. Remarkably, if you’re a road team looking to extend a drive on 4th down, the “Blue Turf” of Boise State offers the easiest path to success, converting over 75% of attempts, I think the most surprising statistic. In fact, going for it on 4th down appears to be an MWC road tradition, with three stadiums allowing 75% or more conversions, and nine allowing at least 50%.
Red Zone Attempts Per Game: Knocking on the Door
Air Force 2.3
Colorado State 2.5
Boise State 2.7
San Diego State 2.7
Wyoming 2.8
UNLV 3.0
Fresno State 3.3
Hawaii 3.8
Nevada 4.0
San Jose State 4.3
Utah State 4.5
New Mexico 4.7
Not only does Falcon Stadium shut down 4th downs, but it’s also the conference’s toughest venue to even reach the red zone, allowing only 2.3 attempts per game – roughly once per half. Compare this to University Stadium, and three other stadiums, where opponents often find themselves in scoring position almost once every quarter.
Red Zone Scoring Conversion: Finishing Strong (or Falling Short)
Fresno State 70.0%
Hawaii 73.3%
Boise State 75.0%
San Jose State 76.5%
Colorado State 80.0%
UNLV 81.8%
Air Force 85.7%
San Diego State 87.5%
Utah State 88.9%
Nevada 91.7%
New Mexico 100%
Wyoming 100%
Despite University Stadium allowing frequent trips to the red zone, you might hope for a low conversion rate. But alas, it’s 100% successful for visitors, matching War Memorial Stadium! Perhaps there’s something about sea level here, as the lowest stadiums also boast the lowest red zone conversion rates.
Average Distance Per Punt: The Thin Air Advantage
Colorado State 39.6
San Diego State 39.6
UNLV 40.8
Air Force 41.5
Fresno State 41.9
Hawaii 41.9
Nevada 42.8
Utah State 43.6
San Jose State 44.4
New Mexico 45.0
Boise State 45.6
Wyoming 46.0
This is one stat where altitude likely plays a legitimate role. Thinner air and less resistance mean punts travel further. While 7 yards might not seem monumental, it effectively gives opposing teams another crucial set of downs to work with in terms of field position.
Field Goals Made: Kicking Through the Clouds
Fresno State 50.0%
Hawaii 55.6%
San Jose State 60.0%
Colorado State 62.5%
Nevada 80.0%
New Mexico 80.0%
Wyoming 87.5%
Air Force 100%
Boise State 100%
San Diego State 100%
UNLV 100%
Utah State 100%
Another category where altitude almost certainly makes a difference. The ball’s extended flight in thinner air provides a considerable advantage for kickers. Consequently, many high-altitude stadiums in the MWC boast a perfect 100% field goal conversion rate for visitors, contrasting sharply with the three lowest percentages found at sea-level venues.
Our deep dive into MWC stadium statistics reveals a fascinating truth: while team prowess is paramount, the physical characteristics and atmosphere of a venue undeniably play a subtle yet significant role in shaping game outcomes. From the stifling defenses in Fresno State’s Valley Children’s Stadium to the high-scoring haven of New Mexico, these numbers hint at more than just talent on the field. The dramatic shifts in passing completion rates, penalty yards, and particularly the undeniable influence of altitude on punting distances and field goal percentages, paint a complex picture. It’s clear that everything from air density to the raucous crowd, and even perhaps the local distractions, contributes to an advantage or disadvantage for visiting teams. Next week we will end our series which a ranking of which stadiums give the greatest home field advantage in Mountain West football.


