

There have been 68 NFL QBs who have made 8 or more starts in both their second and third years in the NFL since the start of the 1994 season. All six of the QBs taken in the first round in 2024 are expected to do so in 2026. I looked at the relative change in QB stats from year two to year three for these 68 starters and then averaged how they fared. Most QBs who are going to make the jump from questionable starter to competent-long-term starter do so in their third NFL season in the modern NFL where
first round rookies almost always start at QB during their rookie season.

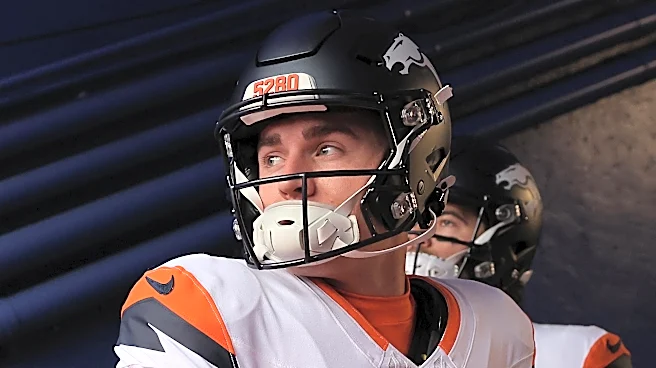
On average these stats did not change much from year to year. The largest relative change was a 15% increase in interception percentage. This was somewhat surprising. Interestingly the largest good change was a 11% increase in TD/INT ratio on average. So using what Bo Nix did in 2025 here is what we would expect IF he were average among this group (which is not – he is well above average).

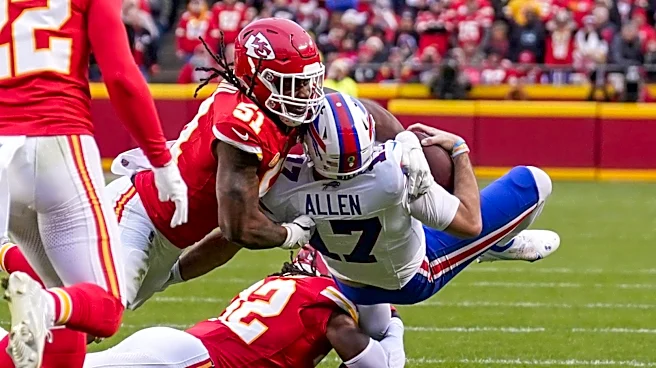
Notice that many of the rate stats get a little worse for Nix in 2026 if he follows the average trend. The exceptions are completion%, TD/INT ratio, and success rate – all of which tick up a little. The QBs that had the biggest increase in passing success rate in year 3 relative to year 2 were Josh Allen, J.P. Losman and Brian Griese. The first name was expected since he is the poster child for year 3 improvement, but the other two names surprised me. Losman started only 8 games for the Bills in 2005, but he was the every game starter for them in 2006. He completed less than 50% of his passes in 2005 (49.6%) and then jumped all the way to 62.5% in 2006. This came with a 20 point jump in passer rating (64.9 to 84.9) and a big jump in success rate (33.9 to 42.9). The story is different for Griese. He started 13 games for the Broncos in second season, but then only started 10 in his 3rd season due to injury. His third season was his career year though – the year where he threw 19 TDs and only 4 INTs. His comp% went from 57.7 to 64.3, passer rating from 75.6 to 102.9, and success rate from 42.2 to 51.3. In case you forgot, Gus Frerotte started the other six games.
Of course with the average for most stats hovering around zero, there have to be some guys who got a lot worse in year 3. The three who had the biggest negative change in success rate were Derek Anderson (46.4 to 40.4), Drew Brees (42.7 to 35.3) and JaMarcus (the Hutt) Russell (38.1 to 28.1).

It’s interesting to look at outliers in other areas as well. The guy with the biggest jump in passing TDs was Sam Bradford who went from 6 to 21. The Hutt had the biggest drop in passing TDs from 13 to 3. In terms of INTs the biggest improvement was Brian Griese who went from 15 to 4. The biggest percentage increase was Nick Foles who went from 2 to 8. Foles played out of his mind in 2013 and then turned back into a pumpkin for every other year of his career (save for a brilliant playoff run in 2017). Another QB who had a huge jump in INTs in his 3rd season relative to his second was Josh Freeman who went from 6 INTs to 22 INTs. The biggest relative jump in passer rating was Brian Griese at 36%, but Losman (31%) and Allen (26%) also had huge jumps. The three biggest drops in passer rating belong to the Hutt, Jake Plummer (-32%) and Foles (also -32%).
The change in sack% is interesting because while most of these QBs got marginally better as passers in their 3rd season in the NFL, they generally got sacked more. I guess this makes sense. As a QB matures, he tends to realize that a sack is a much better outcome than an INT. The biggest change in sacks belongs to Joey Harrington. He was only sacked 9 times in 16 starts in 2003, he actually had the lowest sack rate in the NFL in his first AND second seasons. In his third season, he improved as a QB and this led to MORE sacks – 36 of them – but his INTs dropped from 22 to 12 in about the same number of pass attempts. Jay Cutler and Nick Foles had the biggest drop in sack rate year 2 to year 3. Year 3 for Cutler was his only Pro Bowl season (back when it meant something). His sacks dropped from 27 in 2007 to 11 in 2008. Ryan Clady played a big role in that drop. Oddly enough, Jay would lead the league in sacks with 52 in 2010 with the Bears – who didn’t have Clady at LT.
But remember how I said Bo Nix is not average, he should all agree that he is at least above average, so what would his 2026 numbers look like if he makes a decent (25% of the maximum) improvement in all stats. That is below.

Those numbers would be really good, but many would not have led the league in 2025. 5186 passing yards would have, but here are the best values in all of those other stats from 2025.
- COMP% – 72.0% (Drake Maye)
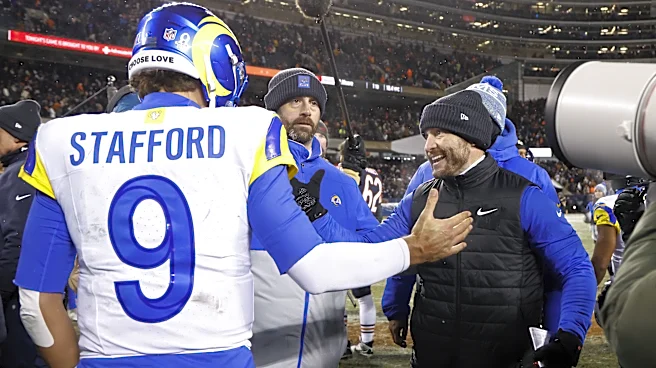
- Passing Yards – 4707 (Matthew Stafford)
- TDs – 47 (Stafford)
- Fewest INTs for a full-time starter – 6 (Two tied)
- TD% – 7.7% (Stafford)
- Lowest INT% – 1.3% (Stafford)
- Passer Rating – 113.5 (Maye)
- Lowest Sack Rate – 3.47% (Nix)
- ANYA – 8.3 (two tied)
- Y/C – 13.3 (Lamar Jackson)
- Success Rate – 55.3% (Brock Purdy)
The most passing yards in a 16 game season was Peyton Manning in 2013 with 5477 for the Broncos. There have been 15 times a QB had topped 5000 passing yard in a season. The last was Patrick Mahomes in 2022. That was the last 16 game regular season. Bo got 231 passing yards per game in 2025. For him to get 5186 passing yards in 2026 would mean 305 passing yards per game. Stafford led the league last season with 277. Kermit the QB was the last to top 300 per game (2022). PFM in 2013 got 342 passing yards per game, which still seems like a fever dream (that turned into a nightmare in the Super Bowl).
What do you think Bo will do in 2026 relative to 2025 as far as stats? Let me know in the comments. Of the 68 QBs listed who do you think is the best analogy to Nix?