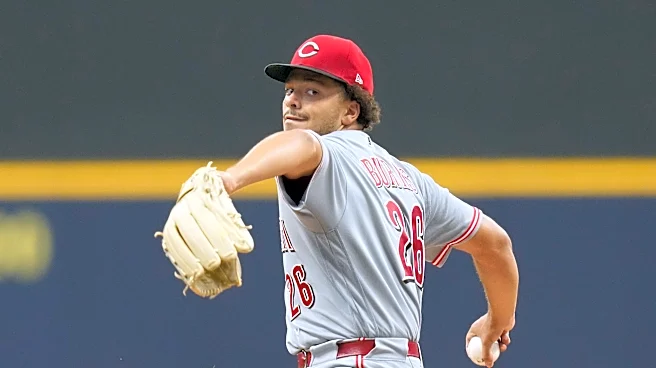



In part 1 of this series, I looked at the past 30 years or so of teams and what we might generally expect based on little more than knowing how good a team’s best two players. Today, in part 2, we’ll pick up with a question that wonders if it should matter that De La Cruz and Burns were paid so little, relative to the overall team payroll.
Question #5: What does the percentage of payroll represented by a team’s top two players tell us about their win expectancy?
To answer this question, I first narrowed
the set of teams to include. In short, I pulled only those teams from the past 30 years for which both their top position player and top pitcher ended the year somewhere between 4.5 and 6.5 WAR. This is meant to give an approximate range that we can suitably compare against the performance of Elly De La Cruz and Chase Burns. There are 129 such teams in this data set and while the range of wins from these teams spanned from 62 to 107, we can still see a general trend line within this specific subset:

Incidentally, there were five teams with such a profile in 2026 (Reds, Braves, Guardians, Dodgers, and Rays). Four of them won their respective division.
The relationship is not terribly strong, however, and I posited that the variance within this group could be better explained by how much of a team’s payroll is assigned to those two players.
A quick data note here to say that historical team payroll data is probably not the most reliable information in the baseball universe. Sites that do track payroll, most notably Spotrac, don’t include data that goes back as far as 1996. I was able to find payroll data that stretches back that far from The Baseball Cube, and I was reasonably satisfied that the payroll data is directionally accurate, if not perfectly so.
Nonetheless, data does exist and I used it to create a new point of comparison: For the 129 teams graphed above, how do team wins compare against the proportion of payroll paid to just the top position player and top pitcher?

The answer: nothing.
Within this data range, the amount paid to the top hitter and top pitcher explains none of the variance in wins.
In 2017, the Arizona Diamondbacks operated with a payroll of a little over $90M. They paid Paul Goldschmidt $8.75M and received 6.1 WAR in return. They paid Zack Greinke $31M and received 5.8 WAR in return. Basically 12 WAR for 44% of the team’s payroll. The team won 93 games.
In 2001, the Houston Astros operated with a payroll of a little over $60M (coincidentally, both teams’ payrolls were right around half of the highest team payroll from those respective seasons). Their best players were Lance Berkman (6.5 WAR) and Wade Miller (5.3 WAR), who the team paid $305K and $241K, respectively. Basically 12 WAR for less than 1% of the team’s payroll. The team won 93 games.
These two examples are emblematic of the overall data. Moreover, when I look at different ways to measure payroll, I see only marginal improvements to the predictability of win totals. Here, for example, are those 129 teams graphed so as to compare team wins to how close each team’s payroll was to the highest in the league:

Yeah, it’s better to be a high payroll team than not…but you won’t make a ton of money betting strictly on that info.
So, then: if the payroll attributed to the best two players is not a predictor of success, what categories might make sense to view the 2026 Reds through? And what historical teams had similar situations to what the Reds had with Elly and Chase and what might we learn from their examples?
Here are seven categories that we should examine these teams through, starting with the 2026 Reds:
Injuries:
- Hunter Greene pitched just five games in 2026 due to assorted arm troubles. While he has yet to appear in more than 26 games in a season, Greene contributed 4.2 WAR in 2025 and 6 WAR in 2024.
- Nick Lodolo had blister issues at the beginning of the season, limiting him to 20 starts and 103 innings for the year. He was coming off a 4.7 WAR, 131 ERA+ season, but managed just 1.1 WAR and 83 ERA+ in 2026. Obviously, it’s tough to know how much of the sharp decline is injury related.
- Closer Emilio Pagan missed most of May and all of June. His 2026 has been serviceable, (1.2 WAR, 119 ERA+), but is a downgrade from 2025 (1.9 WAR, 152 ERA+).
- Third baseman Ke’Bryan Hayes missed more than 40 games from May to July. He was barely above replacement level in his Reds tenure in 2025 and has been below replacement in 2026. It would be a stretch to suggest that Hayes’s injury has hurt the team.
- Utility player Spencer Steer missed the final two-plus months of the season. He ended the year with 0.2 WAR.
- Summary: Greene was a huge loss, clearly. The timing of his March elbow surgery precluded any robust contingency moves by the team, to the extent that they would have pursued one. That injury, plus Lodolo, put a strain on the pitching staff throughout the year. In general, the team was not especially cursed with bad injury luck, although the pitching was certainly impacted.
Dead Weight:
- Jeimer Candelario, released midway through the 2025 season, still made up 10% of the Reds payroll in 2026.
Surprising Breakthrough:
- The point of this section is to examine if the two best players on the team were projectable. In other words, was there reasonable expectation during the offseason last year that these two would be as good as they were?
- Elly De La Cruz was entering his 3rd full time season in 2026 and posted WAR totals of 5.2 in 2024 and 3.6 in 2025. He definitely exceeded expectations in 2026 but his season was not outside a reasonable projection range.
- Chase Burns was a prospect with a high pedigree and he pitched 43 innings at the big league level in 2025 after dominating at the AA and AAA levels. It’s not like no one saw him coming, but a 5 WAR season would have been deemed unlikely by all but the most supportive of relatives.
Position Player Depth:
- The Reds were disastrous at 2B, 3B, and all three OF positions. Matt McLain has been a tantalizing but ultimately disappointing second baseman since a shoulder injury in 2024. Ke’Bryan Hayes is widely seen as the worst every day player in baseball. An assortment of flotsam and jetsam in the outfield combined to be 29th out of 30th in terms of Wins Above Average.
- First baseman Sal Stewart has had an excellent counting stat season, but doesn’t register well in the WAR category. He’s young and has a good hitting profile though.
- The Reds were not above average at any position but shortstop.
Starting Pitcher Depth:
- Other than Burns, no starter had an ERA+ above 90. Andrew Abbott and Brady Singer both fell short of expectations, with Singer bordering on unpitchable.
- Hunter Greene’s injury-plagued year forced Rhett Lowder and Brandon Williamson into more innings than would have been normally expected. Both were sub-replacement level.
Relief Pitcher Depth:
- A below average outfit overall, the Reds had some OK-to-decent pieces to rely on (Pagan, Brock Burke, Tejay Antone, Julian Garcia), but nearly all other arms in the pen were flat out bad.
- The bullpen inefficacy was compounded by the lack of quality arms in the rotation. The bullpen threw more innings than average relative to the rest of MLB.
Did the 2026 Reds fail to prepare appropriately for the combination of Elly De La Cruz and Chase Burns?
We’ll come back to this one. In part 3, we’ll look at some five historical teams which had similar top hitter/pitcher combinations and payroll impacts as the 2026 Reds and will wrap up with some final thoughts and conclusions.