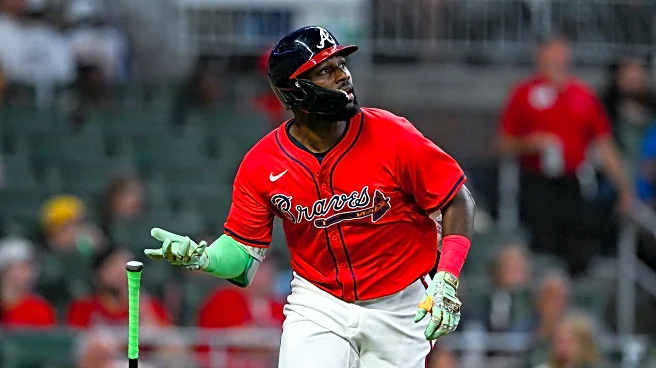


Everything about Michael Harris II’s 2025 season was a study in extreme contrasts. His outputs were horrendously offensively, then scintillating, and then back to horrendous. He massively underhit his xwOBA in four of the season’s six calendar months; only four players that got the full suite of 600+ PAs this season underhit it by more than Harris. And yet, he somehow finished in the top 40 in MLB in RBI… despite negative WPA and RE24, and the fact that his wRC+ went from 97 with the bases empty
to 66 with men on base.
On September 26, Harris hit his 20th homer, giving him one of the 510 20-homer, 20-stolen base seasons recorded to date. 510 isn’t that impressive in a vacuum, but what it makes it even less notable is that given MLB’s recent rule changes surrounding stolen bases (not to mention the relative juiciness of the ball from 2015-onward), the rarity of a 20-20 season is, well, not very rare these days. To wit: 2025 featured 24 of the 510 20-20 seasons in history (nearly five percent); there were 18 last year and 19 the year before that. As you can see from the below, not only is the 2025 tally an obvious peak, but much of recent history prior to the stolen base changes had nine or ten 20-20 seasons.

Was Harris’ 20-20 campaign the worst, straight-up, out of the 501? Nah. But, the fact that he managed a 20-20 campaign with a wRC+ in the 80s and under 2 fWAR makes it kind of fun to think about all the other bad 20-20 seasons. So, here we go.
Just barely made it
Six 20-20 campaigns in history have ended exactly at 20-20, including the one by Harris. Amazingly, Randy Arozarena has somehow done it twice — in 2021, and then again in 2024. Nolan Jones managed it last year, meaning there’s been a just-barely-qualifying campaign in each of the last three seasons, and in four of the last five. Andrew Benintendi managed it in 2017, and then Toby Harrah had the earliest such season back in 1979.
Making it hard for yourself
You need hits and/or walks to set yourself up to steal bases. O’Neil Cruz finished 2025 with a 20-38 season, yet a .200/.298/.378 slash line. His 2025 season was a lot like the one posted by Harris, just with more steals and a higher xwOBA, but a similarly-notable underperformance. While Cruz’ .200 average is the lowest-ever for a 20-20 season, Harris has the lowest-ever OBP for one of those seasons, with .268. Cruz also somehow managed just a .378 slugging, which, again, is the worst-ever mark among the 501 seasons we’re looking at; Harris clocks in with the lowest wOBA at .289.
While xwOBA has only been around since 2015, nearly a quarter of all 20-20 seasons have happened since the availability of Statcast data. Tim Anderson’s 2018 takes the cake here — he had just a .272 xwOBA (.294 wOBA) in his season. Meanwhile, Arozarena’s 2021 might be the double-piddliest in terms of deservedness, as he had a .300 xwOBA but a .350 wOBA and just snuck in with exactly 20 homers and steals each.
The Ruben Sierra section
If nothing else, the changes to the rules help illustrate why adjusting pretty much all stats for league context is important. To that end, we should highlight Ruben Sierra’s 1993 season (22-25), in which he had just a 79 wRC+ — the only 20-20 season ever whose wRC+ doesn’t round up to at least 80. Sierra finished that season 15 runs below average. But wait, it gets weirder.
We didn’t exactly have good defensive metrics in 1993, so when you look at defensive value on FanGraphs/etc. for those years, it involves retroactively assigning players value based on Total Zone-esque play-by-play data. Somehow, Sierra racked up an insane -25 Total Zone runs that season, meaning that combined with his 79 wRC+, he was worth -2.6 fWAR that year. Again, it’s totally fine to look askance at anything Total Zone-inferred, but yeah, that was… not a good 20-20 season.
Not satisfied with blaming Total Zone and/or Ruben Sierra? In 2018, Ian Desmond (22-20) managed an 82 wRC+ at Coors Field while playing horrendous defense at first base; his -0.4 fWAR is the lowest overall for anyone whose fWAR is informed by Statcast-era defensive metrics.
Volume, not efficiency
Ken Williams owns MLB’s first 30-30 season, which he pulled off with the St. Louis Browns back in 1922. Williams pretty much always straight-up raked, so the hitting component of his 30-30 campaign, as well as the 24-20 campaign he managed in 1921, was never in doubt. But… he was not judicious at all with his running. To get to 20 steals in 1921, he had to get thrown out 17 times. Even the following year, he got 30 steals while getting thrown out 20 times.
Of the 510 20-20 seasons, 42 have featured negative wSB, i.e., the player lost more value getting thrown out than he gained with successful steals. Williams’ 1921 campaign featured him giving away three more runs’ worth of stolen base value than he gained; only he and Bobby Bonds in 1979 exceeded more than two runs’ worth of value lost in this regard. Amazingly, Bonds stole 34 bases that year, but got thrown out 23 times.
Aided (or not) by the universe
FanGraphs only tracks HR/FB going back to 2002, which covers a little less than half of all the 20-20 seasons. Sorting by HR/FB is actually kind of boring — the nine highest HR/FB seasons all finished with at least 36 homers.
But then, there’s Tommy Pham’s 2017, in which he finished with 23 homers (and 25 steals)… and a 27 percent HR/FB. Leaguewide HR/FB was 14 percent that year; suffice to say that if Pham ran that HR/FB rate, he’d finish nowhere near a 20-20 season.
On the flip side, Jimmy Rollins went 21-31 in 2009, despite an eight percent HR/FB (which honestly wasn’t that far below league average of ten percent back in 2009). In fact, it’s basically impossible to run a 20-20 season with a terrible HR/FB — only three seasons in history (that we have data for) have a HR/FB below 9.5 percent, and no 20-20 season has had more than 21 homers with a HR/FB below 10 percent. Amusingly, Jimmy Rollins had the last “substantially above 20 homers” season in this regard back in 2007, which he went 30-41 with HR/FB about a percent higher than league average. Basically, if you want to get to 20-20, you can’t actually get wrecked by HR/FB; you just won’t get there if that happens.
Okay, but did it help?
FanGraphs tracks WPA going back to the 1970s; 43 of the 451 seasons have negative WPA and 31 have negative RE24. I don’t know how Randy Arozarena keeps making his way on here, but he had the worst season by WPA, with a -2.24 mark (that’s over four direct WPA-based losses in aggregate) despite the 20-20 season. Tim Anderson’s 2018 is the only other season with a WPA mark worse than -2.00.
Harris does clock in with the worst RE24 among all these seasons — however, FanGraphs’ RE24 has had some weirdness lately so I’m not sure that’s a definitive measure.
Baseball-Reference has cWPA, which is WPA adjusted for odds of winning a championship. Though Harris had a low WPA, his cWPA was barely negative. I didn’t check every single 20-20 season’s cWPA, but I did find that in 2008, Corey Hart went 20-23 for a 90-win Brewers team that barely made the playoffs (by a game over the Mets). Hart had just a 95 wRC+ and -1.33 WPA, given him a stunningly high -3.8% cWPA over the course of the season. It would require some archaeology to figure out exactly what happened there, but just glancing at his game log, he had three horrendous intra-divisional games in terms of WPA in the final ten days of play alone, so that’s probably it.
Worst clutch score for a 20-20 season? Yeah, it’s Arozarena’s 2024 again.
In conclusion, I don’t know how Randy Arozarena managed to have multiple 20-20 seasons with a bunch of different measures of “boy this was not a good 20-20 season” but he did. So, while Harris certainly had a notably bad 20-20 season, at least he’s not Arozarena. Or Corey Hart. Or Ruben Sierra.
Maybe he’ll go 30-30 next year, and then we won’t have to bother with an article about the worst 30-30 seasons, because I think it’s comparably much harder to have a bad 30-30 season.