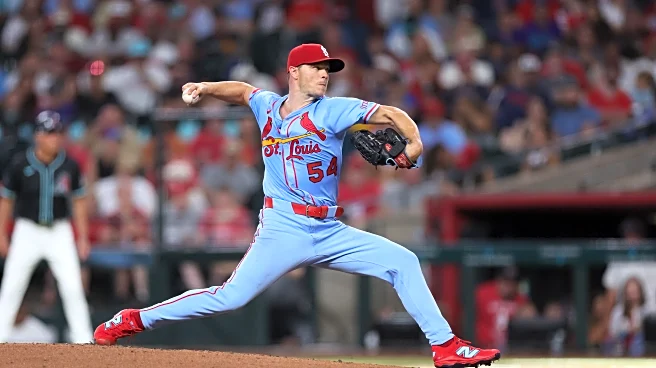
I have wanted to take a little closer look at Sonny Gray’s 2025 season. In looking at Sonny, I’m going to focus on his 3 most recent seasons, 2023 through the still incomplete 2025. I’m intent on capturing
his natural decline as he progresses through his mid-thirties. Looking and comparing how he was in his mid-twenties seems like folly compared to the pitcher he is now, so I ignore those years.
During my dive into his underlying stats, I developed an odd desire to see if I could make use of a statistic that has been around for a good while called the Game Score. This stat has always intrigued me, but I’ve never found any real tangible value to it. That should tell me something…More concisely, I will use Game Score, version 2, shown on Fangraphs Game Log. So, I will sprinkle it into the story and see if it can be useful. Just because…
Anyway, I’ll start with a prior piece of work on older pitcher declines (as measured in fWAR) and put Sonny in some context. This year is his age-35 season. There aren’t tons of these guys around, but they aren’t rare either. An average age-35 pitcher will be worth about 2 fWAR. From age-34 (last year) to age-35, the average pitcher experiences a decline of .3 fWAR. Last year, Sonny pitched to a 3.8 fWAR and it looks like he might get to 3.5 this year (I’m not good at predictions). Look at that. A drop of .3.
From age 35 to 36, on average you will expect to see about a .5 fWAR decline, if he pitches. About 20% of age-35 pitchers don’t make to 36. The others decline. Not a shock. Given average outcomes, Sonny would be reasonably expected to perform at a 3.0 fWAR rate next year, given health.
Apologies for the unattractive table layout (below). I’m still figuring out tables with the new WordPress platform. More work to do here, for sure.
So, we will dig a little deeper. My curiosity was tickled with his poor July outcomes. To start with, Sonny Gray is still a good pitcher. But age is catching up to him as it does everyone. How can we illuminate with statistics what we see with the eyes?
Well, about the HR rate. In bulk, his HRs allowed is pacing a bit above 2024. He has allowed 19 so far through August, as opposed to 21 all of last year. 2023 was clearly an outlier year with only 8 HR allowed.
However, while his bulk HRs aren’t up that much over last year, he is giving them up in quite a few less pitches. He is averaging 84 pitches per start in 2025, as opposed to 89 pitches in 2024 and 2023. Some of that is circumstantial, but you can see in the Game Log data that he rarely crosses 100 pitches anymore (only once since 8/6/24). An anecdote on the 8/6/24 start (106 pitches). He followed that up with his second-worst start of 2024 by Game Score (29). Keep that thought in mind.
The Game Score I’m looking at from Fangraphs uses a Game Score of 40 as the “average” (I think the original used 50). One of the remarkable things about Sonny Gray is his consistency … he rarely had starts under 40. In 2023, he had zero below average (40) starts. Last year, he had but four such starts, two of those were 37 and 38. This year, he has had six below average starts, and they’ve all been WELL below average, with one game score bottoming out at 9 and another at 4!
We can begin to see what I view as normal signs of decline across 3 years. Not falling off the cliff stuff, but more steady decline. Less innings, less pitches (ie. less stamina), more mistakes (in HR, anyway) and more starts that are uncompetitive. The “bad” numbers are still within the range of an MLB starter, just not the top flight talent. For a random comparison, his six really bad starts (by GS) are the same as Andre Pallante.
His overall average GameScore per season has declined over the 3-year period from 59.3 -> 57 -> 53.3. Not off the cliff, but you can see decline. Again, random comparison…that 53.3 average GS is about 15% better than Pallante, who dials in around 47.
One interesting facet of his Game Scores that has caught my eye. There aren’t a lot of really bad starts over the 3 years (all are in 2026, unfortunately). Too small to draw too many conclusions, but the eye notices that the bad starts have a habit of following changes in his schedule. For instance, this year, the Cardinals were starting him regularly every 6th day like a metronome and the results were generally pretty good. Then in July, they reduced that to every fifth day in three out of five starts. Anyone remember how July went? In that mix, he had the worst start in 3 years (GS=4, which I didn’t think possible).
Curiously (again, with small numbers) you see the same phenomenon when they bump his schedule to a seventh day … a bad start usually follows, even with the extra rest. His second worst start of 2024 followed a 7-day break. His second worst start of 2025 followed a 7-day break (GS=9). Schedule deviations don’t seem to be friendly to his outcomes. The Cardinals have only extended his schedule 5 times and the results have been decidedly mixed, at best. Looking back at 2023 when he was with Minnesota, his two worst starts came following extra rest. Small samples, for sure. Perhaps it’s just interesting anecdote, but it does catch the eye.
From a different statistical view, his WAR over the last three years shows decline, also: 5.4 -> 3.8 -> 3.1 (although 2025 is not done, he is unlikely to touch that 3.8 from last year). Normal decline? His FIPs are increasing over his last 3 years: 2.83 -> 3.12 -> 3.27. Not the elite pitcher he used to be, but I wouldn’t mind a rotation of pitchers with a 3.27 FIP, to be sure.
Remember from earlier work, pitchers in their mid-thirties tend to gradually and steadily decline or they fall off the face of the earth (usually not playing due to injury). So far, he has been blessedly free from injury and I hope that remains this way. I suspect that next year his projections will be FIP around 3.50, WAR around or just under 3.0. He will likely need a bit more schedule management (less innings, less pitches), so his good starts will tax the bullpen a bit more.
Some will say .. that isn’t the picture of a $35m pitcher. Perhaps, not. But we need to remember that the Cardinals signed him to a $25m/year AAV (and then shifted money out). Would you take a 1 year $25m contract for a 3.5 FIP, 3.0 WAR pitchers with good injury history for next year?
From a Statcast point of view, we see some changes in his recent pitching profile. Below is his Statcast ratings for the current, unfinished season.

Now we see the 2024 version of same. I see some decline in his FB velo, 92.5 to 91.9. Some of his percentile rating may be due to everyone else’s velo going up. Not a lot different, just a little bit of decline is how it looks to me. Interestingly, his FRV was worse than 2025. I notice that his FRV has varied a bit over his career. I have no idea why. His BRV has be consistently elite year-in, year-out.

Here is his 2023 season with the Twins in his age-33 season. He had a markedly higher fWAR this season, but his slider bars wouldn’t seem to support that, with lower whiff and K rates. One thing I think I see over the 3 seasons is he has become more of a flyball pitcher. Whereas groundball pitchers sometimes get BABIPed to death, flyball pitchers sometimes get poor HR/Flyball rates and their fWAR suffers.

So, it’s late Friday night and it has been a week full of fires and other adventures, so I’m out of time with my deeper dive into Sonny Gray. While those really poor starts with Game Scores less than 10 have gotten my attention, I think I am satisfied that Sonny Gray is still a good pitcher and is more likely than not to be a good one next year.
There is some rumbling, at least among the fanbase that Sonny’s contract should be moved this off-season, if he will waive his NTC (doubtful, but possible). Here is how I see this: I think a team might see him as a 3.0 fWAR pitcher next year, with normal injury risk. His contract next year is $35m. $35m is a bit much for 3.0 fWAR, so they would likely view contract as under water by about $10m-$12m. The Cardinals would need to kick in at least that much to get a 40 FV prospect back. They’d need to kick in another $10m or so to get a 50 FV value prospect back. On top of that, they don’t really have their own pitching depth to replace him, so they’d have to sign someone to pitch those innings, which would cost between $5m-$10m on a one-year deal for someone like Colin Rea. Between you, me and the fence post, I think they are better off keeping him for the $35m. One 40 FV player isn’t going to change this franchise’s direction and any $$ savings to re-invest elsewhere are going to be minimal at best. I could see them making a trade i foffered a 50 FV player (hopefully not a catcher or middle infielder), but I don’t see them kicking up $20m-$25m in cash back to the other team to make that deal happen.
That’s my take. Discuss.
