


So close! For much of this game, I felt like the Spurs were firmly in control; the point differential never got huge by modern NBA standards, but until the end of the third quarter it always felt like San Antonio was going to have enough to counter what Denver was brining to the table. As things tightened in the final minutes of regulation, both teams put together some impressive play; however, the Spurs made a couple of key errors, and in the end the Nuggets managed to convert small but critical
advantages into their 50th win of the season.
From a strategic perspective, this loss likely means that San Antonio’s dreams of the one seed have faded away, unless OKC truly collapses in this final stretch. However, given the sudden injuries to the Lakers’ roster (which, as a diehard fan of the game, I truly hate), being the second seed may actually produce an easier path to the conference finals (conditional on Denver not catching Los Angeles for the three seed). In any case, here are some key highlights from yesterday’s scintillating contest:

- This was a very low turnover game, with the Spurs (11) and Nuggets (6) combining for just 17 turnovers. Since the start of 2012-2013, only 2.65% (446 of 16,829) of regular season contests have had a turnover total at least that low. Unfortunately, the differential still strongly favored Denver, in that they had five less. This disadvantage transferred offensive opportunity from San Antonio to the Nuggets, mostly negating the advantage the Spurs built in TRB (+6) and ORB (+4).
- Although both teams recorded exactly 22 fouls, the Spurs did a better job managing the type and timing of their fouls, which helped give the Silver and Black a +5 edge in FTA. Furthermore, the Spurs earned a slightly higher FT% (+6.23 percentage points), which translated to a FTM margin of +6 for San Antonio.
- Unfortunately for the Spurs, their six-point edge at the charity stripe was not quite enough to overcome Denver’s advantages from the field. Two major factors were at play here: First, the Nuggets had a slightly better FG% than San Antonio (+1.98 percentage points). Typically, a margin this small would not mean much, but because both teams took 101 shots it translated to a +2 FGM margin for Denver.
- In addition, the Nuggets had a notably better 3P% (+7.97 percentage points), which allowed them to produce a 3PM margin of +4. The net result of all of this is that Denver outscored San Antonio by eight from the field.
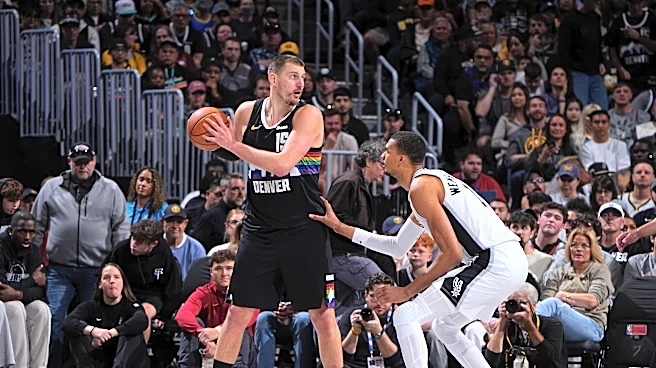
- While this isn’t covered in the graded box score, both Wemby and Joker put together insane stat lines yesterday. For example, Victor became just the second player since the start of 1996-1997 to record a line including 34+ points, 18+ rebounds, 7+ assists, and 5+ blocks in the regular season. The first was Karl-Anthony Towns, in a December 30, 2018 game between the Timberwolves and Heat.
- Similarly, Jokic became just the second player during the same period to record a regular season box score line including 40+ points, 8+ rebounds, 13+ assists, and 3+ blocks. The other player is LeBron James, who did so in a February 18, 2010 contest between the Cavs and Nuggets.
What are Team Graded Box Scores?
Very briefly, these box scores grade winner-loser differentials for basic box score statistics, with the grade being based on the winning team’s differential relative to other NBA winners during a defined reference period. Think of it like a report card for understanding how a given winner performed relative to other winners. The reference period used runs from the start of the 2012-2013 season to the latest date of play, including only games in the same season category (i.e., regular season and playoff games are not compared to each other).
Data Source: The underlying data used to create these box scores was collected from Basketball Reference. In all cases, the data are collected the morning after the game is played. Although rare, postgame statistical revisions after data collection do occur and may affect the results after the fact.