Trey Hendrickson led the league in sacks, but sacks are over-hyped. Pressures are the truest measure of a pass rusher’s effectiveness. Elite pass rushers may go games without a sack, but they rarely get shut-out – have a game with zero pressures.
So first let’s talk about a QB pressure. A pressure is when a rusher gets close enough to a QB to effect the QB without actually hitting the QB. A QBhit is a pressure. A QB knockdown is a pressure and a QBhit. A sack puts a check in all four boxes. Unfortunately,
different sites credit pressures differently since they are the most subjective of the pass rush stats.
SISdatahub.com is much more free with pressures. Trey Hendrickson led the league in pressures according to SIS (85) and pro-football-reference.com (54). The player who got screwed over the most by PFR was Jared Verse. Sis credited him with 39 more QB pressures than PFR did. Seven other guys were shorted 30 or more pressures by PFR. See the table below (PRSS SIS – PFR)
Pass Rusher | POS | Team | Games | Rushes | Pass Rushes/Game | Rush% | Sacks | Pressures | PRSS SIS – PFR | Pressures/Game | Press% |
---|---|---|---|---|---|---|---|---|---|---|---|
Jared Verse | DE | Rams | 17 | 449 | 26.4 | 93.7 | 4.5 | 72 | 39 | 4.24 | 16.04% |
Maxx Crosby | DE | Raiders | 12 | 419 | 34.9 | 95.7 | 7.5 | 68 | 33 | 5.67 | 16.23% |
Will McDonald | DE | Jets | 17 | 410 | 24.1 | 94.5 | 10.5 | 70 | 32 | 4.12 | 17.07% |
Josh Sweat | LB | Eagles | 16 | 378 | 23.6 | 91.5 | 8.0 | 48 | 32 | 3.00 | 12.70% |
Trey Hendrickson | DE | Bengals | 17 | 476 | 28.0 | 92.6 | 17.5 | 85 | 31 | 5.00 | 17.86% |
Yaya Diaby | DE | Buccaneers | 17 | 421 | 24.8 | 82.2 | 4.5 | 63 | 31 | 3.71 | 14.96% |
T.J. Watt | DE | Steelers | 17 | 527 | 31.0 | 94.3 | 11.5 | 61 | 30 | 3.59 | 11.57% |
Nnamdi Madubuike | DT | Ravens | 17 | 509 | 29.9 | 97.9 | 6.5 | 51 | 30 | 3.00 | 10.02% |
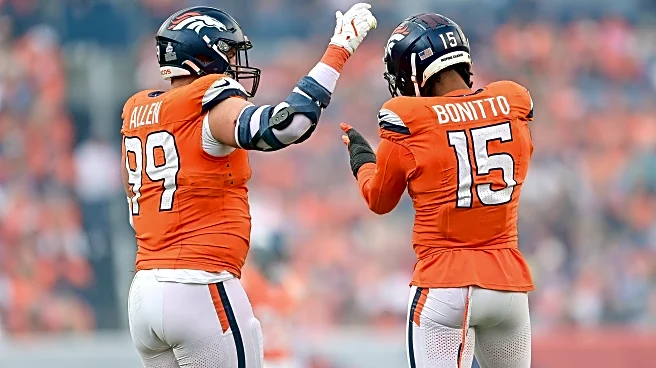
If you read my work, you know I like rate stats. So I figured pressures per game for both sites (min 20 pressures on SIS). Looking at it this way we can see the most effective pass rushers and the least effective pass rushers (on a per game basis, not on a per rush basis). This really only works for comparing guys whose job it is to primarily rush the passer (>85% pass rush). If you rank guys by pressures per game, you have to get to the 39th ranked player (Nik Bonitto) to find a player who dropped into coverage more than 15% of the time. Bonitto only rushed 83.2% of the time on passing downs that he played.
Nik’s sack to pressure rate (SIS) was the 3rd best among heavy pass rushers (min 100 rushes and 20 pressures) at 28.1%. Only Dexter Lawrence (34.6%) and Patrick Jones II (29.2%) were higher. On the other end of the spectrum two pass rushers had a 0% conversion rate (sacks/pressures). Myles Murphy and Moro Ojomo both had zero sacks and more than 20 pressures (23 and 26).
Pass Rusher | POS | Team | Games | Rushes | Pass Rushes/Game | Rush% | Sacks | Pressures | Pressures/Game | Sack/Prss | Press% | |||||||||||
---|---|---|---|---|---|---|---|---|---|---|---|---|---|---|---|---|---|---|---|---|---|---|
Aidan Hutchinson | DE | Lions | 5 | 177 | 35.4 | 96.7 | 7.5 | 38 | 7.60 | 19.7% | 21.47% | |||||||||||
Maxx Crosby | DE | Raiders | 12 | 419 | 34.9 | 95.7 | 7.5 | 68 | 5.67 | 11.0% | 16.23% | |||||||||||
Micah Parsons | DE | Cowboys | 13 | 387 | 29.8 | 93.0 | 12.0 | 70 | 5.38 | 17.1% | 18.09% | |||||||||||
Trey Hendrickson | DE | Bengals | 17 | 476 | 28.0 | 92.6 | 17.5 | 85 | 5.00 | 20.6% | 17.86% | |||||||||||
Alex Highsmith | LB | Steelers | 11 | 273 | 24.8 | 90.4 | 6.0 | 49 | 4.45 | 12.2% | 17.95% | |||||||||||
Zach Allen | DE | Broncos | 16 | 586 | 36.6 | 98.2 | 8.5 | 69 | 4.31 | 12.3% | 11.77% | |||||||||||
Jared Verse | DE | Rams | 17 | 449 | 26.4 | 93.7 | 4.5 | 72 | 4.24 | 6.3% | 16.04% | |||||||||||
Will McDonald | DE | Jets | 17 | 410 | 24.1 | 94.5 | 10.5 | 70 | 4.12 | 15.0% | 17.07% | |||||||||||
Nick Bosa | DE | 49ers | 14 | 397 | 28.4 | 98.3 | 9.0 | 57 | 4.07 | 15.8% | 14.36% | |||||||||||
Chris Jones | DT | Chiefs | 15 | 506 | 33.7 | 99.2 | 5.0 | 61 | 4.07 | 8.2% | 12.06% | |||||||||||
Myles Garrett | DE | Browns | 17 | 445 | 26.2 | 95.9 | 14.0 | 69 | 4.06 | 20.3% | 15.51% | |||||||||||
Jonathan Greenard | DE | Vikings | 17 | 502 | 29.5 | 86.0 | 12.0 | 68 | 4.00 | 17.6% | 13.55% | |||||||||||
Brian Burns | LB | Giants | 17 | 432 | 25.4 | 90.8 | 8.5 | 63 | 3.71 | 13.5% | 14.58% | |||||||||||
Yaya Diaby | DE | Buccaneers | 17 | 421 | 24.8 | 82.2 | 4.5 | 63 | 3.71 | 7.1% | 14.96% | |||||||||||
Gregory Rousseau | DE | Bills | 16 | 436 | 27.3 | 95.8 | 8.0 | 58 | 3.63 | 13.8% | 13.30% | |||||||||||
T.J. Watt | DE | Steelers | 17 | 527 | 31.0 | 94.3 | 11.5 | 61 | 3.59 | 18.9% | 11.57% | |||||||||||
Osa Odighizuwa | DT | Cowboys | 17 | 483 | 28.4 | 99.6 | 4.5 | 61 | 3.59 | 7.4% | 12.63% | |||||||||||
George Karlaftis III | DE | Chiefs | 16 | 511 | 31.9 | 95.3 | 8.0 | 54 | 3.38 | 14.8% | 10.57% | |||||||||||
Danielle Hunter | LB | Texans | 17 | 469 | 27.6 | 98.5 | 12.0 | 57 | 3.35 | 21.1% | 12.15% | |||||||||||
Carl Granderson | DE | Saints | 17 | 481 | 28.3 | 94.1 | 5.5 | 57 | 3.35 | 9.6% | 11.85% | |||||||||||
Boye Mafe | LB | Seahawks | 15 | 314 | 20.9 | 83.3 | 6.0 | 49 | 3.27 | 12.2% | 15.61% | |||||||||||
Calijah Kancey | DT | Buccaneers | 12 | 351 | 29.3 | 97.2 | 7.5 | 39 | 3.25 | 19.2% | 11.11% | |||||||||||
Josh Hines-Allen | DE | Jaguars | 16 | 436 | 27.3 | 94.8 | 8.0 | 52 | 3.25 | 15.4% | 11.93% | |||||||||||
Kayvon Thibodeaux | DE | Giants | 12 | 328 | 27.3 | 97.0 | 5.5 | 39 | 3.25 | 14.1% | 11.89% | |||||||||||
Travon Walker | DE | Jaguars | 17 | 506 | 29.8 | 97.5 | 10.5 | 55 | 3.24 | 19.1% | 10.87% | |||||||||||
Kyle Van Noy | LB | Ravens | 16 | 367 | 22.9 | 85.7 | 12.5 | 51 | 3.19 | 24.5% | 13.90% | |||||||||||
Jonathon Cooper | LB | Broncos | 17 | 424 | 24.9 | 85.1 | 10.5 | 53 | 3.12 | 19.8% | 12.50% | |||||||||||
Chase Young | DE | Saints | 17 | 445 | 26.2 | 95.5 | 5.5 | 53 | 3.12 | 10.4% | 11.91% | |||||||||||
Will Anderson | DE | Texans | 14 | 341 | 24.4 | 97.2 | 11.0 | 43 | 3.07 | 25.6% | 12.61% | |||||||||||
Leonard Williams | DE | Seahawks | 16 | 442 | 27.6 | 96.3 | 11.0 | 48 | 3.00 | 22.9% | 10.86% | |||||||||||
Josh Sweat | LB | Eagles | 16 | 378 | 23.6 | 91.5 | 8.0 | 48 | 3.00 | 16.7% | 12.70% | |||||||||||
Nnamdi Madubuike | DT | Ravens | 17 | 509 | 29.9 | 97.9 | 6.5 | 51 | 3.00 | 12.7% | 10.02% | |||||||||||
Keion White | DE | Patriots | 17 | 391 | 23.0 | 86.5 | 5.0 | 50 | 2.94 | 10.0% | 12.79% | |||||||||||
Jalen Carter | DT | Eagles | 16 | 504 | 31.5 | 99.2 | 4.5 | 47 | 2.94 | 9.6% | 9.33% | |||||||||||
Khalil Mack | LB | Chargers | 16 | 354 | 22.1 | 95.7 | 6.0 | 46 | 2.88 | 13.0% | 12.99% | |||||||||||
Quinnen Williams | DT | Jets | 16 | 403 | 25.2 | 98.1 | 6.0 | 46 | 2.88 | 13.0% | 11.41% | |||||||||||
Zach Sieler | DT | Dolphins | 15 | 443 | 29.5 | 97.1 | 10.0 | 43 | 2.87 | 23.3% | 9.71% | |||||||||||
Nik Bonitto | LB | Broncos | 17 | 367 | 21.6 | 83.2 | 13.5 | 48 | 2.82 | 28.1% | 13.08% | |||||||||||
Jadeveon Clowney | LB | Panthers | 14 | 317 | 22.6 | 87.1 | 5.5 | 39 | 2.79 | 14.1% | 12.30% | |||||||||||
Cameron Heyward | DT | Steelers | 17 | 445 | 26.2 | 100.0 | 8.0 | 47 | 2.76 | 17.0% | 10.56% | |||||||||||
Chop Robinson | DE | Dolphins | 17 | 322 | 18.9 | 87.3 | 6.0 | 47 | 2.76 | 12.8% | 14.60% | |||||||||||
Dayo Odeyingbo | DE | Colts | 17 | 413 | 24.3 | 98.8 | 3.0 | 47 | 2.76 | 6.4% | 11.38% | |||||||||||
John Franklin-Myers | DE | Broncos | 17 | 347 | 20.4 | 98.6 | 7.0 | 46 | 2.71 | 15.2% | 13.26% | |||||||||||
DeForest Buckner | DT | Colts | 12 | 316 | 26.3 | 100.0 | 6.5 | 32 | 2.67 | 20.3% | 10.13% | |||||||||||
Andrew Van Ginkel | LB | Vikings | 17 | 376 | 22.1 | 64.8 | 11.5 | 45 | 2.65 | 25.6% | 11.97% | |||||||||||
Braden Fiske | DT | Rams | 17 | 402 | 23.6 | 99.0 | 8.5 | 45 | 2.65 | 18.9% | 11.19% | |||||||||||
Rashan Gary | DE | Packers | 17 | 391 | 23.0 | 99.2 | 7.5 | 45 | 2.65 | 16.7% | 11.51% | |||||||||||
Montez Sweat | DE | Bears | 16 | 339 | 21.2 | 97.1 | 5.5 | 42 | 2.63 | 13.1% | 12.39% | |||||||||||
Odafe Oweh | LB | Ravens | 17 | 403 | 23.7 | 92.6 | 10.0 | 44 | 2.59 | 22.7% | 10.92% | |||||||||||
Derick Hall | LB | Seahawks | 17 | 345 | 20.3 | 89.6 | 8.0 | 44 | 2.59 | 18.2% | 12.75% | |||||||||||
Vita Vea | DT | Buccaneers | 16 | 442 | 27.6 | 97.6 | 7.0 | 41 | 2.56 | 17.1% | 9.28% | |||||||||||
Dorance Armstrong Jr. | DE | Commanders | 16 | 343 | 21.4 | 95.8 | 5.0 | 41 | 2.56 | 12.2% | 11.95% | |||||||||||
Kwity Paye | DE | Colts | 15 | 360 | 24.0 | 97.0 | 8.0 | 38 | 2.53 | 21.1% | 10.56% | |||||||||||
DeMarcus Walker | DE | Bears | 17 | 392 | 23.1 | 96.8 | 3.5 | 43 | 2.53 | 8.1% | 10.97% | |||||||||||
D.J. Wonnum | LB | Panthers | 8 | 213 | 26.6 | 86.2 | 4.0 | 20 | 2.50 | 20.0% | 9.39% | |||||||||||
Arden Key | DE | Titans | 16 | 373 | 23.3 | 93.7 | 6.5 | 40 | 2.50 | 16.3% | 10.72% | |||||||||||
Joey Bosa | DE | Chargers | 14 | 294 | 21.0 | 98.3 | 5.0 | 35 | 2.50 | 14.3% | 11.90% | |||||||||||
Jeffery Simmons | DT | Titans | 16 | 421 | 26.3 | 96.6 | 5.0 | 40 | 2.50 | 12.5% | 9.50% | |||||||||||
Michael Hall | DT | Browns | 8 | 152 | 19.0 | 96.2 | 1.0 | 20 | 2.50 | 5.0% | 13.16% | |||||||||||
Leonard Floyd | DE | 49ers | 17 | 355 | 20.9 | 97.8 | 8.5 | 42 | 2.47 | 20.2% | 11.83% | |||||||||||
Dre’Mont Jones | DE | Seahawks | 17 | 346 | 20.4 | 96.1 | 4.0 | 42 | 2.47 | 9.5% | 12.14% | |||||||||||
Al-Quadin Muhammad | DE | Lions | 9 | 151 | 16.8 | 95.0 | 3.0 | 22 | 2.44 | 13.6% | 14.57% | |||||||||||
Emmanuel Ogbah | DE | Dolphins | 16 | 385 | 24.1 | 88.1 | 5.0 | 39 | 2.44 | 12.8% | 10.13% | |||||||||||
Kobie Turner | DT | Rams | 17 | 486 | 28.6 | 99.6 | 8.0 | 41 | 2.41 | 19.5% | 8.44% | |||||||||||
Nick Herbig | LB | Steelers | 13 | 200 | 15.4 | 83.7 | 5.5 | 31 | 2.38 | 17.7% | 15.50% | |||||||||||
Dante Fowler | DE | Commanders | 17 | 303 | 17.8 | 91.3 | 10.5 | 40 | 2.35 | 26.3% | 13.20% | |||||||||||
Maliek Collins | DT | 49ers | 17 | 413 | 24.3 | 99.5 | 5.0 | 40 | 2.35 | 12.5% | 9.69% | |||||||||||
B.J. Hill | DT | Bengals | 15 | 399 | 26.6 | 98.0 | 3.0 | 35 | 2.33 | 8.6% | 8.77% | |||||||||||
Blake Cashman | LB | Vikings | 14 | 155 | 11.1 | 26.8 | 4.5 | 31 | 2.21 | 14.5% | 20.00% | |||||||||||
K’Lavon Chaisson | DE | Raiders | 15 | 281 | 18.7 | 86.2 | 5.0 | 33 | 2.20 | 15.2% | 11.74% | |||||||||||
Joseph Ossai | DE | Bengals | 17 | 319 | 18.8 | 90.6 | 5.0 | 37 | 2.18 | 13.5% | 11.60% | |||||||||||
Dexter Lawrence | DT | Giants | 12 | 311 | 25.9 | 99.4 | 9.0 | 26 | 2.17 | 34.6% | 8.36% | |||||||||||
Alim McNeill | DT | Lions | 14 | 392 | 28.0 | 97.5 | 3.5 | 30 | 2.14 | 11.7% | 7.65% | |||||||||||
Ed Oliver | DT | Bills | 14 | 365 | 26.1 | 98.1 | 3.0 | 30 | 2.14 | 10.0% | 8.22% | |||||||||||
Carl Lawson | DE | Cowboys | 15 | 274 | 18.3 | 95.5 | 5.0 | 32 | 2.13 | 15.6% | 11.68% | |||||||||||
Gervon Dexter | DT | Bears | 15 | 336 | 22.4 | 98.8 | 5.0 | 32 | 2.13 | 15.6% | 9.52% | |||||||||||
Levi Onwuzurike | DT | Lions | 16 | 379 | 23.7 | 97.9 | 1.5 | 34 | 2.13 | 4.4% | 8.97% | |||||||||||
Tuli Tuipulotu | LB | Chargers | 17 | 361 | 21.2 | 83.4 | 8.5 | 36 | 2.12 | 23.6% | 9.97% | |||||||||||
Byron Young | LB | Rams | 17 | 336 | 19.8 | 70.3 | 7.5 | 36 | 2.12 | 20.8% | 10.71% | |||||||||||
Calais Campbell | DE | Dolphins | 17 | 374 | 22.0 | 95.9 | 5.0 | 36 | 2.12 | 13.9% | 9.63% | |||||||||||
Jarran Reed | DT | Seahawks | 17 | 369 | 21.7 | 94.6 | 4.5 | 36 | 2.12 | 12.5% | 9.76% | |||||||||||
Laiatu Latu | DE | Colts | 17 | 353 | 20.8 | 97.2 | 4.0 | 36 | 2.12 | 11.1% | 10.20% | |||||||||||
Azeez Ojulari | LB | Giants | 11 | 187 | 17.0 | 96.4 | 6.0 | 23 | 2.09 | 26.1% | 12.30% | |||||||||||
Nolan Smith | LB | Eagles | 16 | 260 | 16.3 | 86.7 | 6.5 | 33 | 2.06 | 19.7% | 12.69% | |||||||||||
Bryan Bresee | DT | Saints | 17 | 439 | 25.8 | 98.9 | 7.5 | 35 | 2.06 | 21.4% | 7.97% | |||||||||||
Arnold Ebiketie | LB | Falcons | 17 | 315 | 18.5 | 85.4 | 6.0 | 35 | 2.06 | 17.1% | 11.11% | |||||||||||
Tershawn Wharton | DT | Chiefs | 17 | 423 | 24.9 | 97.2 | 6.5 | 34 | 2.00 | 19.1% | 8.04% | |||||||||||
Kaden Elliss | LB | Falcons | 17 | 149 | 8.8 | 23.4 | 5.0 | 34 | 2.00 | 14.7% | 22.82% | |||||||||||
Haason Reddick | LB | Jets | 10 | 222 | 22.2 | 92.1 | 1.0 | 20 | 2.00 | 5.0% | 9.01% | |||||||||||
Harold Landry | DE | Titans | 17 | 387 | 22.8 | 81.3 | 9.0 | 33 | 1.94 | 27.3% | 8.53% | |||||||||||
Chauncey Golston | DE | Cowboys | 17 | 429 | 25.2 | 98.6 | 5.5 | 33 | 1.94 | 16.7% | 7.69% | |||||||||||
Milton Williams | DT | Eagles | 17 | 280 | 16.5 | 99.3 | 5.0 | 33 | 1.94 | 15.2% | 11.79% | |||||||||||
Zaven Collins | LB | Cardinals | 17 | 281 | 16.5 | 77.6 | 5.0 | 33 | 1.94 | 15.2% | 11.74% | |||||||||||
Tyree Wilson | DE | Raiders | 16 | 313 | 19.6 | 95.1 | 4.5 | 31 | 1.94 | 14.5% | 9.90% | |||||||||||
Devonte Wyatt | DT | Packers | 14 | 236 | 16.9 | 97.1 | 5.0 | 27 | 1.93 | 18.5% | 11.44% | |||||||||||
Von Miller | DE | Bills | 13 | 196 | 15.1 | 95.1 | 6.0 | 25 | 1.92 | 24.0% | 12.76% | |||||||||||
Za’Darius Smith | LB | Lions | 17 | 203 | 11.9 | 97.1 | 4.0 | 32 | 1.88 | 12.5% | 15.76% | |||||||||||
Arik Armstead | DT | Jaguars | 17 | 353 | 20.8 | 99.2 | 2.0 | 32 | 1.88 | 6.3% | 9.07% | |||||||||||
Jihad Ward | LB | Vikings | 17 | 372 | 21.9 | 97.9 | 1.0 | 32 | 1.88 | 3.1% | 8.60% | |||||||||||
Dalvin Tomlinson | DT | Browns | 16 | 299 | 18.7 | 98.0 | 3.0 | 30 | 1.88 | 10.0% | 10.03% | |||||||||||
Bryce Huff | DE | Eagles | 12 | 171 | 14.3 | 96.6 | 2.5 | 22 | 1.83 | 11.4% | 12.87% | |||||||||||
Anthony Nelson | DE | Buccaneers | 17 | 267 | 15.7 | 74.2 | 4.0 | 31 | 1.82 | 12.9% | 11.61% | |||||||||||
Mario Edwards | DE | Texans | 13 | 289 | 22.2 | 100.0 | 3.0 | 23 | 1.77 | 13.0% | 7.96% | |||||||||||
Myles Murphy | DE | Bengals | 13 | 202 | 15.5 | 90.6 | 0.0 | 23 | 1.77 | 0.0% | 11.39% | |||||||||||
Frankie Luvu | LB | Commanders | 17 | 204 | 12.0 | 36.8 | 8.0 | 30 | 1.76 | 26.7% | 14.71% | |||||||||||
Grady Jarrett | DT | Falcons | 17 | 430 | 25.3 | 98.2 | 2.5 | 30 | 1.76 | 8.3% | 6.98% | |||||||||||
Dondrea Tillman | LB | Broncos | 12 | 141 | 11.8 | 92.8 | 5.0 | 21 | 1.75 | 23.8% | 14.89% | |||||||||||
Josh Paschal | DE | Lions | 14 | 333 | 23.8 | 96.0 | 2.0 | 24 | 1.71 | 8.3% | 7.21% | |||||||||||
Anfernee Jennings | LB | Patriots | 16 | 317 | 19.8 | 79.6 | 2.5 | 27 | 1.69 | 9.3% | 8.52% | |||||||||||
Jacob Martin | DE | Bears | 11 | 116 | 10.5 | 92.1 | 3.0 | 18 | 1.64 | 16.7% | 15.52% | |||||||||||
Patrick Jones II | LB | Vikings | 15 | 298 | 19.9 | 91.1 | 7.0 | 24 | 1.60 | 29.2% | 8.05% | |||||||||||
Tim Settle | DT | Texans | 17 | 377 | 22.2 | 99.7 | 5.0 | 27 | 1.59 | 18.5% | 7.16% | |||||||||||
Daron Payne | DT | Commanders | 17 | 407 | 23.9 | 99.8 | 4.0 | 27 | 1.59 | 14.8% | 6.63% | |||||||||||
Morgan Fox | DE | Chargers | 17 | 353 | 20.8 | 97.5 | 3.5 | 27 | 1.59 | 13.0% | 7.65% | |||||||||||
Baron Browning | LB | Cardinals | 13 | 128 | 9.8 | 82.6 | 2.0 | 20 | 1.54 | 10.0% | 15.63% | |||||||||||
Javon Kinlaw | DT | Jets | 17 | 359 | 21.1 | 99.4 | 4.5 | 26 | 1.53 | 17.3% | 7.24% | |||||||||||
Michael Hoecht | LB | Rams | 17 | 208 | 12.2 | 60.5 | 3.0 | 26 | 1.53 | 11.5% | 12.50% | |||||||||||
Moro Ojomo | DT | Eagles | 17 | 251 | 14.8 | 100.0 | 0.0 | 26 | 1.53 | 0.0% | 10.36% | |||||||||||
Darrell Taylor | DE | Bears | 16 | 216 | 13.5 | 93.5 | 3.0 | 24 | 1.50 | 12.5% | 11.11% | |||||||||||
Bud Dupree | LB | Chargers | 17 | 323 | 19.0 | 93.4 | 6.0 | 25 | 1.47 | 24.0% | 7.74% | |||||||||||
Adam Butler | DT | Raiders | 17 | 476 | 28.0 | 93.0 | 5.0 | 25 | 1.47 | 20.0% | 5.25% | |||||||||||
Travis Jones | DT | Ravens | 17 | 359 | 21.1 | 98.9 | 1.0 | 25 | 1.47 | 4.0% | 6.96% | |||||||||||
Deatrich Wise Jr. | DT | Patriots | 15 | 245 | 16.3 | 99.2 | 5.0 | 22 | 1.47 | 22.7% | 8.98% | |||||||||||
Joe Tryon-Shoyinka | LB | Buccaneers | 15 | 261 | 17.4 | 75.4 | 2.0 | 22 | 1.47 | 9.1% | 8.43% | |||||||||||
Solomon Thomas | DT | Jets | 16 | 241 | 15.1 | 99.6 | 3.5 | 23 | 1.44 | 15.2% | 9.54% | |||||||||||
Kingsley Enagbare | DE | Packers | 17 | 274 | 16.1 | 89.8 | 4.5 | 24 | 1.41 | 18.8% | 8.76% | |||||||||||
Micheal Clemons | DE | Jets | 17 | 298 | 17.5 | 97.7 | 4.5 | 24 | 1.41 | 18.8% | 8.05% | |||||||||||
Cameron Jordan | DE | Saints | 17 | 324 | 19.1 | 96.4 | 4.0 | 24 | 1.41 | 16.7% | 7.41% | |||||||||||
Kyzir White | LB | Cardinals | 17 | 99 | 5.8 | 16.8 | 2.5 | 24 | 1.41 | 10.4% | 24.24% | |||||||||||
Ogbo Okoronkwo | DE | Browns | 16 | 260 | 16.3 | 96.3 | 3.0 | 22 | 1.38 | 13.6% | 8.46% | |||||||||||
Za’Darius Smith | LB | Browns | 17 | 194 | 11.4 | 96.5 | 5.0 | 23 | 1.35 | 21.7% | 11.86% | |||||||||||
Derek Barnett | DE | Texans | 16 | 205 | 12.8 | 99.5 | 5.0 | 21 | 1.31 | 23.8% | 10.24% | |||||||||||
A.J. Epenesa | DE | Bills | 17 | 334 | 19.6 | 96.3 | 6.0 | 22 | 1.29 | 27.3% | 6.59% | |||||||||||
A’Shawn Robinson | DT | Panthers | 16 | 336 | 21.0 | 99.4 | 5.5 | 20 | 1.25 | 27.5% | 5.95% | |||||||||||
Sam Okuayinonu | DT | 49ers | 16 | 233 | 14.6 | 98.3 | 3.0 | 20 | 1.25 | 15.0% | 8.58% | |||||||||||
Karl Brooks | DT | Packers | 17 | 277 | 16.3 | 97.5 | 3.5 | 21 | 1.24 | 16.7% | 7.58% | |||||||||||
T’Vondre Sweat | DT | Titans | 17 | 328 | 19.3 | 96.2 | 1.0 | 21 | 1.24 | 4.8% | 6.40% | |||||||||||
Matt Judon | LB | Falcons | 17 | 303 | 17.8 | 77.7 | 5.5 | 20 | 1.18 | 27.5% | 6.60% | |||||||||||
Lavonte David | LB | Buccaneers | 17 | 135 | 7.9 | 19.8 | 5.5 | 20 | 1.18 | 27.5% | 14.81% | |||||||||||
Poona Ford | DT | Chargers | 17 | 326 | 19.2 | 99.4 | 3.0 | 20 | 1.18 | 15.0% | 6.13% | |||||||||||
Malcolm Roach | DT | Broncos | 17 | 253 | 14.9 | 97.7 | 2.5 | 20 | 1.18 | 12.5% | 7.91% | |||||||||||
Keeanu Benton | DT | Steelers | 17 | 344 | 20.2 | 99.4 | 1.0 | 20 | 1.18 | 5.0% | 5.81% | |||||||||||
Kenny Clark | DT | Packers | 17 | 394 | 23.2 | 98.7 | 1.0 | 20 | 1.18 | 5.0% | 5.08% |
Aidan Hutchinson was having a monster season before you got hurt last season. 7.60 pressures per game is insane! That’s almost two pressures better than Maxx Crosby who was second. When 4.o per game is elite, getting almost double that is amazing. Former DPOY TJ Watt only got 3.6 per game last season. So let’s talk about consistency.
How often do these rushers have huge games and how often do they get shut out. I’m going to use SIS since they show pressures in their game logs. Because this is time consuming and I have other things to do over Labor Day weekend, I only looked at pass rushers who were greater than 14.50% pressure rate (I polished the SIS data which can have some errors). I then plotted pressures per game for all 23 players who were better than 14.50% (plus Nik Bonitto and John Franklin-Myers).
There were only 28 games when one of these 23 rushers got shut-out and five of those belonged to Chop Robinson who was very boom and bust. He had 32 of his 47 pressures (SIS) over seven games. In the other nine games he had only 15 pressures. While Bonitto, JFM and Zach Allen did not get above 14.5% pressure rates last season (the only Bronco who did was Tillman), I added Nik and JFM to the chart below.

Of course with a player like Dondrea Tillman, you also have to look at how many pressures he didn’t get because another Bronco defender got there first. Unfortunately, no site shows team QB pressures per game (at least in front of a pay-wall) so we can’t see how often a particular player was the only defender to be able to get pressure in a game. That would be an interesting study for someone who has a subscription to PFF or another site that has that data. Notice the both Bonitto and JFM were fairly consistent in terms of pressures per game. Neither Bronco defender had more than six pressures in a game last season. Zach Allen had the most in any game for Denver last season with nine pressures (in the first loss to the Chargers).