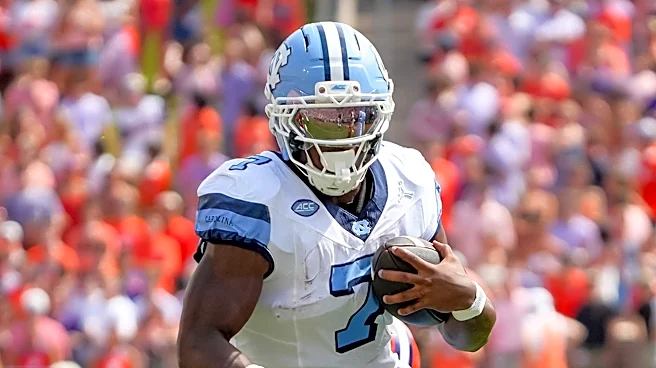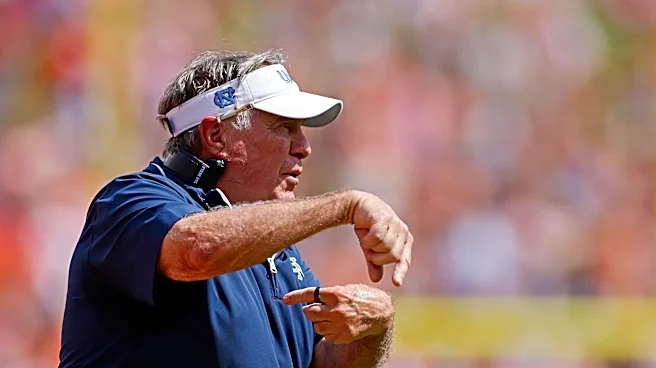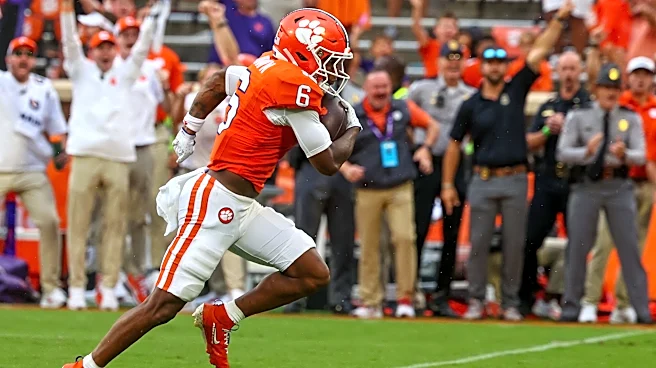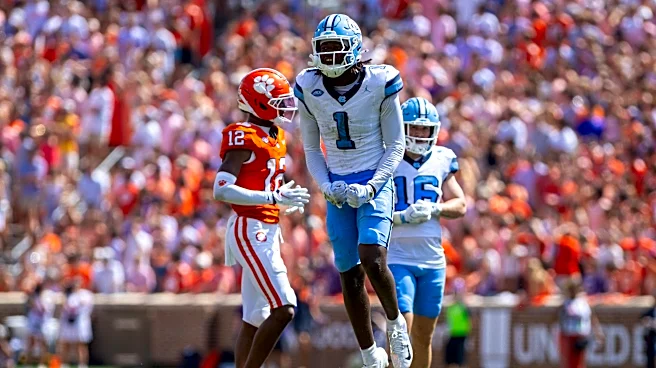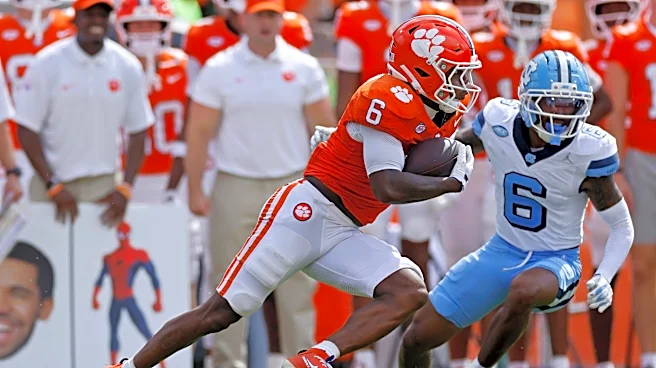





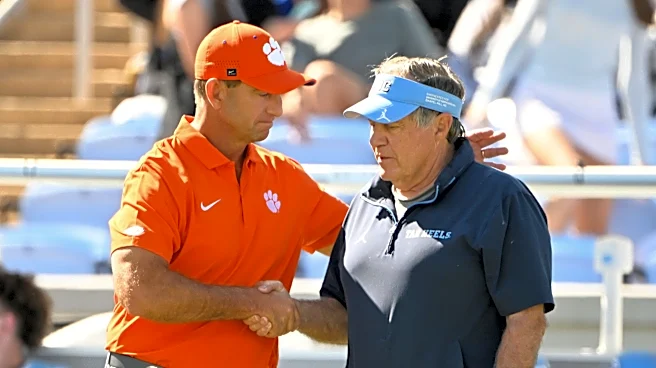
Clemson needed to get on track, and against North Carolina it finally found enough consistency to turn a slow start into a convincing second-half response. The Tigers were outplayed early, but the game changed after halftime as the offense found more success on the ground and through the air while the defense increasingly disrupted North Carolina’s passing game. That improvement matters, but the win also came with an important caveat: UNC’s quarterback struggled badly, particularly as the game progressed.
Clemson played a much better second half, but this was a combination of the Tigers improving and North Carolina failing to establish and sustain a passing game. The result was a needed win and a step forward, without necessarily answering every question raised by the first two games.
Clemson Offense — PFF: 65.9
Advanced Stats
- EPA/Play: +0.16
- Success Rate: 48%
- Yards/Play: 6.18
- 3rd Down Success: 38%
- Red Zone Success: 38%
- Explosive Play Rate: 9%
- Scrimmage Plays: 65
- Scrimmage Yards: 402
- Yards/Drive: 49.72
- Available Yards: 64%
Analytical Points
Game-Flow Split: The macro numbers mask a dramatic second-half turnaround. Clemson managed just 6 points before halftime, then exploded for 22 points in the second half.
Explosiveness vs. Down-to-Down Consistency: The biggest difference was efficiency and explosiveness. Clemson averaged 6.18 yards per play and produced six explosive plays, compared with three for UNC. However, removing those explosives drops Clemson to -0.13 EPA/play, showing that the offense still had stretches of mediocre down-to-down efficiency, especially in the first half.
Early & Late Down Execution: Early downs were a major catalyst (49% Success Rate, +0.17 EPA/play), keeping the offense ahead of the sticks. Late-down EPA/play reached +0.11—a sharp improvement over the first two games.
The Turning Point: Middle 8 EPA/play reached an outstanding +0.29. While not immediately reflected in points, it swung game momentum decisively toward Clemson.
Clemson Pass Offense — PFF: 65.5
Advanced Stats
- Passing Yards: 215
- Yards/Dropback: 6.52
- EPA/Dropback: -0.02
- Pass Success Rate: 42%
- Passing EPA: -0.50
- Explosive Passes: 2
- PFF Pass Block: 73.1
- PFF Receiving: 59.0
- QB Pressure Rate: 22%
- QB Blitz Rate: 11%
Analytical Points
Functional, Not Dominant: the unit generated 215 passing yards, but an EPA/dropback of -0.02 and a 42% success rate show an attack that struggled to generate consistent net-positive EPA.
Pockets Kept Clean: pass protection excelled (73.1 grade, 22% pressure rate). UNC presented extra rushers on just 11% of dropbacks, aided by quick-game play-calling (76.7% of passes thrown 10 yards or fewer).
Quarterly Progression & Breakthrough: passing production surged in the second half:
Q1: 4-of-6, 14 yards
Q2: 8-of-14, 62 yards
Q3: 6-of-8, 110 yards (The primary passing breakthrough)
Clemson Rush Offense — PFF: 75.6
Advanced Stats
- Rushing: 31 carries, 209 yards
- Yards/Rush: 6.74
- EPA/Rush: +0.44
- Rushing Success Rate: 55%
- Explosive Runs: 4
- Stuffed Runs: 0
- Runs ≤2 Yards: 13 (42%)
- Runs ≥4 Yards: 16 (52%)
- Line Yards: 103.5
- Line Yards/Rush: 3.34
- Highlight Yards: 105.5
- Highlight Yards/Opportunity: 6.59
Analytical Points
Elite Engine: This was Clemson’s premier offensive component, driving an elite +0.44 EPA/rush (95th percentile) and 4 explosive runs without allowing a single stuffed run.
RB Creation Over Blocking: PFF’s 75.6 rushing grade contrasts sharply with a 57.4 run-blocking grade. A modest 3.34 Line Yards/Rush paired with 6.59 Highlight Yards/Opportunity indicates the backfield created immense value beyond the blocking. Davidson seemed to grow a lot in this game.
Closing Power: after a slow start and in contrast to the last few years, Clemson was able to put the game away on the ground with 11 carries for 100 yards in the 4th quarter alone.
Clemson Defense — PFF: 72.4
Advanced Stats
- Opponent EPA/Play: -0.09
- Opponent Success Rate: 45%
- Opponent Yards/Play: 5.06
- Stop Rate: 33%
- Havoc Rate: 14%
- Havoc Plays: 10
- Sacks: 3
- Interceptions: 1
- Forced Fumbles: 1
- Turnovers: 2
Analytical Points
Disruption Over Total Lockdown: UNC still gained 5.06 YPP and a 45% success rate, but Clemson’s 10 havoc plays and two turnovers played a huge role in flipping the leverage.
Second-Half Lockout: UNC scored 14 points in Q1 but was held to just 3 points over the final three quarters as Clemson gained complete tactical control.
Clemson Pass Defense — PFF: 73.7 Coverage / 68.5 Pass Rush
Advanced Stats
- Opponent Passing: 135 yards
- Yards/Dropback: 4.09
- EPA/Dropback: -0.27
- Pass Success Rate: 30%
- Sacks: 3
- Interception: 1
- QB Pressure: 47%
- Extra-Rusher Look: 75%
UNC QB
- 13-of-31
- 135 yards
- 1 TD / 1 INT
- 4.35 yards/attempt
- PFF Pass: 42.7
Analytical Points
Game-Decisive Stranglehold: Clemson dismantled UNC’s air attack, holding them to -0.27 EPA/ddopback, a 30% success rate, and 4.09 Yards/Dropback.
Heavy Pressure: Clemson had extra men aond the line of scrimmage on 75% of dropbacks and generated pressure on 47% of them (compared to just 22% allowed by Clemson’s OL). The pressure was especially damaging because UNC’s passing game deteriorated after the first quarter. UNC’s QB completed 5-of-8 for 70 yards in Q1, but only 8-of-23 for 65 yards over the final three quarters, with one touchdown and one interception.
Clemson Run Defense — PFF: 65.8
Advanced Stats
- UNC Rushing: 35 carries, 225 yards
- Yards/Rush: 6.43
- EPA/Rush: +0.21 (74th percentile)
- Rushing Success Rate: 60%
- Opportunity Runs ≥4 Yards: 21 (60%)
- Runs ≤2 Yards: 10 (29%)
- Stuffed Runs: 2
- Line Yards Allowed: 123.5
- Line Yards/Rush: 3.53
- Highlight Yards: 101.5
- Highlight Yards/Opportunity: 4.83
Analytical Points
Vulnerable Phase: UNC ran effectively, generating 6.43 YPC, +0.21 EPA/rush, and a 60% success rate.
Interior Flaws: The Tar Heels gashed Clemson’s A-gap for 104 yards on 15 carries (6.9 YPC)—accounting for nearly half UNC’s total rushing yards on under half their carries.
Tackling & Fit Issues: Despite UNC’s poor run-blocking grade (58.3), Clemson’s dismal 50.5 tackling grade and low stuff rate (only 2 stuffed runs) reveal that issues stemmed from defensive execution—interior penetration, gap integrity, and linebacker fits—rather than dominant OL play.
The Big Picture
Tale of Two Halves: The final score can obscure how different the two halves were.
First half: UNC 17, Clemson 6
Second half: Clemson 22, UNC 3
Clemson’s offense ultimately won the game through its rushing efficiency, explosive plays and much-improved second-half execution. The defense won primarily by disrupting UNC’s passing game, with pressure becoming a much larger factor than the final sack total suggests.
Does this mean that Clemson is back? Absolutely not. But it is a step in the right direction.