


Between 1977 and 2008, the Oregon Ducks had just two head football coaches. For more than 30 years, that remarkable consistency allowed the program to steadily grow from its humble place it occupied in the early to mid-1970s to the national presence it enjoys today.
In stark contrast, between 2009 and 2021, Oregon had four different head coaches in just 12 years—twice as many as in the previous 31—with none staying longer than four seasons.
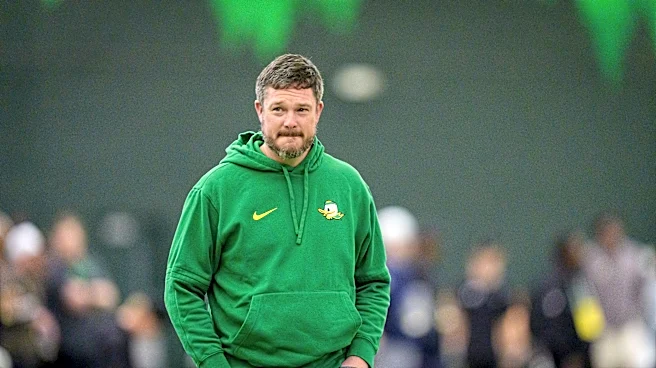
As Dan Lanning is now entering his 5th season as head coach
he will become the first head football coach since Mike Bellotti to coach more than 4 season at Oregon.
Last off-season I wrote articles on the 4 transition coaches for a trip down memory lane. Now that Lanning has completed his 4th season (the same amount as Kelly, Helfrich, and Cristobal) I wanted to evaluate Lanning similarly.
Background
I was having a difficult time figuring out how to approach this article. For the other 4 I found that there was some myths among the Oregon fanbase about each coach that I wanted to either dispel or prove if that was actually the case. These myths defined those coaching tenures both positively and negatively.
A myth usually develops over time as our memories become more foggy. With Lanning currently at the helm I felt like there aren’t myths to dispel or prove like the other coaches. I was thinking to myself, “How would I define Dan Lanning as an Oregon head coach”. What I ended up landing on was balance. Aside from his first year when he was implementing a new defensive scheme with personnel mis-matches I think the best way to define Dan Lanning as an Oregon Duck head coach is that his teams are incredibly balanced.
Overall Team Balance
Both on offense and defense, rushing vs passing, down to each position unit what I think has been one of Dan’s greatest strengths at Oregon is he pays all aspects of his team a very high level of detail. There are number of ways to show this, what first came into my head was to simply take the Offensive F+ Ranking and subtract the Defensive F+ Ranking from each Oregon duck team. The higher the integer the more one side of the ball carried the other in particular season. Here are the results of that for Oregon from 2009 to 2025.

Positive numbers reflect the Offence carried the defense in a particular season. Negative numbers reflect the opposite. In 2010 when Oregon fielded both the Number 4 ranked offence and Number 4 ranked defense they had a balance score of 0. In 2016 when Brady Hoke field the worst defense my eyes have ever seen but Oregon still had the 12th ranked offence well.. you can see the chart.
Again, aside from Dan’s first team at Oregon, his teams have been quite balanced when it comes to the quality of the offence and defense.
Now of course the flaw with this measure I’ve created is if a team sucks or if a team is really good it could produce the same result. A team with the 4th ranked defense minus the 4th ranked offence produces the same result as a team with the 108th ranked defense minus the 108th ranked defense. So here is that same chart with an additional line graph that plots the overall teams F+ rating each year

In the F+ era (which dates back to 2007) Dan has fielded the two best Oregon teams and 3 of the best 5.
Another way to measure overall team balance is using a Hythloday’s charting statistics. Each Duck team since 2009 has produced 8 rate charting statistics each year. What we can do is look at how many of those 8 statistics each year were championship caliber for something I’m calling the championship caliber ratio.
For example. These are the charting stats for the 2025 team

This means the 2025 team had a championship caliber ratio of 50% thanks to offensive explosive passing, offensive efficiency rushing, defensive efficiency passing, and defensive explosive rushing. We can then do this for a coaches entire tenure. Here are those results for Lanning and the 3 coaches that coached at least 4 seasons. For now we can all ignore the Taggart season, if you’re interested you can read about it here.
- Kelly 18.75%
- Helfrich 18.75%
- Cristobal 21.875%
- Lanning 46.875%
That is essentially a measure of how many facets of the coaches teams were championship caliber. We can do the reverse and figure out how many facts of the coaches teams were below average. To return to 2025 as an example the below average ratio is 25% due to offensive explosive rushing and defensive efficiency rushing. Here are the facets of each teams coaches that were below average.
- Kelly 21.875%
- Helfrich 31.25%
- Cristobal 12.5%
- Lanning 9.375%