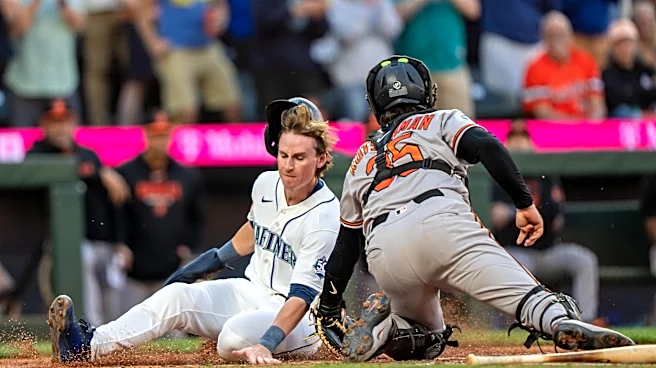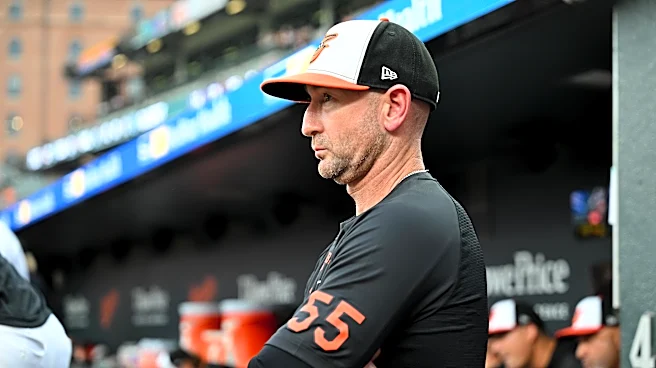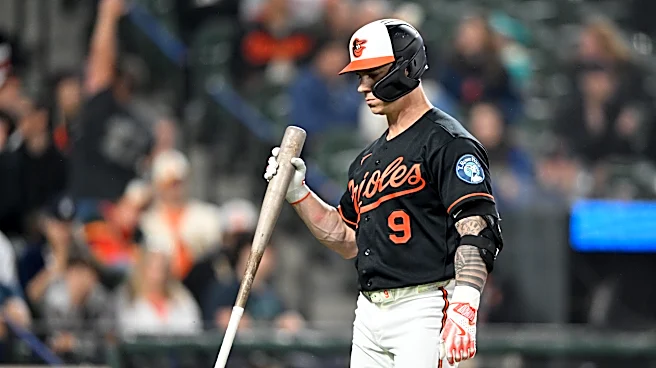


The 2026 Orioles have not yet escaped from the road to disappointment. Maybe they never will. Although the weak middle of the American League keeps them from being insurmountably far out of the race already, the early results haven’t been fun from these guys. They needed to come out of the gate ready to prove to everyone that things were going to be different this year. At times, for a game or three, they’ve done that. They just haven’t done it consistently enough to be successful.
On a game-to-game
basis, it’s easy to get wrapped up in whatever failed in that game and think that must be the consistent problem for the Orioles. Sometimes these things actually are problems. Sometimes they aren’t. This article explores where the Orioles are weak relative to the league, thanks to Baseball Reference’s “split OPS+” statistic, which compares a team’s performance within a given split to the league averages to show where the team is measuring up and where they aren’t.
sOPS+, like any stat that has a + in it, is calibrated so that 100 is the average, and if you go higher, that’s good for batters and bad for pitchers, and if you go lower, it’s the other way around. I will be highlighting a number of areas where the Orioles batters are more than 10% worse than league average (90 or lower). When I started this article, I thought I would include pitching struggles as well, but there are so many batting problems that the pitching ones will have to wait for a different article. Maybe tomorrow. This one was getting too long.
These numbers do not count anything that happened in Wednesday’s game.
Facing left-handed pitchers
- Orioles split: .226/.305/.364 (89 sOPS+)
- League split: .241/.318/.391
This one has been obvious based on the eye test all season long and in this case the eye test isn’t lying, nor is your memory. The Orioles are stinking against left-handed pitching this season. Lately, some of their right-handed batters have come around more, such that the RHB vs. LHP split is slightly above my 90 threshold, but it’s still bad: .690 OPS for Orioles righties against southpaws compared to a .726 OPS by the league as a whole.
Lefty batters are also coming up short relative to their peers in the weak half of the platoon split. Orioles lefties hit to a .600 OPS facing southpaws. That’s way worse than the league’s .676 OPS.
Problems by defensive position
- 3B: .214/.279/.361 (83 sOPS+)
- CF: .216/.306/.331 (84 sOPS+)
- RF: .222/.317/.337 (80 sOPS+)
- PH: .197/.265/.246 (64 sOPS+)
The players who have played the most at these positions are Coby Mayo (third base), Leody Taveras (center field), and Tyler O’Neill (right field). Taveras is hitting right about league average, though he’s cratered hard after a hot start Mayo and O’Neill have not managed to get to acceptable numbers for the season. And as for the pinch hitters… it’s a pathetic result for changes made to the lineup mid-game. Nobody’s pinch hitters are good (.629 OPS league-wide) but the Orioles stand out even considering that.
Problems by batting order spot
- Batting 1st: .231/.329/.355 (86 sOPS+)
- Batting 5th: .232/.303/.337 (81 sOPS+)
- Batting 7th: .217/.298/.326 (79 sOPS+)
The most frequent batters at each of these spots in the order are Taylor Ward (leadoff), Samuel Basallo (5th), and Colton Cowser (7th). Ward, although he has done well at drawing walks out of the leadoff spot, hasn’t been good for much else there; his success is as a #2 hitter. However, it’s Gunnar Henderson’s batting leadoff that’s really killing the Orioles here (.254 OBP in 24 games). Basallo has found better success in different batting spots, though it’s a small sample size hitting both 4th and 6th.
Problems when the first pitch ends the PA
- Orioles split: .296/.301/.454 (68 sOPS+)
- League split: .333/.342/.563
This one stunned me when I saw it. It’s not something I expected to be a problem area when I started this. That’s a massive gap. The league, overall, is doing a lot of damage when coming out ready to ambush the first pitch. MLB hitters have turned the first pitch into a home run just over 5% of the time. The Orioles are doing so less than half that often, around 2.2%.
They are putting the first pitch in play at roughly the same rate as the league, they’re just not doing much when they do it. The whole Orioles plan is supposed to be recognizing when there’s a pitch you can do damage to, and then doing damage to it. This is one of the most glaring signs that they aren’t doing it.
Interlude: One area where the Orioles don’t have a problem
The Orioles are beating the league average split with runners in scoring position. No, it’s true. Their .242/.329/.429 line is about 6% above the average. This isn’t their problem! The games where they fail with RISP do stand out in the memory, but memory can trick you like that.
Having said that, it’s not hard to swing right back into a problem: The Orioles are doing worse than average with two outs and runners in scoring position, recording just a .649 OPS compared to the league collecting a .697 in that same split. Your memory is not fooling you about that. They are having a tough time getting the big hit once they have two outs. And, if you were wondering, Orioles pitchers are allowing an .848 OPS with two outs and RISP. Ouch.
Problems getting a big inning going
- Leading off an inning: .229/.319/.371
- Overall with no outs: .238/.322/.365 (90 sOPS+)
- 0 outs, man on second: .190/.292/.238 (38 sOPS+)
- 0 outs, men on first and second: .242/.342/.242 (57 sOPS+)
This another area that probably jibes with your recollection. Orioles batters are having real problems creating early-in-inning rallies compared to the rest of the league. Their first batters aren’t getting on base as often, and when people do get on base, the ones coming after them aren’t doing as much to help put up a crooked number of runs.
Problems the second time through the order
- Orioles split, 2nd time vs. SP in a game: .223/.295/.374 (83 sOPS+)
- League split: .251/.321/.411
One of the near-universal truths of the modern baseball game is the times through the order penalty. Each successive time in a game that a lineup gets to see a starting pitcher, the advantage swings towards them, because they’ve seen a guy’s stuff that night and they’re more able to adjust. Possibly the pitcher is going to tire as the game goes along as well. This is the logic that leads to so many five-inning starts, where teams are fanatical about keeping their pitchers from seeing the lineup a third time around.
And then you have the 2026 Orioles to date. They are doing respectably the first time through the order against starting pitchers, putting up a .703 OPS, slightly better than league average. Then, the second time through, they’re actually doing worse than the first time: a .669 OPS, 34 points worse! MLB batters as a whole improve by 36 points of OPS going from the first time to the second.
This one is also stunning. You have to wonder about what kind of in-game coaching is going on here if the team is collectively so poorly prepared for making adjustments like that. Similar to the first pitch in play split above, this one suggests that something rotten is going on. They’re blowing even the relative slam dunk stuff in almost unbelievable ways.
A few more areas where things are going well relative to the league
- Catchers and left fielders hitting
- The 8 and 9 spots in the order
- When the pitcher is ahead in the count
- Batting with one out
- Batting with men on the corners (really)
- Batting with the bases loaded (really – except not with no outs and the bases loaded)
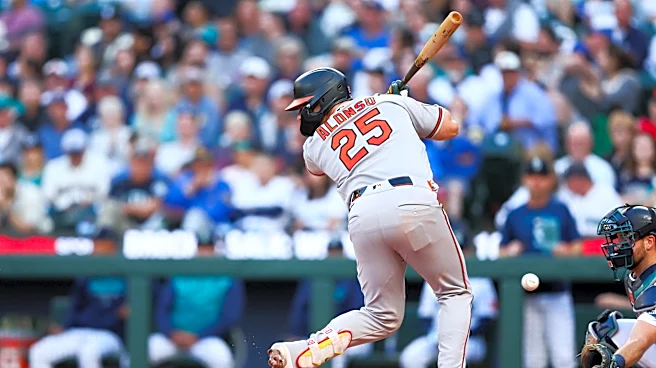
There is probably nothing particular to be gained from the areas where the Orioles are doing better, except for the knowledge that Rutschman, Basallo, and Ward are three of the team’s best hitters to date. Hopefully before too much longer, the recently-hot Pete Alonso turns first base into an above-average split for the Orioles. The rest of this stuff is probably just random statistical noise… probably. If there is something that they can do to duplicate how to battle when the pitchers is ahead in the count in some of these other areas, that will certainly help them out.
**
What can the Orioles even do about any of this? I don’t pretend to have any answers. All I can do with the blinking cursor in front of me is try to describe the team’s actual problems so that people can better understand how our favorite baseball team is once again disappointing compared to preseason expectations.