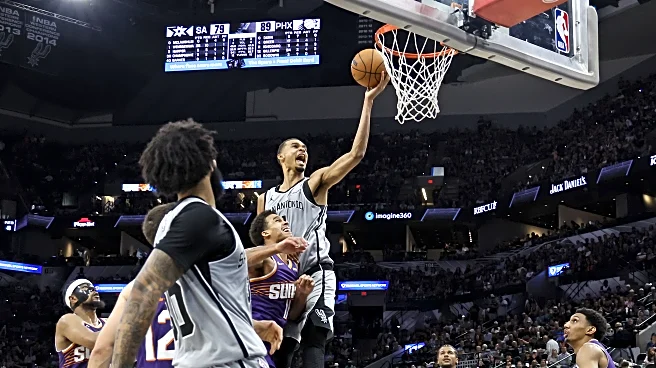


Games like this are interesting in that the two teams playing are pursuing fundamentally different goals. Furthermore, because these goals are so diametrically opposed, the game’s outcome either means that both teams win or both lose. Coming into last night’s game, Indiana was riding a 15-game losing streak to the best lottery odds available in the upcoming draft, but more losing needs to be done to secure that position. At the same time, San Antonio entered the game with long-shot odds of catching
the Thunder for first seed in the West. As such, a Pacers win would have been a disappointment for both sides, even if it would have given Indiana’s players and fans a welcome respite. Fortunately, the Spurs won handily, and both teams got exactly what they needed to continue pursuing their goals this season.
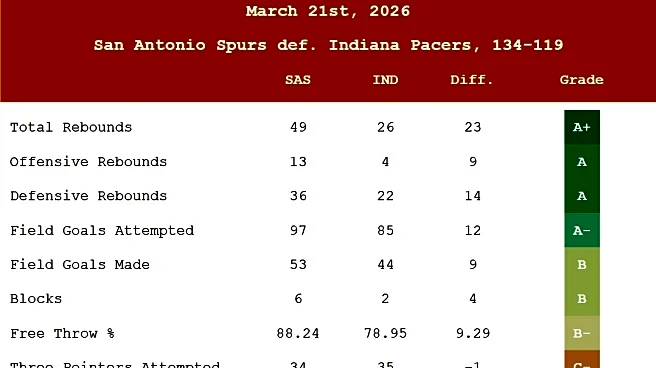
Because the game was characterized by a 13-point first quarter blowout followed by a steady march to victory, the box score differentials achieved in this contest weren’t especially gaudy. Even so, there are a number of striking highlights to consider:

- One key aspect of the Spurs’ victory in this game was a substantial advantage in shot volume from the field overall (+12 FGA), which largely stemmed from their exceptional edge in total rebounds (+23), including a +9 edge on the offensive glass.
- On top of volume, San Antonio had a meaningful if unspectacular edge in FG% (+2.87 percentage points). Collectively, these advantages allowed the Spurs to achieve a FGM margin of +9.
- Alas, it wasn’t all jam for San Antonio, with the biggest fly in the ointment being Indiana’s excellent performance from distance. Although the Pacers only had one more three-point attempt (35 vs. 34), the Spurs’ notable disadvantage in 3P% (-7.48 percentage points, despite logging a 3P% of 38.24%) allowed Indiana to produce a 3PM margin of +3.
- This edge from three wasn’t nearly enough to secure the win for the Pacers, but it was sufficient to produce this rare statistical feat: last night’s contest marked just the 28th time in 16,728 regular season games since the start of 2012-2013 that a team lost by at least 15 points while shooting at least 45.71% from three on 35+ attempts.
- Scoring from the free throw line ended up being a wash in this game, with both teams scoring 15 points in this area. San Antonio had two fewer attempts, so their edge in FT% (+9.29 percentage points) was well above average, but the low volume on both sides makes this differential a bit misleading (large percentage-point margins can emerge from small differences when overall volume is low). In any case, because both teams combined to take just 36 shots from the charity stripe, and the Spurs outscored Indiana by 15 from the field, free throws were highly unlikely to be a decisive factor in this game.
What are Team Graded Box Scores?
Very briefly, these box scores grade winner-loser differentials for basic box score statistics, with the grade being based on the winning team’s differential relative to other NBA winners during a defined reference period. Think of it like a report card for understanding how a given winner performed relative to other winners. The reference period used runs from the start of the 2012-2013 season to the latest date of play, including only games in the same season category (i.e., regular season and playoff games are not compared to each other).
Data Source: The underlying data used to create these box scores was collected from Basketball Reference. In all cases, the data are collected the morning after the game is played. Although rare, postgame statistical revisions after data collection do occur and may affect the results after the fact.