

Before the 2026 season started, the Braves were projected to be good. Per FanGraphs, their central estimate Steamer-plus-ZiPS blend projection saw them in a virtual tie for the NL East crown with the Mets at 90 wins, with division odds of 36 percent, top-two-in-NL record odds of 29 percent, and overall playoff odds of 79 percent. The projected record was top three; the playoff odds were top four.
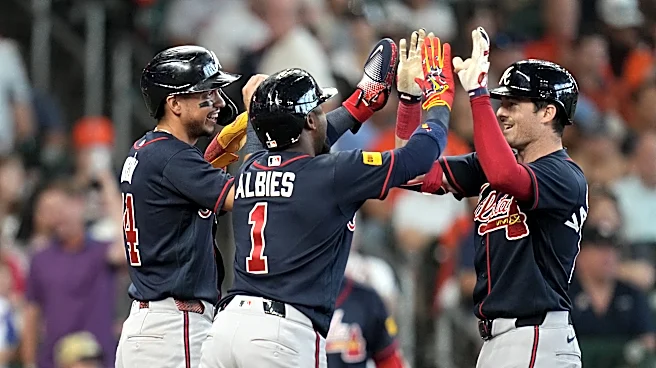
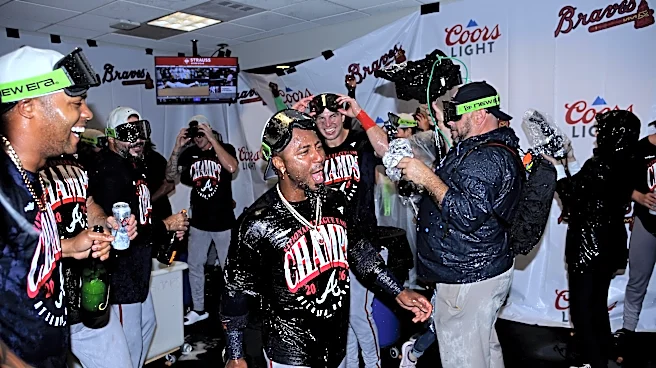
As I start writing this on September 21, the day after the Braves clinched the NL East with a sweep of
the Astros, it’s hard to say that things didn’t work out as expected. The Braves have 92 wins, good for fourth in MLB — whatever extra wins they collect this week are gravy, as the Braves have little chance of overtaking the Dodgers for a top-two NL record and corresponding bye, and they probably won’t try in favor of getting guys rest and lining up their rotation for the first round of the postseason. In at least this way, things went according to plan: the Braves were projected to be good, they were good, and they ended up basically where they were expected to. Hooray, the system works, at least this time. (Not in 2025, but the less we can say about that cursed season, the better… perhaps 2025 was the debt repaid for 2018.)
This turn of events should be satisfying. Or, failing that, at least mollifying. For all the hand-wringing from 2024-on: the core is aging and no longer good; the team can’t supplement its roster with quality players, especially in the rotation; the team can’t manage player health well enough to complete; and so on and so forth ad nauseam like a giant Battery Power Atlanta Braves Game Thread and Discussion made manifest into a marquee crawl blazoning from the inside of fans’ eyelids… yes, for all that hand-wringing, here came the 2026 Braves, clinching with a week to go, while the Mets went full Mets (again, and earlier this time) and the Phillies look like a much more apt target for the same sort of hand-wringing.
Are you satisfied? If so, this post isn’t for you. This post is for me, someone who spent a huge chunk of the offseason thinking about how this roster shaped up, and then pulled an update together every two weeks that told a… different… story. A weird story. Not weird like 2018, where a young roster led by a budding superstar played well enough on both sides of the ball to roll through five of the season’s six months en route to a 90-win season. Weird a different way.
I considered burying the lede, but I won’t, and chances are, you’ve seen this written before. The Braves have the fourth-most wins through the point where win collection was relevant for them. Yet, they rank 21st in position player fWAR and ninth in pitching fWAR. Are they getting horrendously unlucky with offensive outputs? Not really — they rank 14th in xwOBA (and that’s not park-adjusted; they play in a favorable-ish home park for offense). There’s a bunch of stuff going on, but it all makes the the story of the 2026 Braves complicated. And weird. I’m emphasizing weird, because that’s the vaguest, most-broad way of talking about it.
Baseball is great because it’s weird. It’s an affair that lends itself to identifying, collecting, and analyzing insanely minute data slices. You’d think with that level of granularity, we’d have come up with a Unifying Theory of Baseball, and in some ways, we have. The thing is, that theory only works in general, and not in every single case. That tension between “we know how this works at this point” and “oh crap it didn’t work right here” is, at least for me, the most delectable part of the whole affair. Experiencing baseball is standing chest-deep in a river of both expectations and occurrences as they unceasingly rush past you. It’s amazing. I won’t forget the 2026 Braves, who are like a bizarrely-shaped log in that same river, cartwheeling end-on-end and occasionally smacking everyone in the face.
Let’s talk briefly about WAR. fWAR, the FanGraphs WAR formulation, to be specific. (This is not the place for a castigation of bWAR, the Baseball-Reference flavor, but we can make a space for that elsewhere.) Here’s a not-secret that you may not be aware of if you made it this far, but don’t know how (f)WAR works.
WAR has no idea whether a run scored (or didn’t), and therefore has no care for whether anyone scored more (or fewer) runs than anyone else at any time ever.
WAR has a tough job, and I won’t get into everything it does pretty well here, but the idea is that in order to meet all of its functions and responsibilities, WAR has little use for context. A bloop single can be a walkoff that wins a game. A bloop single can be a garbage time nothingburger. A bloop single could be a key part of a rally that is rendered irrelevant by a bullpen meltdown later. To WAR, they’re all just bloop singles.
So then, you may not find it noteworthy, but I find it mind-spinningly remarkable, that this is true: from 2021-2026, somewhere between 80-90 percent of the difference in team record (and generally closer to 90 percent) can be explained by difference in team (f)WAR. If you made a chart, it would look like this:

(Hey, what’s with the stuff in the bottom left corner? That’s 2020. WAR even worked this well in 2020.)
See the coefficient on that best-fit line formula? It’s basically one, i.e., one more WAR-win means one more actual win. This is also remarkably consistent — if doing individual years, that slope coefficient is somewhere outside of 0.9 to 1.1 in just five of the 25 years assessed (excluding the pandemic season), and just one since 2010 (2025). (And it’s not like it’s far off of 0.9 or 1.1 where it does happen.)
Another thing remarkable about this diagonal corndog of a graph? fWAR was, maybe at some point, focused entirely on the nuts and bolts of outs and non-outs, but it has deviated. One huge thing that stands out in my mind has to do with fielding: by switching from UZR to Statcast/OAA for defense, positioning is no longer accounted for in fWAR. A team with elite defenders in the wrong place gets more WAR even if they don’t get more outs; a team with lollygagging glovemen that has pristine-ish positioning would probably have awful defensive metrics but a very low BABIP-against (that wouldn’t factor into WAR). Yet, fWAR perseveres. (It wasn’t that big a change, but I do think it’s one that needs to be acknowledged — it makes WAR better at comparing players but worse at being summed and giving you a team-level understanding.)
So, the system works. Does it work for the Braves?

Pretty much, yes. There were three outlier-ish seasons where the Braves did something akin to what they are doing in 2026, but most of the rest are right on the line. In 2002, the Braves had 88 WAR-wins but romped to a 101-win season. In 2019, it was 86 WAR-wins and a 97-win season. 2026? Even without the full year in the books, it’s 79 WAR-wins and 92 wins.
The 2026 Braves have a real chance of having sub-.500 WAR-wins, while winning the division and winning 92-plus games. Since I’ve been watching them (2001-onward, hence the time horizon here), the Braves have had eight seasons with sub-.500 WAR-wins (excluding 2020); the only season, other than what might transpire in 2026, was that doomed 2011 campaign where the team finished with 80 WAR-wins but 89 go-nowhere wins. That season sucked at the end, but maybe it was… the universe setting things to rights in a compressed period?
Anyway, enough examples, here’s a table.

I could stop here, but let’s go deeper.
In addition to team WAR, which is the sum of WAR accrued by all players playing for that team, FanGraphs also computes and maintains BaseRuns. The idea behind BaseRuns is that linear weights (the things that assign value to a double versus a homer versus an out) don’t cover enough edge cases when adding a bunch of players performing on the same team together, so it exists as a team-oriented measure of run scoring and run prevention, done mostly by just taking all the individual events that a team is involved in and converting them into runs-per-PA on both the hitting and pitching-plus-defense side. It’s basically like run differential, except if you decomposed run differential to be “the stuff that leads to runs” instead of “actual runs scored that we are just going to tally.” For more, see here — ten years old, but still useful, I think.
The 2026 Braves are not suuuuper weird when it comes to BaseRuns. This season, they have the tenth-best BaseRuns-based offense, the seventh-best BaseRuns-based run prevention, and the ninth-best BaseRuns proxy record overall. (A funny thing about BaseRuns in 2026: the Pirates are fifth in MLB, the Tigers are seventh, and the Braves are barely ahead of the Marlins.) The Braves’ current BaseRuns record is 85-71, seven wins behind their actual pace. The Reds, Phillies, and Rays are all at +9 over BaseRuns; there are three teams (Angels, Tigers, Giants) at -11 or worse relative to BaseRuns. It’s been kind of a wild year for BaseRuns, to be honest.
Both BaseRuns and WAR are sort of based on the same premises. There are key differences, of course — adjustments for the non-linear weights-ness of it all offensively, and the run prevention side really just uses “what did your team allow in terms of outcomes” rather than joining together position player defensive value for balls in play and walks/plunkings/strikeouts/homers (i.e., FIP) on the pitching end. Not surprisingly, there is very little difference between BaseRuns and WAR-wins — probably because BaseRuns is largely only meant to differentiate in edge cases.

Where things get weird is that the Braves are pretty good by BaseRuns, and very mediocre by team fWAR. This is the franchise’s second-largest fWAR-versus-BaseRuns gap, after 2010 (86 by WAR-wins, 93 by BaseRuns, and 91 actual wins).


Worth noting that the Tigers (78 WAR-wins, 86 BaseRuns wins, 73 wins) and the Giants (69 WAR-wins, 77 BaseRuns wins, 64 wins) are also in Weird City. Especially the Tigers, who… I don’t even know what’s going on there. Woof, man. Honorable mention to the Rangers in the opposite direction: 82 WAR-wins, 75 BaseRuns wins, 78 actual wins.
Among the time periods examined (2001-2026 for WAR-wins versus actual wins, 2001-2025 for WAR-wins versus BaseRuns wins), the Braves are:
- Seventh in magnitude of outperforming their WAR-wins in terms of actual wins, literally a 99th percentile happenstance; and
- 20th in terms of WAR-wins lower than BaseRuns, a 97th percentile outcome (or, 54th in overall magnitude of disparity between the two, a 93rd percentile outcome).
Having seven more wins than your BaseRuns record isn’t weird. But having six fewer WAR-wins than your BaseRuns record? Yeah, that doesn’t happen all that often. Add it to the weird pile.
Of course, what this all comes down to is the players. The players play, accumulate WAR, and thereby also inform BaseRuns (mostly doing the same thing in both cases). Whether the team wins or loses a given game isn’t super-related to WAR or BaseRuns because sequencing and the like comes into account.
Wait a minute… sequencing. Maybe this is all about sequencing. We’re on to something, a bit. The Braves do have the league’s fourth-highest clutch score offensively, suggesting that they hit a lot better in higher leverage than lower leverage. They have the exact same ranking on the pitching end, too. The actual splits aren’t very exciting, though. For hitting, they rank:
- 21st in batting outputs and 11th in batting outputs in low leverage;
- 19th and 18th, respectively, in medium leverage; and
- Tenth and ninth, respectively, in high leverage.
They’re unlucky in low leverage and pretty good (and not unlucky in the same way) in high leverage.
For pitching, they rank:
- 18th in FIP and 13th in xFIP in low leverage;
- 11th and 10th, respectively, in medium leverage; and
- Eighth and 17th, respectively, in high leverage.
The secret to the Braves’ success? It’s apparently not giving up homers in high leverage. That’ll do it. Why are the Braves weird like they are? Because their HR/FB in high leverage is 7.3 percent, while their HR/FB in medium leverage is 11.9 percent. That’s not the whole story, but imagine how this team looks if they give up eight more homers (I counted, that’s the difference in the HR/FB in high leverage) in high leverage. Sure, maybe they don’t then lose all of those games, or maybe they did lose some where they avoided a homer in high leverage but… eight falls right into that BaseRuns/WAR-wins/actual wins differential range. It’s not everything, but it’s something.
Three cheers for not giving up as many homers in high leverage en route to a division title!
By the way, here’s a list of Braves with 20 innings pitched and an FIP- of ten or more points lower than their xFIP-: Chris Sale, Didier Fuentes, Dylan Lee, Robert Suarez, Victor Mederos. Hmmmmmmmmmmmmmmm.
Okay, I was going to talk about players but got derailed. Here’s my final bit of “this team is weird” pelting. I’m going to give you three things in the table below:
- Each position player projected to get 200-plus PAs in 2026, each starter projected to throw at least 67 innings, and each reliever projected to throw at least 22 innings;
- Their projected playing time and WAR; and,
- Their actual playing time and fWAR.
How do you think this is going to look like before you scroll down?

Honestly, good lord, what is even happening here. The Braves basically lost a full season of playing time among these projected guys (Ha-Seong Kim, Sean Murphy, and Ronald Acuña Jr.) — but moreso than that, this group of 11 was supposed to contribute above-average, 2.9 WAR-per-600 PAs play. Instead, they contributed… 1.9 WAR-per-600 PAs play.
Austin Riley is/was a nightmare basically all season, minus a few brief glimmers of something that wasn’t awful. Acuña has been awesome lately, but let’s not forget that even if you leave some xwOBA underperformance aside, his current .368 mark is tied for his second-lowest ever, and the run environment is better this year than in the other two years where he didn’t perform up to his lefty standards. Kim’s season was one of the biggest disasters we’ve seen from this franchise, closer to B.J. Upton than anything else — even if he too managed to kinda-sorta salvage it with some huge hits down the stretch. Murphy is either not fully healthy or not fully jiving with trying not to swing out of his shoes. Dominic Smith was supposed to be terrible and somehow ended up even worse in nearly 100 more PAs than anticipated.
Were there any big wins? Mauricio Dubon. That’s really it.
Did anyone else save the position players? Nope. These guys account for 16 of the team’s 16.8 position player fWAR, and 88 percent of their PAs. No player not projected to play a big role actually stepped in and “won” a big role. The best bench performance the Braves got was Eli White’s 0.6 fWAR in 144 PAs as a result of massive xwOBA overperformance, and they traded him to make roster room at the Trade Deadline anyway.
Pitchers, this almost feels like a typed-out version of a Lewis Black routine. (Do people even get this reference anymore?)

Yeah, Chris Sale is awesome. But… Spencer Strider? Terrible and barely pitched. Reynaldo Lopez? Not good, and barely pitched. Oh, Bryce Elder pitched a lot… and due to homers, somehow produced less on a rate basis than modest expectations. Spencer Schwellenbach? Let’s not even go there.
The good news for the pitching is that Sale was so freakin’ good that these guys didn’t really miss a beat, other than availability. They were projected to pitch at a rate of around 3.2 WAR per 200 innings, and they ended up at 3.0 WAR… except that they ended up pitching about two-thirds of the innings they were supposed to, collectively. Who filled the gap? Well, Martin Perez came in and played savior, with a funny 74/105/111 (ERA-/FIP-/xFIP-) line. Thanks, guy! We all know about Tyler Mahle, and he’s been huge. Still, that leaves about 50 innings unaccounted for, and, well, the guys the Braves tried in those innings pretty much got obliterated.
Aaand, that leads us to this, where we applaud Dylan Lee and Didier Fuentes for A) being awesome, but also B) not allowing homers, which basically gave extra weight to their already-fantastic pitching.

Yes, the Braves fell short of about 100 innings in terms of projected “bullpen regulars,” but not having Joel Payamps around was addition by subtraction. Throw in Robert Suarez being great before getting hurt along with the Iglesias and Lee show, a nice showing from the other Dylan (Dodd), and the fact that Victor Mederos is apparently the key emblem of this team (87/71/110, you can hahaha that all the way to the bank), and I guess the point is that wherever things went terribly, it wasn’t in the bullpen.
Wanna add these together?

Consider that the team’s actual WAR from all sources, not just these prognosticated-to-be-key-contributors names is 32.6, so we’re not missing much (Tyler Mahle, Martin Perez, and mostly negative fWAR otherwise). Nearly every position player was worse! Chris Sale (and Tyler Mahle’s two months), awesome! Bullpen, awesome! The team still fell well short of what it was expected to do… but also, absolutely didn’t.
We’ve come full circle. This team is weird. Will the weirdness continue? I have no idea. Either way, I don’t think I’ll ever forget these guys. But, I will request that in 2027, they be a little less weird… and just win the normal way: by crushing the other team on both sides of the ball.
(Oh, and we haven’t even gotten into the whole Antoan Richardson mess, the challenging passivity, the way that almost no good team has had a month as bad as the Braves had in June… and it keeps going. But I was over 3,000 words. We can cover those later, when things calm down.)