

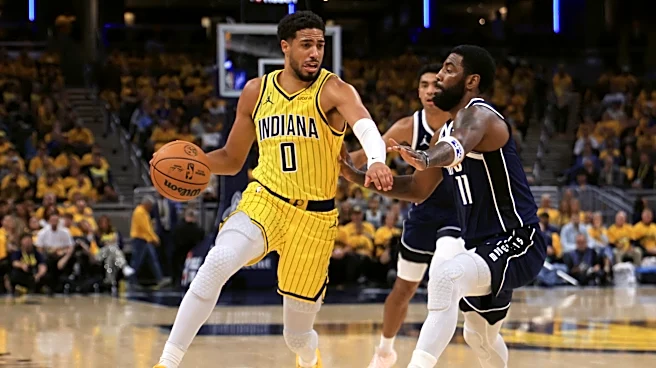
Okay, now I’m worried. The Wizards went to Indiana and got thumped by a Tyrese Haliburton-less Pacers team. It’s Washington’s fifth straight loss — and four of the five have been by 10 points or more.
If you want to stick to the “it’s early” and “they’re finding their way and they’ll improve as the season goes on” talking points, you’ll probably want to skip a few paragraphs. Because I did some looking up and some numbers crunching, and…well…it’s not as early as you think. I mean, I was getting nervous
when the streak reached three, and I was reciting those Talking Points myself, so let me be clear — it’s not as early as I was thinking.

The Wizards entered last night’s game against the Pacers with a strength of schedule adjusted scoring -11.3 through 11 games. They lost by 13 to a team scoring a -6.3 in the same metric. That’s not good. And the team’s performance a dozen games into the season is greater cause for worry than I’d imagined.
While it feels early, analysis of NBA history says that by this point in the season, we already have about half the information needed to determine a team’s relative strength in the league. Even just 8-10 games is enough to be more than just random noise.
There’s still some noise — early-season blowouts have bigger impacts on this type of scoring differential metric than it will by the end of the season — but what we see in the first month of the season is a surprisingly good indicator of what we’re going to see over the final five.
In the case of the Wizards this season, they may not really be the quality of a team that wins just 14-15 games (which is what their adjusted scoring margin implies), but a) they could be, and b) it’s pretty unlikely they’re even the quality of a 35-win team. Best case at this point is probably mid-20s in wins — better than last season, though not the major step forward many hoped.
While it’s not as early as we think, it’s getting later fast. We already have half the information needed to draw a meaningful conclusion. By game 20, it’ll be about 70%. By game 30, it’s closing in on 80%.
Perhaps the biggest wildcard in all this is the role of three-point shooting luck. According to research published on the Above the Break Substack, it takes about 33 games for opponent three-point shooting to stabilize. Unfortunately, opponent three-point shooting reverting to the mean could be brutal for Washington — so far this season opponents have been laying bricks from deep.
Of course, reversion could also benefit the Wizards on offense — they’ve been shooting slightly worse from the arc than their opponents. The likely outcome is reversion effects cancel each other out, and Washington ends up basically where they are now, albeit looking a bit better on offense and a bit worse on defense.
None of this is writ in stone, of course. There are examples of teams in NBA history that overcame a rough first month to become good. But it’s rare. And usually those teams aren’t as deep in the scoring margin hole as the Wizards are. I mean, the Sacramento Kings have been a 1-9 horror show this season, and their adjusted scoring margin is better than Washington’s.
Now, it’s not all doom and gloom. The Wizards rank 26th in adjusted scoring margin, but the four teams even worse are all in the Eastern Conference. It’s conceivable that the Wizards could continue playing just as bad and still make the play-in thanks to the struggles of the Brooklyn Nets, Milwaukee Bucks, Charlotte Hornets, and Chicago Bulls.
From the Notebook
- The Pacers announced that Haliburton — the team’s best player — will miss at least another 10 days with his hamstring injury. He’s been one of my favorite watches since he entered the NBA, and he looked fantastic in his first four games back from the Achilles injury.
- On a first quarter drive, AJ Dybantsa made Kelly Oubre Jr. — known for his athleticism — look slow. Oubre actually looked startled at how sudden Dybantsa was.
- A first quarter sequence underscored how much work Tre Johnson needs to do on his body and his overall game. T.J. McConnell wrecked a Washington possession by denying Johnson the ball. The denial forced Davis to handle out top. After setting a half-hearted screen for Davis, Johnson kinda stood around waiting. Davis tried to throw the ball to him, McConnell stole the pass — I mean, HE WAS STANDING IN THE PASSING LANE — and then led the fastbreak, which resulted in a wide open three for Obi Toppin.
- That play aside, Johnson played one of his better games of the season. One play design I liked — early in the the second quarter, the Wizards screened for him in the weakside corner. It looked kind of like a traditional pindown action, except Johnson came to the ball for a dribble handoff that gave him a wide open three-point attempt. He missed, but the design and execution was good.
- Two thoroughly disgusting defensive plays in the second quarter: On the first, Oubre got a dunk because Bub Carrington turned his back on him to watch a drive on the opposite side of the floor. Oubre noticed the turned head and cut behind him for the slam. On the second, Oubre got another dunk because Young tried to cheat the screen on a sideline out of bounds play — guessing that Oubre would come off the screens towards the ball. Oubre went weak side and was wide open.
- Learning moment for Dybantsa — he dribbled too high while trying to back down Oubre and got picked clean for a breakaway dunk.
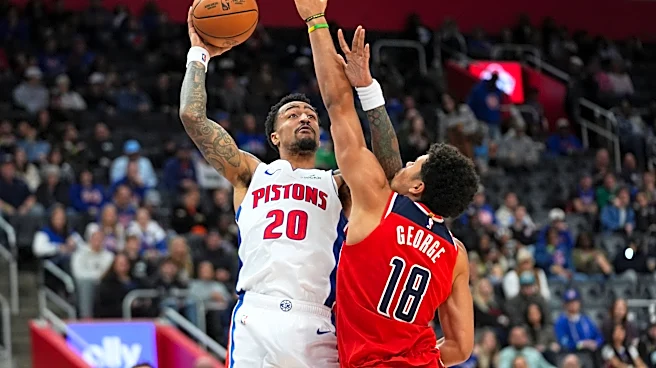
- If all you look at is The Glory Stats, Kyshawn George looks really good last night — 25 points, 9 rebound, 3 assists. Heck, he even shot 5-8 from three-point range. So why does he end up with a below-average score in my PPA metric? He shot 4-12 on twos, committed six turnovers, and contributed to a worse-than-average team defense.
Four Factors
Below are the four factors that decide wins and losses in basketball — shooting (efg), rebounding (offensive rebounds), ball handling (turnovers), fouling (free throws made).
The four factors are measured by:
- eFG% (effective field goal percentage, which accounts for the three-point shot)
- OREB% (offensive rebound percentage)
- TOV% (turnover percentage — turnovers divided by possessions)
- FTM/FGA (free throws made divided by field goal attempts)
Stats & Metrics
PPA is my overall production metric, which credits players for things they do that help a team win (scoring, rebounding, playmaking, defending) and dings them for things that hurt (missed shots, turnovers, bad defense, fouls).
PPA is a per possession metric designed for larger data sets. In small sample sizes, the numbers can get weird. In PPA, 100 is average, higher is better and replacement level is 45. For a single game, replacement level isn’t much use, and I reiterate the caution about small samples sometimes producing weird results.
POSS is the number of possessions each player was on the floor in this game.
ORTG = offensive rating, which is points produced per individual possessions x 100. League average so far this season is listed in the Four Factors table above. Points produced is not the same as points scored. It includes the value of assists and offensive rebounds, as well as sharing credit when receiving an assist.
USG = offensive usage rate. Average is 20%. Median last season was 17.7%.
ORTG and USG are versions of stats created by former Wizards assistant coach Dean Oliver and modified by me. ORTG is an efficiency measure that accounts for the value of shooting, offensive rebounds, assists and turnovers. USG includes shooting from the floor and free throw line, offensive rebounds, assists and turnovers.
+PTS = “Plus Points” is a measure of the points gained or lost by each player based on their efficiency in this game compared to league average efficiency on the same number of possessions. A player with an offensive rating (points produced per possession x 100) of 100 who uses 20 possessions would produce 20 points. If the league average efficiency is 115, the league — on average — would produced 23.0 points in the same 20 possessions. So, the player in this hypothetical would have a +PTS score of -3.0.
Players are sorted by total production in the game.