


After an awesome start, this game was about as enjoyable as having all of one’s teeth pulled. It is important to remember that we’re effectively back to being “on serve,” in the sense that the series is exactly where it would be had homecourt held for everyone. Even so, the vibes aren’t great, and San Antonio will undoubtedly enter Game 4 truly desperate. On top of all that, the box score produced from this game is a bit unremarkable, as OKC’s performance relative to other postseason winners since
2012-2013 was more or less average in most areas. Having said so, a handful of items emerge:
Note: Now that we’ve moved into the postseason, the reference period used for grading changes from the set of regular season games since 2012-2013 to the set of postseason games since 2012-2013. Unless otherwise noted below, this set DOES include play-in games. As of the end of May 22, 2026, this group include 1,195 games.

Factors that decided the game
- OKC won the turnover battle yet again with a turnover margin of -4, but relative to the first two games this felt like a massive improvement.
- The rebounding battle was quite even. San Antonio held a mild edge in offensive boards (+2), but the Thunder had six more defensive rebounds (though this was mostly due to the Spurs’ poor FG%).
- This game was remarkable in how balanced offensive opportunity was (more on that below). In particular, both teams had exactly 33 FTA, and OKC had just one more field goal attempt. Because the Spurs leaned into the shots from distance slightly more, they had a 3PA margin of +3.
- Ultimately, this game came down to shooting efficiency, and San Antonio was worse from everywhere (particularly from distance). As a results, the Silver and Black made five fewer shots, four fewer threes, and one less free throw.
Rare Box Score Stats
- Honestly, this was a really hum drum game from a statistical point of view. The Thunder achieved mildly rare things (e.g., their joint combination of FG%, 3P%, and FT% differentials), but only a couple of truly eye-opening stats emerge.
- This is the 23rd occasion in the 1,195 postseason games since 2012-2013 that a team has lost by 15+ points while making at least 27 free throws.
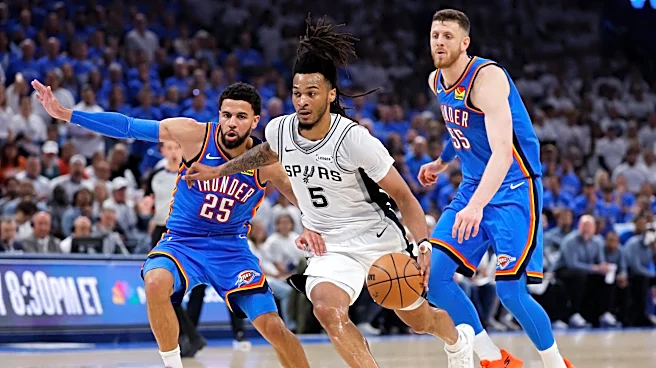
- Stephon Castle may have solved his turnover problem, but he unfortunately joined another ignominious club with last night’s performance. Specifically, he logged just the third performance in a true playoff game since 1996-1997 in which a player scoring at least 14 points earned at least 78.57% of those points from the free throw line. Solid FT%, but his shooting from the field left much to be desired.
What are Team Graded Box Scores?
Very briefly, these box scores grade winner-loser differentials for basic box score statistics, with the grade being based on the winning team’s differential relative to other NBA winners during a defined reference period. Think of it like a report card for understanding how a given winner performed relative to other winners. The reference period used runs from the start of the 2012-2013 season to the latest date of play, including only games in the same season category (i.e., regular season and playoff games are not compared to each other).
Data Source: The underlying data used to create these box scores was collected from Basketball Reference. In all cases, the data are collected the morning after the game is played. Although rare, postgame statistical revisions after data collection do occur and may affect the results after the fact.