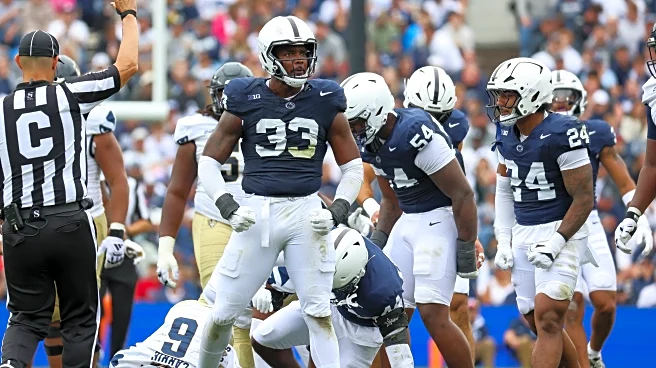
All the national rankings behind this week’s white out matchup!
No. 3 Penn St. Nittany Lions (3-0; 0-0 Big Ten) vs No. 6 Oregon Ducks (4-0; 1-0 Big Ten)
7:30 p.m. ET, September 27—NBC
Beaver Stadium (Capacity: 106,304 / University Park, PA)
| Difference | > 25 | in | National Rank | |
| Difference | > 50 | in | National Rank | |
| Difference | > 75 | in | National Rank | |
| Difference | > 100 | in | National Rank |
Note:
All of the above rankings are taken directly from the NCAA except for strength of schedule, which is taken from Power Rankings.
The Redzone TD% and Redzone TD% Defense are calculated by me and not ranked by the NCAA. Determining who has the advantage in these categories is strictly my arbitrary judgment.
Quick thoughts:
These numbers really shouldn’t come as much of a surprise to anyone who’s watched either of these teams so far this
year – and yet, I will still caveat this and say that this post is way to early, with very little to be extrapolated from the stats (or rankings) of either team. The biggest indicator, to me, is that strength of schedule number; both teams have played poor schedules, with Oregon playing one more game.
There’s a clear advantage on paper to the Ducks when PSU has the ball, and though the Oregon offense and PSU defense seem to match up on paper, this may be the best defense UO sees all season – so that may not be any indicator either. As with many of these top matchups, the team that controls the line of scrimmage may control the game – and, based on this, there seems to be an advantage up front for the Nittany Lions (averaging only 4.2 tackles for loss per game in the 117th schedule in NCAA football is a steep drop off from last year’s Ducks defense). But that means next to nothing if PSU’s offensive playmakers can’t score.
Diving into a few more of these stats:
- Penn State has had 17 offensive red zone trips in 3 games, with 10 TDs and one field goal (5.67 trips and 3.33 TDs per game) scored; Oregon has had 20 offensive red zone trips in 4 games, with 16 TDs and 4 field goals (5 trips and 4 TDs per game) scored
- PSU’s defense has allowed 6 red zone trips and 2 red zone TDs on the year (2 trips and .67 TDs per game) scored; UO’s defense has allowed 4 red zone trips and 3 red zone TDs on the year (1 trip and .75 TDs per game) scored
- The Nittany Lions have converted 5 of their 8 offensive fourth down conversion attempts, while the Ducks have converted 4 of 6. The PSU defense has allowed 6 of 9 fourth down conversions, while the UO defense has allowed 4 of 7
- Both teams have returned 4 kickoffs on the year (1 per game for Oregon, and 1.33 per game for Penn State). On the flip side, the Nittany Lions have faced 8 kickoff returns vs 14 touchbacks; the Ducks have allowed 7 kickoff returns vs 26 touchbacks
- PSU has punted 5 times (1.67 times per game), while UO has punted 6 times (1.5 times per game)
- Penn State has returned 10 punts (3.33 punt returns per game), and Oregon has returned 11 punts (2.75 punt returns per game). Nittany Lion opponents have returned just 2 punts on the year, while Duck opponents have yet to attempt a punt return
What say you all?


