


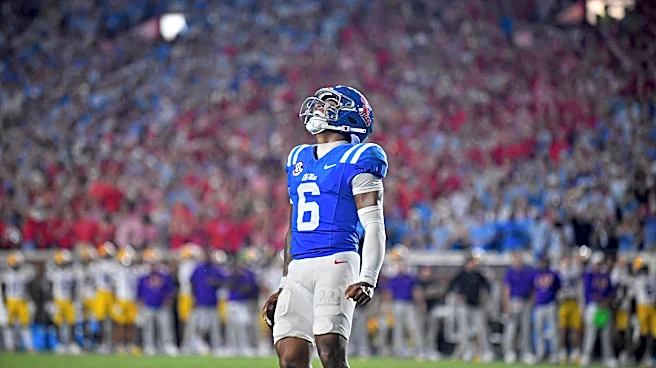

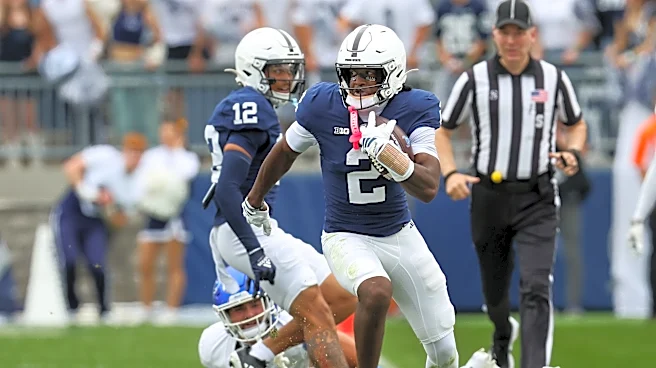
Why doesn’t that sold out stadium look….full?
First, a quick look at attendance in the Big Ten for week 3. With a few exceptions, everyone is still in the non-conference portion of the schedule.

I’m tempted to contact the fire marshals in Bloomington, Ann Arbor, Madison, and especially Eugene. Each of those stadiums were over 100% capacity this past weekend. Although, an early exodus of Portland State fans from their 84-0 beat down by the Ducks likely made it a little safer.
Rutgers reported that there were just over 43,000 at the USC game. Watching
it on TV, and knowing the layout of the place, I had a hard time accepting that figure. Which is why most of this post is devoted to the topic that is….
The missing fans of college football
In the comments for the week 2 attendance post, reader Henry Rutgers II wrote:
Bob, I don’t think I saw the lie from Athletics on week 1 attendance. I was there. It was in the low 20’s at best. If Hobbs was the AD he’d have said it was sold old. It will be interesting to test the credibility of the new leadership team.
And I think we’ve all been at games where we seriously questioned the announced attendance. And that’s the problem: announced attendance isn’t necessarily butts in seats.
For comparison, Major League Baseball doesn’t use actual attendees, those going through the turnstile. And if you don’t know what a turnstile is, I’m not telling you! For MLB, official announced figures reflect paid tickets distributed or sold, including season tickets and group packages. Leagues stopped using routine turnstile counts decades ago (the National League switched from turnstiles to tickets sold in 1992). Teams use tickets sold for official league business because contributions to revenue-sharing pools are calculated using these financial metrics. So, for baseball, it’s a business decision.
Rutgers does it pretty similarly.
Matt Brown runs a site called Extra Points, and because some if you actually read this stuff I write, I subscribe to it. He reposted a story by Greg Chick of NILnomics about why college stadiums look empty despite big numbers being announced. Chick, in turn, used data from David Covucci and FOIABall and what he found is that there is a vast difference from school to school in attendance counts.
There are a few caveats to all this, and I’ll include that at the bottom. In an email exchange with Matt, he was fine with us reporting information and citing the post, but he can’t allow us to use the charts (I love charts and tables) from the research. So for all of you visual learners, like me, sorry.
The research covered the 2025 season. From the article: The number that reflects bodies in the building is scanned attendance: tickets read at the turnstiles as fans walk in. Schools can hand out as many tickets as they like to pad the announced figure, but a distributed ticket and an occupied seat are not the same thing — and the difference, it turns out, is enormous.
David Covucci of FOIABall was able to obtain data from some 55 public FBS schools – including Rutgers – and extrapolated results to indicate the difference between actual people in attendance (the scanned attendance) and the number announced (the distributed tickets, whether or not they are used).
Here’s what Covucci found: Of all the tickets that went out the door, what share never made it through one? Across all 353 games in the data set, the answer was 28.4 percent. Announced attendance totaled 15.4 million; scanners counted 11.0 million.
So, when you see those empty seats and scratch your head when they announce the attendance, you aren’t wrong! Of all the tickets distributed, more than a quarter were never used.
Of the 55 schools from which they got data, there were 13 Big Ten schools, including Rutgers. The three they did not have data for were Penn State, Indiana, and Purdue.(personal note: those three schools can be challenging to get info from)
In the Big Ten, Michigan, Ohio State, and Nebraska had the best percentage of distributed tickets that showed up. For Michigan, that means they might announce an attendance total of 107,601; that’s full capacity. But based on the Covucci research, it’s as likely that only 93,613 made it through the gate to watch. Michigan had the best results, but it still had a difference of 13%, distributed tickets to scanned. The survey’s, and the Big Ten’s, next two teams were Ohio State at 15% and Nebraska at 18%.
The best SEC team that reported information was Texas A&M at 20% disparity. So, if A&M reports that Kyle Field was “sold out”, 102,733 in attendance, that could mean only 82,186 were scanned. For the record, only four SEC schools responded to the survey.
I know, I know….Rutgers. Rutgers had a difference in distributed to scanned tickets of 35%, which actually put it smack in the middle of the respondents at No. 27. The median data point was 35.2%. Which means that for a game at SHI where the attendance was announced as 43,000, it’s very possible that only around 28,000 were in the building. There is no indication in what I could look at as to how Rutgers counts students, the band, or other complimentary tickets.
For the record, in the Big Ten, Maryland showed up below Rutgers with a count disparity of 39%. Those two schools were the lowest in the conference in this study.
The bottom 16 teams in the review were G5/6 schools, ranging from Central Michigan (42% disparity) to Toledo at 68%. That meant that the Rockets announced roughly three fans for every one who actually showed up! And in the P4, Maryland and Cincinnati (40%) were the lowest ranked schools to report data. And, you want to know who reported the same disparity as Rutgers? North Carolina….Bill Belichick didn’t draw as well as they might have said he did.
Caveats & Methodology
First, some caveats. There are some places that count the band – their own plus the visitors if they bring them – along with spirit groups as attendees. The bands, at least, often occupy seats in the stands which otherwise could be occupied by “fans”. There were a few athletic departments that pointed out that student tickets often aren’t scanned at all; that can lead to under reporting the actual crowd. And there are always one-off issues: weather knocking scanners offline or third-party contractors handling ticketing in ways that muddy the counts. One school added student tickets to its scanned totals without scanning them, so its numbers are opposite of other schools.
For the methodology, I’ll cite the article: For each school, I computed the game-level gap — the difference between reported attendance and scanned, divided by reported — and averaged it across the home slate.
So, is a sold out game really sold out? That’s a definite maybe.