


The cosmic irony is far from lost on me that I got comfortable with this team and then it has largely struggled since. This is just the second Cubs loss all year in which they scored eight runs. They’ve lost three times when they’ve scored seven. All of that underscores just how bad their pitching has been at times. This offense is just too good to lose when it scores that many runs. It didn’t start out that way though. Through three innings, this felt like it could be an easy win.
3-0 after three.
Then they allowed nine unanswered runs over the next four innings and that turned out to be the game. They did come off the mat with five runs of their own to make it close. But they just couldn’t get back over the hump. I wrote in my preview that Rhett Lowder was having a rough year and they did well enough against him. I noted that you could get to their bullpen and that was true. I didn’t comment on the Reds offense, but there wasn’t anything I would have seen there that would suggest this. This was just the ninth double-digit scoring game of the year for them.
Curiously, the Reds have won just five of their last 14 games. But their last three wins have all come in games that they’ve scored 10 or more runs. They did have a loss in there where they scored nine. But it’s not like they’ve unlocked something. In the losses are three shutouts, and three games where they scored one. It’s interesting because it is something I’ve talked about with Cub results. That is just how stratified the results can be at times. I lived through the 90’s and I didn’t need a mountain of stats to perceive that scoring had increased significantly. I would not like that data from someone who manipulates data better than me. I don’t know that I’m right, but I perceive that there are more “outlier” results. In turn making them less outlier and more a part of a homogenous data set.
I feel pretty comfortable saying that the Cubs are scoring more, more often. Yes, this is one of the highest scoring Cub teams of our lifetimes. But it just feels parabolic or something. Like the numbers in the middle of the bell curve are normal but at the outside, the slope is steeper. Obviously, the stand out part of the data set are the multi-inning games against position players. I don’t remember ever seeing that before and I feel like we’ve seen that a small handful of times. But I don’t think it’s just that.
It’s not hard to imagine that if my perception is correct that it correlates with the way the best pitchers are used on teams. I’d construct the argument that some teams pack it in at times. But then, the exhibit in front of us is the Cubs allowing 10 runs. There wasn’t any point in time where the Cubs let go of the rope. So maybe I’m not right.
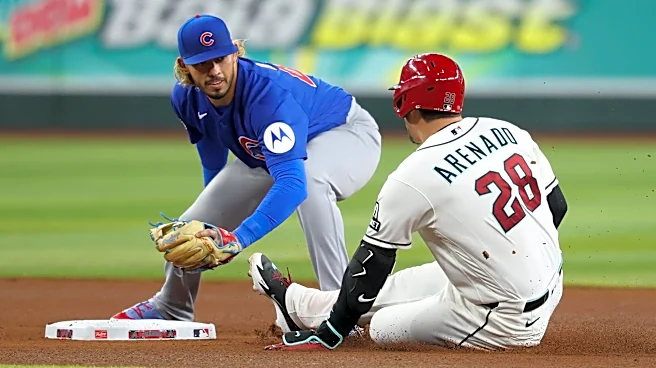
Whether that theory is right or wrong, I think the second theory almost certainly has truth to it. We saw it play out in Arizona. I think teams have become very sophisticated at picking up a whole host of tells. I don’t think many of the teams would ever be honest with you. But it’s not hard to imagine when we see runs so often clustering. The scoring in baseball is more and more becoming peaks and valleys. I posit that hitting has become immensely difficult on the whole. I think the vast majority of pitchers are fairly unreachable by all but the best players when they execute.
But again, it’s not hard to imagine that players who are looking at their tablets over and over through a game are increasingly adept at picking up on things that clue in to what pitchers are doing. And of course, it isn’t just players. There are coaches and team personnel also watching all of this. I imagine there are vast assortments of observations being made, ranging all of the way from visual things to running pitch sequencing through spreadsheets and finding tendencies. What may seem random or matchup dictated may at times be extremely predictable. We are talking about guys who got where they did largely by being able to pick up on the way the stitches on a baseball are moving and what that tells them about the pitch type and location.
I’m reminded of one of my friends back when I was playing poker multiple days every week years ago. We used to joke about having one of those fancy tables with the hole camera that shows what the cards were. It was always a joke, but he was quick to say that he’d never play again if we put them in. He was a financial analyst and he recognized a fool’s bet. He correctly identified that I would have been studying footage endlessly. I had a mind that could remember specific hands I’d played against people and how they played out and could predict ranges of behavior.
I did it all with a good memory and a controlled group of guys I played against. And I was either a rookie league player or Low-A player compared to these guys. The most sophisticated players ever to play the game. Paired with state of the art technology and state of the art statistical nerds. I’d wager that way more than half the time that your favorite pitcher gets hammered that the team has picked up on something.
Again, not hard to imagine. We are already seeing at least one team working to counter some of those effects. It doesn’t get talked about a ton, but the Rays almost always set their catcher up center cut on the strike zone. Anthony Rizzo and David Ross just talked about this on their most recent podcast. Rizzo talked about always having someone in the dugout make noise if the catcher set up early inside. These guys are doing anything they can to try to simplify the task of hitting. We’ve all known for years that they will know immediately if, for instance, your sweeper is never a strike. Then they know when they pick up that rotation to just let it go. It narrows things down.
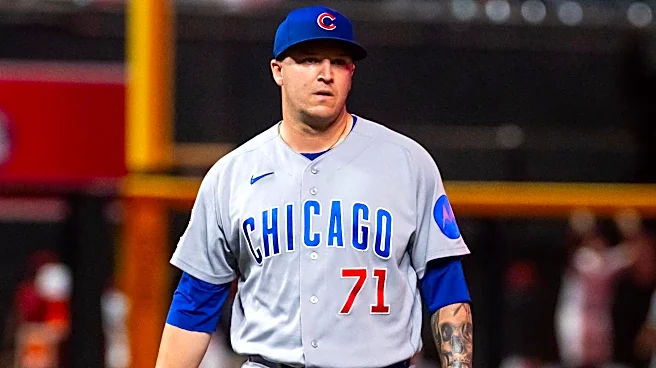
These are the things I think about on a day when there is a five-run inning one way and then a four -un inning the other way. Without those innings, this was a 5-4 game. Ho hum. Trent Thornton has been so good. But boy, did it go bad on him in a hurry. Four hits and two homers in seven batters. His ERA jumped from 2.32 to 3.32 in one outing. This is just the fifth time in his career that he’s allowed five runs in an outing. The last was June of last year, while pitching for the Mariners.
Things I think about.
Three Positives:
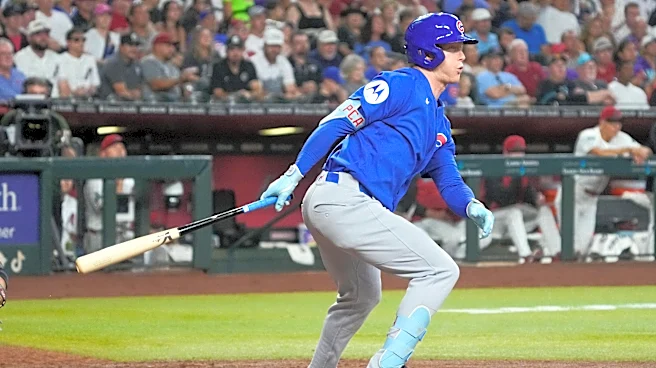
- Seiya Suzuki had three hits, two of them doubles. He drove in two and scored two more.
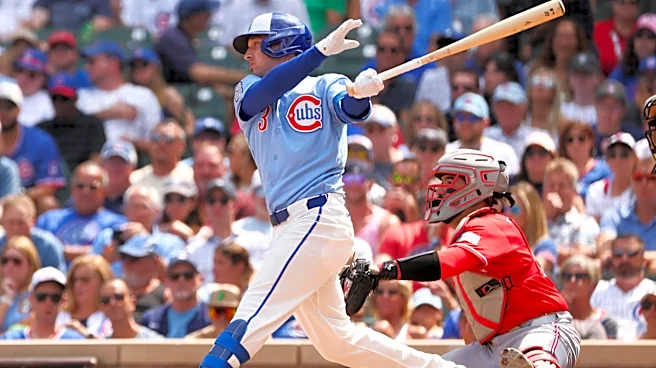
- Michael Busch had a two-run homer and a walk.
- Matt Shaw made his return with a double in his only plate appearance.
Game 135, August 28: Reds 10, Cubs 8 (76-59)

Reminder: Heroes and Goats are determined by WPA scores and are in no way subjective.
THREE HEROES:
- Superhero: Seiya Suzuki (.143). 3-5, 2 2B, 2 RBI, 2 R
- Hero: Matt Shaw (.107). 1-1, 2B, R
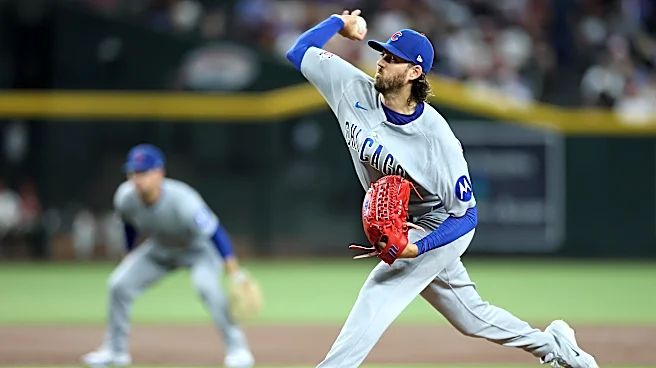
- Sidekick: David Peterson (.085). 5 IP, 24 BF, 6 H, 3 BB, 2 R, 6 K
THREE GOATS:
- Billy Goat: Trent Thornton (-.569). 0.2 IP, 7 BF, 4 H, BB, 5 R (L 5-5)
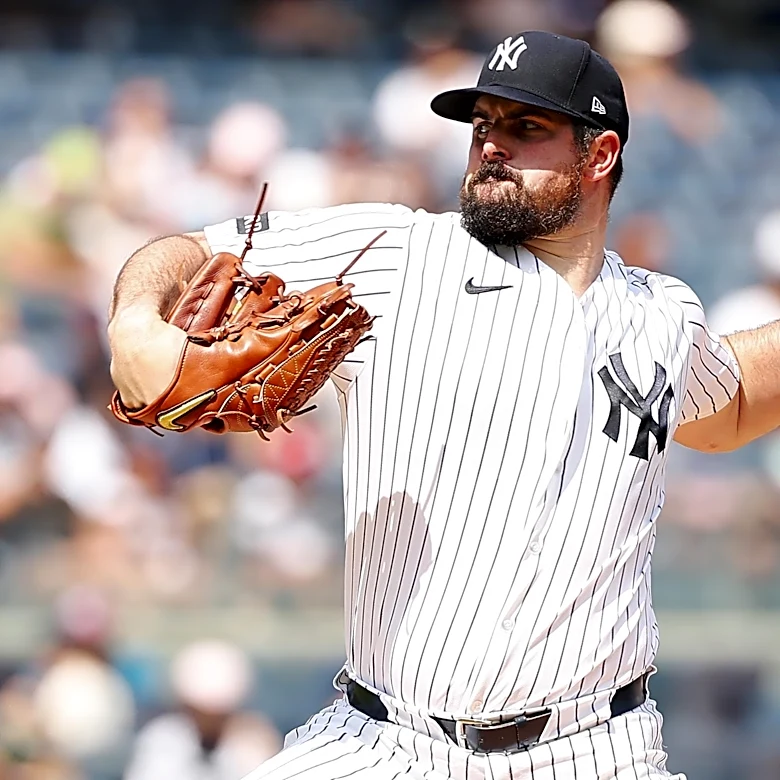
- Goat: Carson Kelly (-.119). 0-3, BB, R
- Kid: Daniel Palencia (-.070). IP, H, R, 2 K
Note: Thornton looks in the early numbers like he’ll register the third worst WPA score of the year. The three worst scores have now happened in an eight-day period (seven games).
WPA Play of the Game: Tyler Stephenson’s three-run homer off of Trent Thornton. (.246)
Cubs Play of the Game: Michael Busch’s two-run homer in the third. (.162)
Cubs Player of the Game:
Game 134 Winner: Matthew Boyd received 43 of 45 votes.
Rizzo Award Standings: (Top 5/Bottom 5)
The award is named for Anthony Rizzo, who finished first in this category three of the first four years it was in existence and four times overall. He also recorded the highest season total ever at +65.5. The point scale is three points for a Superhero down to negative three points for a Billy Goat.
- Pete Crow-Armstrong +26
- Alex Bregman +20
- Ben Brown +13.5
- Javier Assad +12
- Shōta Imanaga +11
- Edward Cabrera -12.5
- Jameson Taillon -13
- Nico Hoerner -14
- Dansby Swanson -17
- Caleb Thielbar -18.5
Note: A Rizzo Award oddity for August. Not one, but two players leaving the top five in one night (Kelly and Thornton). At the same time, Seiya gives himself a gap (4.5) from the bottom five.
Scoreboard Watching: Diamondbacks win (4.5 back of Cubs). Dodgers win (5 up). Padres lose (4 back). Braves win (4 up). Brewers win (8 up). Phillies win (1 back). You really wanted to crush this series, it only gets harder after this series.
Up Next: Game two of this three game set and this 13 straight game stretch. They are 0-1 for both. Kevin Gausman (7-11, 4.37) goes for the Cubs. He moves up one spot in the rotation with the off day. Kevin is 2-1 with a 4.30 as a Cub, coming off of seven scoreless in Arizona. It’s been more than two years since he started against the Reds.
Lefty Andrew Abbott starts for the Reds. Abbott is 6-9 with a 4.15. He’s fairly consistent, checking in at 1-4 with a 4.24 over his last seven starts. His last start was also against the Diamondbacks. He allowed four runs over six and lost. Two starts against the Cubs this year, vastly different. 5.2 scoreless and four runs in four innings. He didn’t factor in the decision in either.
This is a game on paper where you look to stay close and win late. That’s exactly how the two prior Abbott starts went.