

After thinking about what shape my next article should take, one idea naturally imposed itself: telling the Suns’ season through three statistics, or rather three groups of statistics. Numbers that speak, each in their own way. Some positive, others more concerning, and others simply revealing the team’s style of play this season, without judgment.
The more abstract data will be explained, contextualized, and turned into a story. Think of this article as a hat filled with little slips of paper: you
know why you reach in, you trust the process, but you have no idea what you’re going to pull out. One thing is certain: you’re in for a good time.
Free Throw Rate
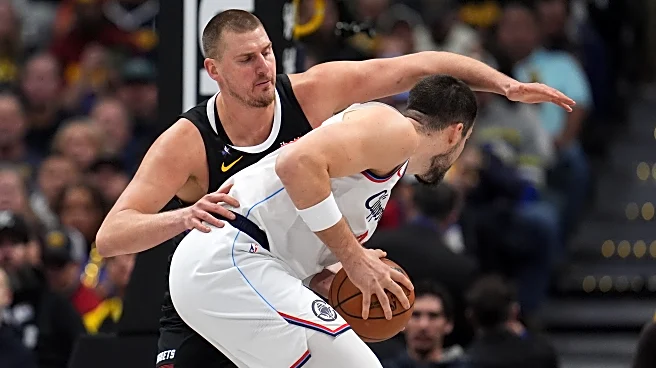
Here’s the first slip drawn: the “FT Rate.” But what is it? It’s simply the number of free throws attempted per 100 possessions. Logically, the higher the number, the more an offense generates trips to the line. This season, the Suns rank 25th, with 19 free throws attempted per 100 possessions. Pretty mediocre at first glance (though numbers always come with nuance and context). For comparison, it’s the 6th‑worst mark in franchise history since 2003‑04.
But as I said, there’s a reason behind it, and you may have guessed it. This season, Phoenix barely plays in the paint. Only 25% of their shots come within 4 feet of the rim (compared to 35% from mid‑range and 40% from three). And since that’s the area where fouls are most often called, it explains the team’s low Free Throw Rate.

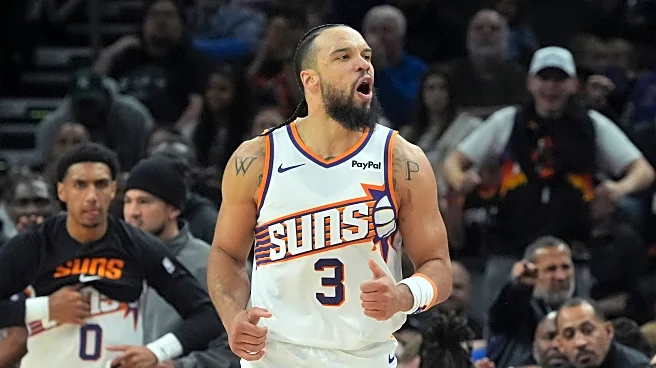
I also think the team lacks a crafty foul‑baiter, someone who can squeeze a few easy points at the line. Outside of the trio Williams, Brooks, and Booker — all above +6 in this metric — the rest of the roster sits at 0 or below (shoutout to Grayson at +2). For once this season, the team depends heavily on a few individuals.
I’ve talked about the Suns’ own score, but not yet about their opponents’ when facing Phoenix, and it’s just as “mediocre” for the Valley: opponents post a 23 FTR (league average is 21). Meaning that this season, Phoenix loses this battle more often than not. A defense this aggressive and courageous is effective, but it still shows clear limits: giving up a lot of free throws is one of them. But Phoenix knows how to play through its weaknesses, which is why it’s hovering around a 60% win rate.
Isolation Defense
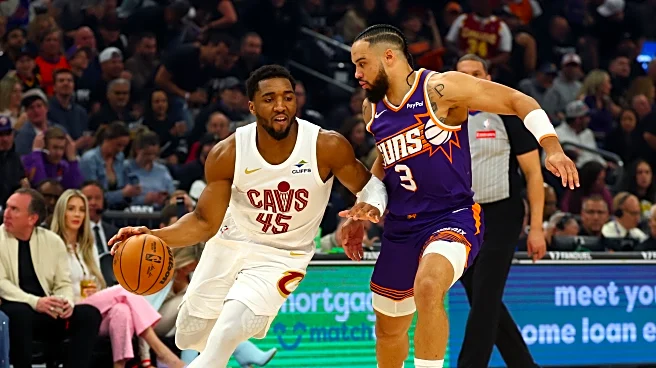
The Phoenix Suns have been remarkably dominant defensively in isolation this season. With an allowed Points Per Possession (PPP) of just 0.77, they lead the league in this category, ranking 1st with a perfect 100th percentile, meaning no team defends one‑on‑one better this year. Their ability to force turnovers is just as impressive: with a 17% turnover rate on isolation possessions, they’re also first in the NBA.
For historical comparison, since 2014, Phoenix ranks 2nd and 9th among all teams in these two metrics. The Suns’ defense is historically elite in many areas, and as a big fan of defense, it’s a joy to watch.
This statistical duo reflects an ultra‑disciplined defense, capable of both containing opposing creators and capitalizing on their mistakes, whether in reading, decision‑making, or positioning. It’s a pillar of their defensive identity, carried notably by players who shine in this area: Dillon Brooks, Oso Ighodaro, Ryan Dunn, and Jordan Goodwin.
Consistency Rating
The “Consistency Rating” is a stat I recently found on NBAstuffer.com. It’s calculated from game‑to‑game variations in efficiency differential. In short, the lower the number, the more stable and reliable a team’s performance is. This season, among the most unpredictable teams, you’ll find the Knicks, Charlotte, and the Lakers, all above 16. On the opposite end, Denver, Detroit, and Dallas are among the most consistent (scores below 13), regardless of context.
The Suns, unfortunately, sit in the bottom 10 with a Consistency Rating of 15.8 (23rd). Concretely — and I find this fascinating for pseudo‑prediction — a score of 15.8 means that from one game to the next, the Suns’ net rating changes by about 15 to 16 points on average. A recent example: Phoenix lost by 9 to the Heat, then won by 4 against the Nets (a 13‑point swing). Continuing from the Brooklyn game, they then beat the Pistons by 18 (a 14‑point swing).
Phoenix’s performances aren’t predictable, but we can still expect a dip here and there. The level swings drastically, but it’s not necessarily alarming: the game plan is stable (offensively and defensively). What causes this irregularity, in my opinion, is their shooting variance, especially from deep. Take a random stretch from December 17 to 27: the Suns shot 29%, 34%, 41%, 20%, 45% from three. A roller coaster, to say the least.
The point differentials over those five games are also wild: +1, -3, +24, +7, +9. Over that stretch, the differentials are fairly stable, but the third game blows everything up. Again, not alarming, but it does raise questions for a potential postseason. The Suns can beat anyone…but they can also collapse against a weaker team if the shooting doesn’t follow.
In the end, these three stats paint a nuanced portrait of the Phoenix Suns: a talented team, sometimes frustrating, but always fascinating. This is not a linear team. It’s a team of peaks and valleys, of runs, of stretches where everything clicks and others where nothing falls. A team that can beat anyone… and make life difficult against anyone.
So the question isn’t whether the Suns are good. They are. The real question is which version of themselves they’ll choose to show when the pressure rises. And let’s not forget: this is the first year of this group. The best is still ahead. I trust everyone within the franchise. See you for the game against the Clippers (yes, another Sunday with me…).