
Series Roadmap
Part 0: Inside the Evaluation
Part I: Game Grades
You are here ➡️ Part II: True Passer Rating
Part III: On-Target Rate, Coming March 28th
Part IV: 2024 → 2025 Growth, Coming April 1st
Part V: 2025 In Conclusion, Coming April 4th
A (semi) brief explanation of TPR

The True Passer Rating, or TPR, is a custom metric I created after the 2024 NFL season. I have always had a distaste for the NFL’s standard passer rating, which feels antiquated, and ESPN’s QBR, which is proprietary and hard to fully evaluate. It was not until I came across
a Secret Base video titled “Correcting the NFL’s passer rating lie” that I felt motivated to build something of my own. The goal was simple, create a metric that could properly quantify quarterback performance on a game to game basis.
After months of tinkering with the base passer rating formula to the point where it was almost completely unrecognizable, and layering in additional variables, I finally landed on a version I was comfortable with. TPR incorporates interceptions and fumbles, at fault sacks, and average depth of target into the equation. It took over 50 versions to get to where I wanted it.

If you are familiar with baseball analytics, TPR is trying to accomplish something similar to wRC+. It looks to measure the total offensive value of a quarterback using 100 as the baseline for league average. So if a quarterback posts a TPR of 117.5, that means he performed 17.5% better than a league average quarterback in that game. In theory the scale is unlimited in both directions, but in practice most performances fall between 0 and 150, with extreme outliers pushing beyond that range.
For example, New England Patriots quarterback Drake Maye posted a 239.7 TPR in Week 17 against the New York Jets, going 19 of 21 for 256 yards, 5 touchdowns, and an 8.6 ADOT. On the other end, New York Jets quarterback Justin Fields recorded a -53.9 TPR in Week 6 against the Denver Broncos, a game where he finished with negative net passing yards and took 9 sacks.
At its core, TPR is built to capture a quarterback’s ability to create explosive plays and maintain efficiency, while limiting mistakes and staying accurate.
That balance is driven largely by the ADOT component, which acts as a bonus slider centered around the league average of 7.0. The further above 7.0 a quarterback pushes, the more the bonus helps, so long as they limit mistakes and maintain accuracy.
At the same time, there are safeguards in place to prevent the metric from being exploited.
The ADOT bonus is reduced for inaccuracy, specifically when a quarterback completes less than 55% of his passes. Any completion percentage below 55% will automatically halve the bonus.
There is also a penalty for operating below a 7.0 ADOT, and that penalty becomes more severe the further a quarterback drops below that mark. This shifts the emphasis away from yards per attempt (YPA), which is a major driver in the traditional passer rating and can be gamed, and places more weight on how those yards are actually generated. YPA still matters, but it is weighted less heavily, with additional penalties for extremely low efficiency, specifically below 5.5 YPA.
At fault sacks are another key factor. Once a quarterback moves beyond one, each additional sack carries a compounding penalty that can quickly drag down a performance.
That is the quick version of TPR. If you are interested in a deeper breakdown, including the full math behind the formula, you can check that out here.
I have also put together full league breakdowns for both the 2024 and 2025 NFL seasons if you want to explore how TPR evaluates quarterbacks across a full year.
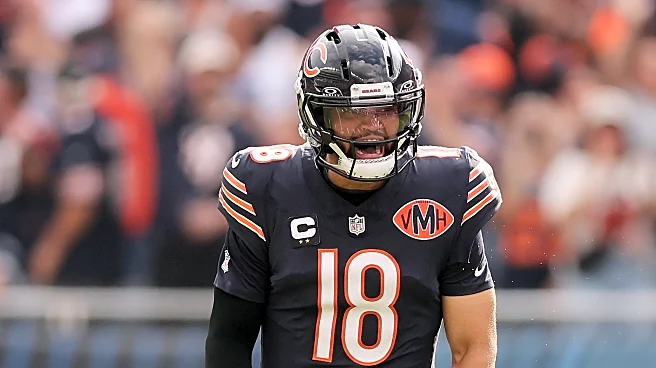
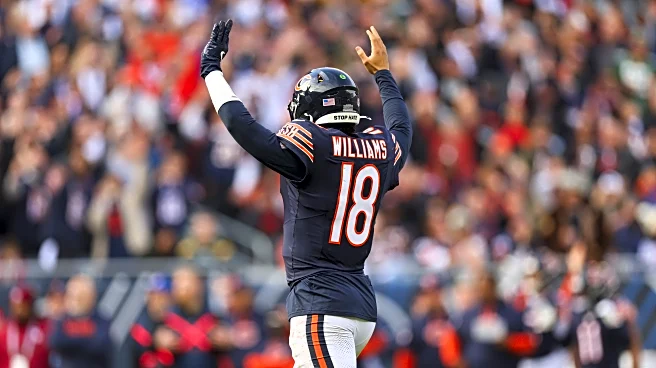
With that out of the way, let’s get into it. As with Part I, we will split the season into four quarters, break down each segment, and then evaluate how Caleb Williams stacks up against his peers.
One important note, and a current limitation of TPR, is that it works best as a game to game metric. When you try to scale it up to larger sample sizes, the results start to get a bit muddled. A big reason for that is ADOT, which tends to fall within a pretty tight range across the league over the course of a full season, usually within about 2.5 yards.
Because of that, the separation you see on a game level does not always carry over cleanly when you aggregate things over a full year.
As it stands, I use average TPR as my primary seasonal measure while I continue working toward a better solution for evaluating full season performance.
Finally, Quarterly TPR scores for Caleb Williams will be presented along with the 6 other quarterbacks I graded in 2025, to add additional context.
1st Quarter Split (Weeks 1-5)

Average TPR: 132.8
Best Game: Week 3, vs. Dallas (187.7 TPR)
19/28 298 yards, 4 TD, 0 INT, 0 FUM, 0 Sacks, 9.2 ADOT, 142.6 Passer Rating
Worst Game: Week 4, @ Las Vegas (104.1 TPR)
22/37 212 yards, 1 TD, 1 INT, 0 FUM, 0 Sacks, 7.6 ADOT, 73.3 Passer Rating
A common trend in 2025 was that opposing quarterbacks often had some of their best TPR performances against the Dallas Cowboys defense. For Williams, that held true as well. His season high 187.7 TPR came against Dallas and gave a noticeable boost to his overall numbers in this split. In the three games outside of that matchup, he posted a respectable 114.5 average TPR.
Williams averaged an 8.5 ADOT over the first four weeks of the season, with none of those starts dipping below 7.0. Over the full year, he had just one game under that mark, a Week 14 loss at Green Bay where he posted a 6.9 ADOT.
Out of his 130 pass attempts in this stretch, 46 traveled 10 or more yards, good for a 35.4% rate. That lines up closely with his season average of 34.7% in 2025 and helped keep his ADOT elevated throughout this span. Pair that with a 62.3% completion percentage, with no start dipping below 55%, he was able to take full advantage of the ADOT bonus component.
Overall, it was a strong start to the season for Williams as he posted his highest average TPR of any split in 2025, aided of course by the Cowboys defense. He pushed the ball downfield effectively while keeping mistakes in check, finishing the stretch with just 2 interceptions and 3 at fault sacks.
2nd Quarter Split (Weeks 6-9)

Average TPR: 127.3
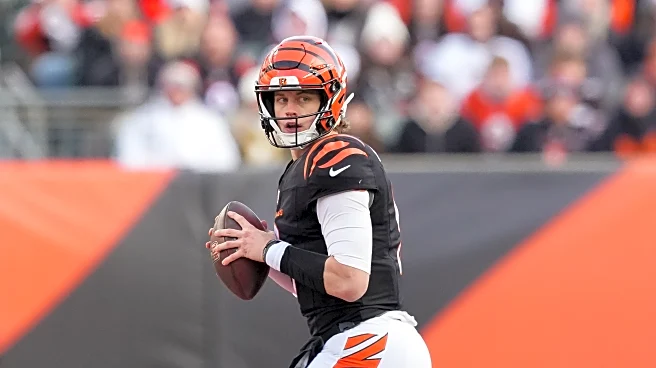
Best Game: Week 9, @ Cincinnati (150.2 TPR)
20/34 280 yards, 3 TD, 0 INT, 0 FUM, 1 Sack, 9.0 ADOT, 114.8 Passer Rating
Worst Game: Week 7, vs. New Orleans (104.1 TPR)
15/26 182 yards, 0 TD, 1 INT, 0 FUM, 1 Sack, 9.2 ADOT, 61.7 Passer Rating
Entering the second split of the season, this was Caleb Williams’ second lowest graded stretch. He played three road games during this span and hosted a tough Saints defense in the sixth game of the year.
Even in what was considered his toughest stretch, both by grading and general discourse, he still produced a 119.7 average TPR before his breakout performance against Cincinnati, where he posted a 150.2.
Williams continued to push the ball downfield effectively, increasing his ADOT from 8.5 in the first split to 8.9 here. His lowest ADOT during this stretch was still a strong 8.5, which came in the walk off win against the Washington Commanders.
Across 127 pass attempts, 40 traveled 10 or more yards, dropping his intermediate and deep rate to 31.5%. Even with that dip, the rise in overall ADOT suggests that a large portion of his shorter throws were still pushing into the 8 plus yard range, keeping his overall aggressiveness intact.
His completion percentage dipped slightly to 60.6%, but all four starts remained above 55%, allowing him to retain the full benefit of the ADOT component. That small drop can likely be attributed to the increase in depth of target, as deeper throws are naturally harder to complete. Throwaways also played a role, as he had eight in this stretch compared to just two in the first split.
Like most of his season, Williams continued to limit mistakes. He turned the ball over just twice and took four at fault sacks during this stretch.
3rd Quarter Split (Weeks 10-13)

Average TPR: 115.4
Best Game: Week 10, vs. Giants (135.2 TPR)
20/36 220 yards, 1 TD, 0 INT, 0 FUM, 0 Sacks, 11.0 ADOT, 83.1 Passer Rating
Worst Game: Week 13, @ Philadelphia (80.4 TPR)
17/36 154 yards, 1 TD, 1 INT, 0 FUM, 1 Sacks, 7.5 ADOT, 56.9 Passer Rating
Entering the third split, we see Caleb’s average ADOT jump to 9.7, his highest mark of the 2025 season. That comes despite a 7.5 ADOT in Week 12 against the Eagles, a game played in frigid and windy conditions that still ended in a win.
Of his 139 pass attempts in this stretch, 51 traveled 10 or more yards, including 18 attempts beyond 20 yards. His 36.7% intermediate and deep rate was his highest of the season. However, he completed just 4 of those 18 deep attempts, a 22.2% rate, making this easily his toughest stretch throwing the ball downfield.
That struggle shows up in his overall efficiency as well. Williams completed just 51.8% of his passes during this split and topped 55% in only one game, which came in game nine against the Giants. That drop in efficiency weighed down his TPR in three of the four games during this stretch.
It is also worth noting the context. Williams had 9 passes dropped by receivers in this span and threw the ball away 12 times, both of which played a role in the dip in completion percentage. Both of these numbers, over the back half of the season, saw marked increased which played a factor in the completion percentage narrative.
The trend of limiting mistakes continued, though. He turned the ball over just twice and took only four at fault sacks across these four games.
This stretch also feels like the point where the playbook opened up a bit more. The offense leaned more heavily into attacking the intermediate and deep areas of the field. While the raw completion percentage on deep throws sat at just 22.2%, his on target rate was much stronger at 56.3%, with 9 of his 16 deep attempts deemed catchable.
We will dive deeper into on target throwing in the next part of the series coming this weekend.
4th Quarter Split (Weeks 14-18)

Average TPR: 127.2
Best Game: Week 15, vs. Cleveland (149.7 TPR)
17/28 242 yards, 2 TD, 0 INT, 0 FUM, 2 Sacks, 11.2 ADOT, 112.5 Passer Rating
Worst Game: Week 14, vs. Green Bay (94.0 TPR)
19/35 186 yards, 2 TD, 1 INT, 0 FUM, 0 Sacks, 6.9 ADOT, 76.6 Passer Rating
The home stretch of the regular season is where Caleb Williams played some of his most consistent football of the year. Even with a 94.0 TPR in Week 13 on the road against the Packers, he closed out the 2025 campaign averaging 135.6 TPR over his final four games, with three of those performances clearing the 125 mark.
Out of his 172 pass attempts in this final split, 60 traveled 10 or more yards, good for a 34.9% rate, almost identical to his 2025 season average of 34.7%. His completion percentage settled in at 58.2%, essentially mirroring his season mark of 58.1%. The only game below 55% came in that Week 13 loss at Green Bay, where his ADOT also dipped to 6.9, just under the league average. That combination resulted in just his second sub 100 TPR performance of the season.
Outside of that dip, his aggressiveness remained strong. He finished the split with an 8.8 ADOT, highlighted by back to back marks of 11.2 and 10.2 against the Browns and then the Packers at home.
Throwaways rose to 20 across this five game stretch, averaging four per game, and Bears receivers added another nine drops. That brought the total to 19 drops over the final nine games of the season, compared to just 10 over the first eight, which again provides some context for the efficiency numbers.
And just like the rest of his season, mistake mitigation held steady. Williams turned the ball over only twice and was at fault for just three sacks over the final five games.
The Full Picture: Season Profile & Peer Context
The great thing about TPR is that we can look at it both through the lens of the seven quarterbacks I graded and from a league-wide perspective. That, in turn, gives us a much larger pool of data points to compare Caleb Williams against.

In 2025, 66 different quarterbacks started games in the NFL, with average TPRs ranging from 192.2 by Malik Willis in his lone start all the way down to -89.0, posted by Clayton Tune, also in just one start. Side note, how strange is it that Green Bay Packers quarterbacks are at both ends of that spectrum, and neither one of them is Jordan Love?
The league average of TPR came in at 94.0. That means league quarterback play, on average, actually fell below the 100 TPR threshold designated as league average. This lines up with the broader trend of declining quarterback play, as passing yards, touchdowns, and average passer rating, among other categories, have all taken a bit of a hit over the last half decade.
Caleb Williams ultimately finished third among the seven quarterbacks I graded, posting a 125.8 average TPR. That makes him one of just nine quarterbacks in the last two seasons to finish a season above 125.0 TPR. His 125.8 mark ranks sixth best in the league in 2025, trailing Drake Maye (148.8), Matthew Stafford (145.0), Jordan Love (136.2), Dak Prescott (127.1), and Brock Purdy (125.9).
That near top-5 finish is backed up by his performance pushing the ball downfield. He finished ninth in deep throws in 2025 with a 49.3% adjusted completion percentage, along with fifth in PFF deep ball grade, second in deep big-time throws, seventh in overall ADOT, tied for 11th in big-time throw rate, tied for sixth in total big-time throws, and tied for first in deep touchdown passes.
On top of that, he posted an impressive 10.8% pressure-to-sack rate, good for second best in the NFL. He also finished tied for 11th in turnover-worthy play rate and ranked first in interception percentage among quarterbacks with at least 10 starts, at a sparkling 1.1%.
Hitting big plays consistently while limiting mistakes like turnovers and at-fault sacks plays a huge role in TPR calculations, and Williams excelled in both areas in 2025.

He also tied for the lead among graded quarterbacks in percentage of starts with a TPR above 100, which also matched the league lead. Matthew Stafford joined Drake Maye and Caleb Williams as the only quarterbacks to post a TPR above 100 in 15 of 17 starts during the 2025 regular season.
That level of consistency, pushing the ball downfield while limiting mistakes through fewer sacks and turnovers, bodes well for the young quarterback as he continue to grow into one his position while leading one of the league’s top offenses. This is already a unit that finished top five in explosive plays in 2025, despite dealing with the inconsistencies of a first-year offense.

On a week-to-week basis, Williams performed about 16.8% better than the league’s weekly average TPR. That is an encouraging number for a second-year quarterback playing in his second offense in as many years, all while learning to operate under center at a level he had never reached before in his career.
He outperformed the weekly league TPR average in 12 of 17 games in 2025. In three of those games, the difference was 4.4 TPR or less, meaning he was still right in line with league performance. By and large, Williams stayed ahead of the curve when it comes to TPR.
So to summarize:
- Third highest average TPR among graded quarterbacks
- Sixth highest average TPR in the league
- Tied for best rate of starts above 100 TPR
All of this came in just his second season, following what was essentially a throwaway 2024. The ceiling is as high as Caleb Williams can push it. With his offseason focus on improving accuracy, that growth should only accelerate his rise into the top tier of NFL quarterbacks.
And fittingly, accuracy is exactly what we will dive into in Part III, where the data from 2025 already suggests that offseason focus may have already started to pay off in the 2025 regular season.
Gary Baugher Jr. is a rookie contributor to WCG, bringing football insight backed by over 16 years of experience in organized football and more than 30 years as a passionate fan of the game. You can follow him on Twitter at @iamcogs.