Garbage time came quickly
Play Map: Alabama body { font-family: -apple-system, BlinkMacSystemFont, 'Segoe UI', 'Roboto', sans-serif; margin: 0; padding: 20px; background: #f8fafc; } .chart-container { background: white; border-radius: 12px; border: 1px solid #e5e5e5; box-shadow: 0 1px 3px rgba(0, 0, 0, 0.1); overflow: hidden; } .chart-header { padding: 18px 24px 16px; border-bottom: 1px solid #e5e5e5; background: white; } .chart-title { font-size: 18px; font-weight: 600; color: #171717; margin: 0; } .chart-content { padding: 20px 24px 24px !important; } @media (max-width: 640px) { .chart-content { padding: 12px 16px 20px !important; } .chart-header { padding: 12px 16px 12px !important; } .embed-footer-top { padding: 8px 12px !important; } .data-definitions { padding: 12px !important; } body { padding: 12px !important; } } .chart-content.top-receivers { height: 624px; } .chart-content.top-passers { height: 280px !important; } .chart-content.top-rushers { height: 372px; } .chart-content:not(.top-receivers):not(.top-passers):not(.top-rushers) { height: 372px; } .embed-footer { border-top: 1px solid #e5e5e5; font-size: 12px; color: #737373; } .embed-footer-top { display: flex; justify-content: space-between; align-items: center; padding: 12px 16px; } .embed-footer-link { color: #737373; text-decoration: none; font-weight: 500; } .embed-footer-link:hover { color: #525252; text-decoration: underline; } .data-definitions-toggle { background: none; border: none; color: #737373; font-size: 12px; font-weight: 500; cursor: pointer; display: flex; align-items: center; gap: 4px; padding: 0; } .data-definitions-toggle:hover { color: #525252; } .caret { transition: transform 0.2s ease; font-size: 10px; } .caret.expanded { transform: rotate(180deg); } .data-definitions { display: none; padding: 16px; background: #fafafa; border-top: 1px solid #e5e5e5; font-size: 12px; line-height: 1.4; } .data-definitions.expanded { display: block; } .data-definitions ul { margin: 0; padding-left: 0; list-style: none; } .data-definitions li { margin-bottom: 4px; }
// Toggle data definitions accordion - unique function per embed function toggleDefinitions_cfb_chart_1757875494538_i34fnqx2r() { const definitions = document.getElementById('dataDefinitions_cfb-chart-1757875494538-i34fnqx2r'); const caret = document.getElementById('caret_cfb-chart-1757875494538-i34fnqx2r'); if (definitions.classList.contains('expanded')) { definitions.classList.remove('expanded'); caret.classList.remove('expanded'); } else { definitions.classList.add('expanded'); caret.classList.add('expanded'); } } // WordPress-safe chart initialization with defensive checks (function() { 'use strict'; function initChart() { // Check if Chart.js is available if (typeof Chart === 'undefined') { console.warn('Chart.js not loaded yet, retrying...'); setTimeout(initChart, 100); return; } // Check if datalabels plugin is available if (typeof ChartDataLabels === 'undefined') { console.warn('ChartDataLabels plugin not loaded yet, retrying...'); setTimeout(initChart, 100); return; } // Check if canvas element exists const canvas = document.getElementById('cfb-chart-1757875494538-i34fnqx2r'); if (!canvas) { console.warn('Canvas element not found yet, retrying...'); setTimeout(initChart, 100); return; } // Prevent multiple chart instances if (canvas.chartInstance) { console.log('Chart already initialized'); return; } try { // Register the datalabels plugin Chart.register(ChartDataLabels); // Embed actual chart data directly const chartData = { "datasets": [ { "label": " d.label && d.label.includes(' SR') && !d.label.includes('NCAA')); // If this is the first team's SR dataset, use teamCounts if (teamSRDataset && context.dataset.label === teamSRDataset.label && chartData.teamCounts) { return chartData.teamCounts[context.dataIndex] || 0; } // Otherwise, use oppCounts for the second team else if (chartData.oppCounts) { return chartData.oppCounts[context.dataIndex] || 0; } } // For player charts, show value only if > 0 (matches non-embedded behavior) if ('team-play-map'.includes('top-rushers') || 'team-play-map'.includes('top-passers') || 'team-play-map'.includes('top-receivers')) { // Hide data labels for zero or negative values, show actual value for positive values return value > 0 ? value : null; } // For other charts, show values based on type if (typeof value === 'number') { // If value is between 0 and 1, treat as percentage if (value >= 0 && value 0 ? '#26262660' : 'transparent'; }, borderColor: function(context) { const value = context.dataset.data[context.dataIndex]; return value > 0 ? 'rgba(255, 255, 255, 0.2)' : 'transparent'; }, borderRadius: 4, align: 'center', anchor: 'center' }, legend: 'line' === 'line' ? { position: 'top', align: 'start', labels: 'team-play-map'.includes('play-map') ? { usePointStyle: true, generateLabels: function(chart) { // Call the original generateLabels to get default styling const original = Chart.defaults.plugins.legend.labels.generateLabels; const labels = original.call(this, chart); // Filter and customize each label const filteredLabels = labels.filter(label => { return !label.text.includes(' { const dataset = chart.data.datasets[label.datasetIndex]; if (dataset && dataset.label) { if (dataset.label.includes('Rush')) { label.pointStyle = 'circle'; label.pointStyleWidth = 4; label.fillStyle = 'white'; } else if (dataset.label.includes('Pass')) { label.pointStyle = 'triangle'; label.pointStyleWidth = 4; label.fillStyle = 'white'; } else { label.pointStyle = 'rect'; label.pointStyleWidth = 4; label.fillStyle = 'white'; } } }); return filteredLabels; }, boxWidth: 20, padding: 12 } : { usePointStyle: false, boxWidth: 12, boxHeight: 12, padding: 12, generateLabels: function(chart) { const original = Chart.defaults.plugins.legend.labels.generateLabels; const labels = original.call(this, chart); // Filter out reference areas and ensure white fill const filteredLabels = labels.filter(label => { return !label.text.includes('NCAA Avg SR') && !label.text.includes('50/50') && !label.text.includes('Quarters'); }); // Ensure white fill for all line chart legend boxes filteredLabels.forEach((label) => { label.fillStyle = 'white'; }); return filteredLabels; } } } : { position: 'top', align: 'start', labels: { usePointStyle: false, boxWidth: 12, boxHeight: 12, padding: 12, filter: function(legendItem, chartData) { return !legendItem.text.includes('NCAA Avg SR') && !legendItem.text.includes('Quarters') && !legendItem.text.includes('50/50'); }, generateLabels: function(chart) { const data = chart.data; if (data.datasets.length) { return data.datasets.map((dataset, i) => { // Handle backgroundColor arrays (like in Overall Team Performance chart) let fillColor = dataset.backgroundColor; if (dataset.label === '# Plays') { fillColor = 'white'; } else if (Array.isArray(dataset.backgroundColor)) { // For datasets with backgroundColor arrays, use the first color for legend fillColor = dataset.backgroundColor[0]; } return { text: dataset.label, fillStyle: fillColor, strokeStyle: dataset.label === '# Plays' ? '#666' : dataset.borderColor, lineWidth: dataset.label === '# Plays' ? 1 : dataset.borderWidth, hidden: !chart.isDatasetVisible(i), datasetIndex: i }; }).filter((item, index) => { // Apply the same filter logic as above const dataset = chart.data.datasets[index]; if (!dataset || !dataset.data) return false; if (dataset.label === '# Plays') return true; // Always show # Plays if (dataset.label && (dataset.label.includes('NCAA Avg SR') || dataset.label.includes('Quarters') || dataset.label.includes('50/50'))) return false; return dataset.data.some((value) => value > 0); }); } return []; } } }, tooltip: { filter: function(tooltipItem) { if ('team-play-map'.includes('play-map')) { return !tooltipItem.dataset.label.includes('< 0') && !tooltipItem.dataset.label.includes('Quarters') && !tooltipItem.dataset.label.includes('Drive'); } return !tooltipItem.dataset.label.includes('NCAA Avg SR') && !tooltipItem.dataset.label.includes('50/50') && !tooltipItem.dataset.label.includes('< 0') && !tooltipItem.dataset.label.includes('Quarters'); }, callbacks: { label: function(context) { const label = context.dataset.label || ''; let labelText; // Play maps show yards instead of percentages if ('team-play-map'.includes('play-map')) { labelText = label + ': ' + context.parsed.y + ' yards'; } else { const value = Math.round(context.parsed.y * 100); labelText = label + ': ' + value + '%'; } // For line charts, include play text if available if ('line' === 'line' && context.raw && context.raw.text) { return [labelText, context.raw.text]; } return labelText; } } } }, scales: 'line' === 'line' ? 'team-play-map'.includes('play-map') ? { x: { type: 'linear', position: 'bottom', title: { display: true, text: 'Play Number' }, min: 1, ticks: { stepSize: 1, callback: function(value) { return Math.floor(value); } }, grid: { display: false } }, y: { title: { display: true, text: 'Yards Gained' }, min: chartData.minY, max: chartData.maxY } } : { x: { type: 'linear', position: 'bottom', title: { display: true, text: 'team-play-map'.includes('team-lines') ? 'Play Number' : 'Team Play Number' }, min: 1, ticks: { stepSize: 1, callback: function(value) { return Math.floor(value); } }, grid: { display: false } }, y: { max: 1, min: 0, ticks: { callback: function(value) { return Math.round(value * 100) + '%'; } } } } : 'team-play-map'.includes('drive-metrics') ? { y: { stacked: false, max: 1, ticks: { callback: function(value) { return Math.round(value * 100) + '%'; } } }, y1: { display: false, type: 'linear', position: 'right' } } : ('team-play-map'.includes('top-rushers') || 'team-play-map'.includes('top-passers') || 'team-play-map'.includes('top-receivers')) ? { x: { stacked: true }, y: { stacked: true } } : { y: { max: 1, min: 0, stacked: false, ticks: { callback: function(value) { return Math.round(value * 100) + '%'; } } } } }; // Add indexAxis for player charts if ('team-play-map'.includes('top-rushers') || 'team-play-map'.includes('top-passers') || 'team-play-map'.includes('top-receivers')) { chartOptions.indexAxis = 'y'; } // Initialize the chart const ctx = canvas.getContext('2d'); const chart = new Chart(ctx, { type: 'line', data: chartData, options: chartOptions }); // Store reference to prevent re-initialization canvas.chartInstance = chart; console.log('CFB Chart initialized successfully'); } catch (error) { console.error('Error initializing CFB chart:', error); // Fallback: show error message in canvas container const container = document.getElementById('cfb-chart-1757875494538-i34fnqx2r').parentNode; if (container) { container.innerHTML = '
Chart failed to load. Please refresh the page.
'; } } } // Initialize when DOM is ready if (document.readyState === 'loading') { document.addEventListener('DOMContentLoaded', initChart); } else { initChart(); } // Also try initialization after a short delay for WordPress compatibility setTimeout(initChart, 500); })();
Let’s start with the Play Map this week: it took a few plays to really get going, but these drives were taking off in no time. As soon as he got a few unsuccessful passes out of his system (short pass to Kevin
Riley, incomplete to Germie), Ty Simpson was ready to sling it. 6 explosive pass plays in the first half had us riding pretty high going into halftime, but then we followed it up with a huge passing plays to open the 2nd half … and then another 3 explosive passes in the 3rd quarter.
What a rally. This was a passing clinic against what appears to be a pretty respectable defense (at least considering levels of talent).
Play Map: Wisconsin body { font-family: -apple-system, BlinkMacSystemFont, 'Segoe UI', 'Roboto', sans-serif; margin: 0; padding: 20px; background: #f8fafc; } .chart-container { background: white; border-radius: 12px; border: 1px solid #e5e5e5; box-shadow: 0 1px 3px rgba(0, 0, 0, 0.1); overflow: hidden; } .chart-header { padding: 18px 24px 16px; border-bottom: 1px solid #e5e5e5; background: white; } .chart-title { font-size: 18px; font-weight: 600; color: #171717; margin: 0; } .chart-content { padding: 20px 24px 24px !important; } @media (max-width: 640px) { .chart-content { padding: 12px 16px 20px !important; } .chart-header { padding: 12px 16px 12px !important; } .embed-footer-top { padding: 8px 12px !important; } .data-definitions { padding: 12px !important; } body { padding: 12px !important; } } .chart-content.top-receivers { height: 624px; } .chart-content.top-passers { height: 280px !important; } .chart-content.top-rushers { height: 372px; } .chart-content:not(.top-receivers):not(.top-passers):not(.top-rushers) { height: 372px; } .embed-footer { border-top: 1px solid #e5e5e5; font-size: 12px; color: #737373; } .embed-footer-top { display: flex; justify-content: space-between; align-items: center; padding: 12px 16px; } .embed-footer-link { color: #737373; text-decoration: none; font-weight: 500; } .embed-footer-link:hover { color: #525252; text-decoration: underline; } .data-definitions-toggle { background: none; border: none; color: #737373; font-size: 12px; font-weight: 500; cursor: pointer; display: flex; align-items: center; gap: 4px; padding: 0; } .data-definitions-toggle:hover { color: #525252; } .caret { transition: transform 0.2s ease; font-size: 10px; } .caret.expanded { transform: rotate(180deg); } .data-definitions { display: none; padding: 16px; background: #fafafa; border-top: 1px solid #e5e5e5; font-size: 12px; line-height: 1.4; } .data-definitions.expanded { display: block; } .data-definitions ul { margin: 0; padding-left: 0; list-style: none; } .data-definitions li { margin-bottom: 4px; }
// Toggle data definitions accordion - unique function per embed function toggleDefinitions_cfb_chart_1757875512744_m46bkjcd4() { const definitions = document.getElementById('dataDefinitions_cfb-chart-1757875512744-m46bkjcd4'); const caret = document.getElementById('caret_cfb-chart-1757875512744-m46bkjcd4'); if (definitions.classList.contains('expanded')) { definitions.classList.remove('expanded'); caret.classList.remove('expanded'); } else { definitions.classList.add('expanded'); caret.classList.add('expanded'); } } // WordPress-safe chart initialization with defensive checks (function() { 'use strict'; function initChart() { // Check if Chart.js is available if (typeof Chart === 'undefined') { console.warn('Chart.js not loaded yet, retrying...'); setTimeout(initChart, 100); return; } // Check if datalabels plugin is available if (typeof ChartDataLabels === 'undefined') { console.warn('ChartDataLabels plugin not loaded yet, retrying...'); setTimeout(initChart, 100); return; } // Check if canvas element exists const canvas = document.getElementById('cfb-chart-1757875512744-m46bkjcd4'); if (!canvas) { console.warn('Canvas element not found yet, retrying...'); setTimeout(initChart, 100); return; } // Prevent multiple chart instances if (canvas.chartInstance) { console.log('Chart already initialized'); return; } try { // Register the datalabels plugin Chart.register(ChartDataLabels); // Embed actual chart data directly const chartData = { "datasets": [ { "label": " d.label && d.label.includes(' SR') && !d.label.includes('NCAA')); // If this is the first team's SR dataset, use teamCounts if (teamSRDataset && context.dataset.label === teamSRDataset.label && chartData.teamCounts) { return chartData.teamCounts[context.dataIndex] || 0; } // Otherwise, use oppCounts for the second team else if (chartData.oppCounts) { return chartData.oppCounts[context.dataIndex] || 0; } } // For player charts, show value only if > 0 (matches non-embedded behavior) if ('opponent-play-map'.includes('top-rushers') || 'opponent-play-map'.includes('top-passers') || 'opponent-play-map'.includes('top-receivers')) { // Hide data labels for zero or negative values, show actual value for positive values return value > 0 ? value : null; } // For other charts, show values based on type if (typeof value === 'number') { // If value is between 0 and 1, treat as percentage if (value >= 0 && value 0 ? '#26262660' : 'transparent'; }, borderColor: function(context) { const value = context.dataset.data[context.dataIndex]; return value > 0 ? 'rgba(255, 255, 255, 0.2)' : 'transparent'; }, borderRadius: 4, align: 'center', anchor: 'center' }, legend: 'line' === 'line' ? { position: 'top', align: 'start', labels: 'opponent-play-map'.includes('play-map') ? { usePointStyle: true, generateLabels: function(chart) { // Call the original generateLabels to get default styling const original = Chart.defaults.plugins.legend.labels.generateLabels; const labels = original.call(this, chart); // Filter and customize each label const filteredLabels = labels.filter(label => { return !label.text.includes(' { const dataset = chart.data.datasets[label.datasetIndex]; if (dataset && dataset.label) { if (dataset.label.includes('Rush')) { label.pointStyle = 'circle'; label.pointStyleWidth = 4; label.fillStyle = 'white'; } else if (dataset.label.includes('Pass')) { label.pointStyle = 'triangle'; label.pointStyleWidth = 4; label.fillStyle = 'white'; } else { label.pointStyle = 'rect'; label.pointStyleWidth = 4; label.fillStyle = 'white'; } } }); return filteredLabels; }, boxWidth: 20, padding: 12 } : { usePointStyle: false, boxWidth: 12, boxHeight: 12, padding: 12, generateLabels: function(chart) { const original = Chart.defaults.plugins.legend.labels.generateLabels; const labels = original.call(this, chart); // Filter out reference areas and ensure white fill const filteredLabels = labels.filter(label => { return !label.text.includes('NCAA Avg SR') && !label.text.includes('50/50') && !label.text.includes('Quarters'); }); // Ensure white fill for all line chart legend boxes filteredLabels.forEach((label) => { label.fillStyle = 'white'; }); return filteredLabels; } } } : { position: 'top', align: 'start', labels: { usePointStyle: false, boxWidth: 12, boxHeight: 12, padding: 12, filter: function(legendItem, chartData) { return !legendItem.text.includes('NCAA Avg SR') && !legendItem.text.includes('Quarters') && !legendItem.text.includes('50/50'); }, generateLabels: function(chart) { const data = chart.data; if (data.datasets.length) { return data.datasets.map((dataset, i) => { // Handle backgroundColor arrays (like in Overall Team Performance chart) let fillColor = dataset.backgroundColor; if (dataset.label === '# Plays') { fillColor = 'white'; } else if (Array.isArray(dataset.backgroundColor)) { // For datasets with backgroundColor arrays, use the first color for legend fillColor = dataset.backgroundColor[0]; } return { text: dataset.label, fillStyle: fillColor, strokeStyle: dataset.label === '# Plays' ? '#666' : dataset.borderColor, lineWidth: dataset.label === '# Plays' ? 1 : dataset.borderWidth, hidden: !chart.isDatasetVisible(i), datasetIndex: i }; }).filter((item, index) => { // Apply the same filter logic as above const dataset = chart.data.datasets[index]; if (!dataset || !dataset.data) return false; if (dataset.label === '# Plays') return true; // Always show # Plays if (dataset.label && (dataset.label.includes('NCAA Avg SR') || dataset.label.includes('Quarters') || dataset.label.includes('50/50'))) return false; return dataset.data.some((value) => value > 0); }); } return []; } } }, tooltip: { filter: function(tooltipItem) { if ('opponent-play-map'.includes('play-map')) { return !tooltipItem.dataset.label.includes('< 0') && !tooltipItem.dataset.label.includes('Quarters') && !tooltipItem.dataset.label.includes('Drive'); } return !tooltipItem.dataset.label.includes('NCAA Avg SR') && !tooltipItem.dataset.label.includes('50/50') && !tooltipItem.dataset.label.includes('< 0') && !tooltipItem.dataset.label.includes('Quarters'); }, callbacks: { label: function(context) { const label = context.dataset.label || ''; let labelText; // Play maps show yards instead of percentages if ('opponent-play-map'.includes('play-map')) { labelText = label + ': ' + context.parsed.y + ' yards'; } else { const value = Math.round(context.parsed.y * 100); labelText = label + ': ' + value + '%'; } // For line charts, include play text if available if ('line' === 'line' && context.raw && context.raw.text) { return [labelText, context.raw.text]; } return labelText; } } } }, scales: 'line' === 'line' ? 'opponent-play-map'.includes('play-map') ? { x: { type: 'linear', position: 'bottom', title: { display: true, text: 'Play Number' }, min: 1, ticks: { stepSize: 1, callback: function(value) { return Math.floor(value); } }, grid: { display: false } }, y: { title: { display: true, text: 'Yards Gained' }, min: chartData.minY, max: chartData.maxY } } : { x: { type: 'linear', position: 'bottom', title: { display: true, text: 'opponent-play-map'.includes('team-lines') ? 'Play Number' : 'Team Play Number' }, min: 1, ticks: { stepSize: 1, callback: function(value) { return Math.floor(value); } }, grid: { display: false } }, y: { max: 1, min: 0, ticks: { callback: function(value) { return Math.round(value * 100) + '%'; } } } } : 'opponent-play-map'.includes('drive-metrics') ? { y: { stacked: false, max: 1, ticks: { callback: function(value) { return Math.round(value * 100) + '%'; } } }, y1: { display: false, type: 'linear', position: 'right' } } : ('opponent-play-map'.includes('top-rushers') || 'opponent-play-map'.includes('top-passers') || 'opponent-play-map'.includes('top-receivers')) ? { x: { stacked: true }, y: { stacked: true } } : { y: { max: 1, min: 0, stacked: false, ticks: { callback: function(value) { return Math.round(value * 100) + '%'; } } } } }; // Add indexAxis for player charts if ('opponent-play-map'.includes('top-rushers') || 'opponent-play-map'.includes('top-passers') || 'opponent-play-map'.includes('top-receivers')) { chartOptions.indexAxis = 'y'; } // Initialize the chart const ctx = canvas.getContext('2d'); const chart = new Chart(ctx, { type: 'line', data: chartData, options: chartOptions }); // Store reference to prevent re-initialization canvas.chartInstance = chart; console.log('CFB Chart initialized successfully'); } catch (error) { console.error('Error initializing CFB chart:', error); // Fallback: show error message in canvas container const container = document.getElementById('cfb-chart-1757875512744-m46bkjcd4').parentNode; if (container) { container.innerHTML = '
Chart failed to load. Please refresh the page.
'; } } } // Initialize when DOM is ready if (document.readyState === 'loading') { document.addEventListener('DOMContentLoaded', initChart); } else { initChart(); } // Also try initialization after a short delay for WordPress compatibility setTimeout(initChart, 500); })();
The Wiscy Play Map is essentially the opposite. While Alabama slowed down going into “garbage time”, Wisconsin finally found some efficiency in the second half — perhaps against backups and some vanilla defense, who knows). But, indeed, we were already into “garbage time” coming out of halftime given how Alabama’s offense was scoring (special teams TD’s nonwithstanding).
SR and XR by Team body { font-family: -apple-system, BlinkMacSystemFont, 'Segoe UI', 'Roboto', sans-serif; margin: 0; padding: 20px; background: #f8fafc; } .chart-container { background: white; border-radius: 12px; border: 1px solid #e5e5e5; box-shadow: 0 1px 3px rgba(0, 0, 0, 0.1); overflow: hidden; } .chart-header { padding: 18px 24px 16px; border-bottom: 1px solid #e5e5e5; background: white; } .chart-title { font-size: 18px; font-weight: 600; color: #171717; margin: 0; } .chart-content { padding: 20px 24px 24px !important; } @media (max-width: 640px) { .chart-content { padding: 12px 16px 20px !important; } .chart-header { padding: 12px 16px 12px !important; } .embed-footer-top { padding: 8px 12px !important; } .data-definitions { padding: 12px !important; } body { padding: 12px !important; } } .chart-content.top-receivers { height: 624px; } .chart-content.top-passers { height: 280px !important; } .chart-content.top-rushers { height: 372px; } .chart-content:not(.top-receivers):not(.top-passers):not(.top-rushers) { height: 372px; } .embed-footer { border-top: 1px solid #e5e5e5; font-size: 12px; color: #737373; } .embed-footer-top { display: flex; justify-content: space-between; align-items: center; padding: 12px 16px; } .embed-footer-link { color: #737373; text-decoration: none; font-weight: 500; } .embed-footer-link:hover { color: #525252; text-decoration: underline; } .data-definitions-toggle { background: none; border: none; color: #737373; font-size: 12px; font-weight: 500; cursor: pointer; display: flex; align-items: center; gap: 4px; padding: 0; } .data-definitions-toggle:hover { color: #525252; } .caret { transition: transform 0.2s ease; font-size: 10px; } .caret.expanded { transform: rotate(180deg); } .data-definitions { display: none; padding: 16px; background: #fafafa; border-top: 1px solid #e5e5e5; font-size: 12px; line-height: 1.4; } .data-definitions.expanded { display: block; } .data-definitions ul { margin: 0; padding-left: 0; list-style: none; } .data-definitions li { margin-bottom: 4px; }
// Toggle data definitions accordion - unique function per embed function toggleDefinitions_cfb_chart_1757875531138_mawpw4ykx() { const definitions = document.getElementById('dataDefinitions_cfb-chart-1757875531138-mawpw4ykx'); const caret = document.getElementById('caret_cfb-chart-1757875531138-mawpw4ykx'); if (definitions.classList.contains('expanded')) { definitions.classList.remove('expanded'); caret.classList.remove('expanded'); } else { definitions.classList.add('expanded'); caret.classList.add('expanded'); } } // WordPress-safe chart initialization with defensive checks (function() { 'use strict'; function initChart() { // Check if Chart.js is available if (typeof Chart === 'undefined') { console.warn('Chart.js not loaded yet, retrying...'); setTimeout(initChart, 100); return; } // Check if datalabels plugin is available if (typeof ChartDataLabels === 'undefined') { console.warn('ChartDataLabels plugin not loaded yet, retrying...'); setTimeout(initChart, 100); return; } // Check if canvas element exists const canvas = document.getElementById('cfb-chart-1757875531138-mawpw4ykx'); if (!canvas) { console.warn('Canvas element not found yet, retrying...'); setTimeout(initChart, 100); return; } // Prevent multiple chart instances if (canvas.chartInstance) { console.log('Chart already initialized'); return; } try { // Register the datalabels plugin Chart.register(ChartDataLabels); // Embed actual chart data directly const chartData = { "datasets": [ { "label": "NCAA Avg SR", "data": [ { "x": 1, "y": 0 }, { "x": 1, "y": 0.42 }, { "x": 103, "y": 0.42 }, { "x": 103, "y": 0 } ], "backgroundColor": "rgba(0,0,0,0.03)", "borderColor": "transparent", "pointRadius": 0, "fill": true, "tension": 0, "showLine": true, "datalabels": { "display": false } }, { "data": [ { "x": 6, "y": 0, "text": "Kevin Riley run for no gain to the ALA 38" }, { "x": 7, "y": 0, "text": "Ty Simpson pass complete to Kevin Riley for 6 yds to the ALA 39" }, { "x": 8, "y": 0, "text": "Ty Simpson run for 7 yds to the ALA 46" }, { "x": 9, "y": 0, "text": "Ty Simpson pass incomplete to Germie Bernard" }, { "x": 11, "y": 0, "text": "Richard Young run for 1 yd to the ALA 40" }, { "x": 12, "y": 0, "text": "Richard Young run for no gain to the ALA 40" }, { "x": 13, "y": 0.14285714285714285, "text": "Ty Simpson pass complete to Ryan Williams for 24 yds to the WIS 36 for a 1ST down" }, { "x": 14, "y": 0.125, "text": "Ty Simpson pass complete to Germie Bernard for 5 yds to the WIS 31" }, { "x": 15, "y": 0.1111111111111111, "text": "Kevin Riley run for 3 yds to the WIS 28" }, { "x": 16, "y": 0.1, "text": "Ty Simpson pass complete to Ryan Williams for 3 yds to the WIS 25 for a 1ST down" }, { "x": 17, "y": 0.09090909090909091, "text": "Ty Simpson pass complete to Lotzeir Brooks for 14 yds to the WIS 11 for a 1ST down" }, { "x": 18, "y": 0.08333333333333333, "text": "Kevin Riley run for 2 yds to the WIS 9" }, { "x": 19, "y": 0.07692307692307693, "text": "Ty Simpson run for 5 yds to the WIS 4" }, { "x": 20, "y": 0.07142857142857142, "text": "Richard Young run for 2 yds to the WIS 2" }, { "x": 21, "y": 0.06666666666666667, "text": "Germie Bernard run for 2 yds for a TD (Conor Talty KICK)" }, { "x": 28, "y": 0.0625, "text": "Ty Simpson pass complete to Josh Cuevas for 9 yds to the ALA 44" }, { "x": 29, "y": 0.058823529411764705, "text": "Ty Simpson sacked by Christian Alliegro for a loss of 14 yards to the ALA 30" }, { "x": 30, "y": 0.1111111111111111, "text": "Ty Simpson pass complete to Isaiah Horton for 12 yds to the WIS 42 for a 1ST down Wisconsin Penalty, Roughing Holder (Mason Reiger) to the WIS 43 for a 1ST down" }, { "x": 31, "y": 0.15789473684210525, "text": "Ty Simpson pass complete to Germie Bernard for 43 yds for a TD (Conor Talty KICK)" }, { "x": 40, "y": 0.15, "text": "Kevin Riley run for 11 yds to the ALA 13 for a 1ST down" }, { "x": 41, "y": 0.14285714285714285, "text": "Kevin Riley run for 1 yd to the ALA 14" }, { "x": 42, "y": 0.13636363636363635, "text": "Ty Simpson pass complete to Isaiah Horton for 6 yds to the ALA 20" }, { "x": 43, "y": 0.17391304347826086, "text": "Ty Simpson pass complete to Ryan Williams for 22 yds to the WIS 48 for a 1ST down" }, { "x": 44, "y": 0.16666666666666666, "text": "Ty Simpson run for no gain to the WIS 48" }, { "x": 45, "y": 0.2, "text": "Ty Simpson pass complete to Lotzeir Brooks for 16 yds to the WIS 32 for a 1ST down" }, { "x": 46, "y": 0.23076923076923078, "text": "Ty Simpson pass complete to Kevin Riley for 19 yds to the WIS 13 for a 1ST down" }, { "x": 47, "y": 0.2222222222222222, "text": "Ty Simpson pass complete to Isaiah Horton for 13 yds for a TD (Conor Talty KICK)" }, { "x": 49, "y": 0.25, "text": "Ty Simpson pass complete to Ryan Williams for 75 yds for a TD (Conor Talty KICK)" }, { "x": 50, "y": 0.2413793103448276, "text": "Ty Simpson pass incomplete to Josh Cuevas" }, { "x": 51, "y": 0.23333333333333334, "text": "Ty Simpson pass complete to Isaiah Horton for 11 yds to the ALA 24 for a 1ST down" }, { "x": 52, "y": 0.22580645161290322, "text": "Ty Simpson run for 8 yds to the ALA 32" }, { "x": 53, "y": 0.21875, "text": "Ty Simpson pass complete to Josh Cuevas for 8 yds to the ALA 40 for a 1ST down" }, { "x": 54, "y": 0.24242424242424243, "text": "Ty Simpson run for 19 yds to the WIS 41 for a 1ST down" }, { "x": 55, "y": 0.23529411764705882, "text": "Richard Young run for no gain to the WIS 41" }, { "x": 56, "y": 0.2571428571428571, "text": "Ty Simpson pass complete to Ryan Williams for 41 yds for a TD (Conor Talty KICK)" }, { "x": 67, "y": 0.25, "text": "Dre Washington run for 8 yds to the ALA 21" }, { "x": 68, "y": 0.2702702702702703, "text": "Ty Simpson pass complete to Germie Bernard for 19 yds to the ALA 40 for a 1ST down" }, { "x": 69, "y": 0.2894736842105263, "text": "Ty Simpson pass complete to Dre Washington for 15 yds to the WIS 45 for a 1ST down" }, { "x": 70, "y": 0.28205128205128205, "text": "Dre Washington run for 5 yds to the WIS 40" }, { "x": 71, "y": 0.275, "text": "Ty Simpson pass complete to Isaiah Horton for 6 yds to the WIS 34 for a 1ST down" }, { "x": 72, "y": 0.2682926829268293, "text": "Ty Simpson pass complete to Josh Cuevas for 5 yds to the WIS 29" }, { "x": 73, "y": 0.2619047619047619, "text": "Ty Simpson pass complete to Kevin Riley for 3 yds to the WIS 26" }, { "x": 74, "y": 0.2558139534883721, "text": "Ty Simpson pass complete to Kaleb Edwards for 12 yds to the WIS 9 for a 1ST down" }, { "x": 75, "y": 0.25, "text": "Ty Simpson pass incomplete to Josh Cuevas" }, { "x": 76, "y": 0.24444444444444444, "text": "Ty Simpson pass complete to Germie Bernard for a loss of 5 yards to the WIS 14" }, { "x": 77, "y": 0.2391304347826087, "text": "Ty Simpson pass incomplete to Ryan Williams" }, { "x": 85, "y": 0.23404255319148937, "text": "Kevin Riley run for 2 yds to the ALA 25" }, { "x": 86, "y": 0.22916666666666666, "text": "Kevin Riley run for 1 yd to the ALA 26" }, { "x": 87, "y": 0.22448979591836735, "text": "Ty Simpson pass incomplete to Lotzeir Brooks" }, { "x": 95, "y": 0.22, "text": "AK Dear run for 5 yds to the ALA 30" }, { "x": 96, "y": 0.21568627450980393, "text": "AK Dear run for 4 yds to the ALA 34" }, { "x": 97, "y": 0.21153846153846154, "text": "Austin Mack pass incomplete to Rico Scott" } ], "label": "Alabama XR", "borderColor": "rgba(101, 0, 20, 0.8)", "borderWidth": 2.2, "fill": false }, { "data": [ { "x": 6, "y": 0, "text": "Kevin Riley run for no gain to the ALA 38" }, { "x": 7, "y": 0, "text": "Ty Simpson pass complete to Kevin Riley for 6 yds to the ALA 39" }, { "x": 8, "y": 0, "text": "Ty Simpson run for 7 yds to the ALA 46" }, { "x": 9, "y": 0, "text": "Ty Simpson pass incomplete to Germie Bernard" }, { "x": 11, "y": 0, "text": "Richard Young run for 1 yd to the ALA 40" }, { "x": 12, "y": 0, "text": "Richard Young run for no gain to the ALA 40" }, { "x": 13, "y": 0.14285714285714285, "text": "Ty Simpson pass complete to Ryan Williams for 24 yds to the WIS 36 for a 1ST down" }, { "x": 14, "y": 0.25, "text": "Ty Simpson pass complete to Germie Bernard for 5 yds to the WIS 31" }, { "x": 15, "y": 0.2222222222222222, "text": "Kevin Riley run for 3 yds to the WIS 28" }, { "x": 16, "y": 0.3, "text": "Ty Simpson pass complete to Ryan Williams for 3 yds to the WIS 25 for a 1ST down" }, { "x": 17, "y": 0.36363636363636365, "text": "Ty Simpson pass complete to Lotzeir Brooks for 14 yds to the WIS 11 for a 1ST down" }, { "x": 18, "y": 0.3333333333333333, "text": "Kevin Riley run for 2 yds to the WIS 9" }, { "x": 19, "y": 0.3076923076923077, "text": "Ty Simpson run for 5 yds to the WIS 4" }, { "x": 20, "y": 0.2857142857142857, "text": "Richard Young run for 2 yds to the WIS 2" }, { "x": 21, "y": 0.3333333333333333, "text": "Germie Bernard run for 2 yds for a TD (Conor Talty KICK)" }, { "x": 28, "y": 0.375, "text": "Ty Simpson pass complete to Josh Cuevas for 9 yds to the ALA 44" }, { "x": 29, "y": 0.35294117647058826, "text": "Ty Simpson sacked by Christian Alliegro for a loss of 14 yards to the ALA 30" }, { "x": 30, "y": 0.3888888888888889, "text": "Ty Simpson pass complete to Isaiah Horton for 12 yds to the WIS 42 for a 1ST down Wisconsin Penalty, Roughing Holder (Mason Reiger) to the WIS 43 for a 1ST down" }, { "x": 31, "y": 0.42105263157894735, "text": "Ty Simpson pass complete to Germie Bernard for 43 yds for a TD (Conor Talty KICK)" }, { "x": 40, "y": 0.45, "text": "Kevin Riley run for 11 yds to the ALA 13 for a 1ST down" }, { "x": 41, "y": 0.42857142857142855, "text": "Kevin Riley run for 1 yd to the ALA 14" }, { "x": 42, "y": 0.4090909090909091, "text": "Ty Simpson pass complete to Isaiah Horton for 6 yds to the ALA 20" }, { "x": 43, "y": 0.43478260869565216, "text": "Ty Simpson pass complete to Ryan Williams for 22 yds to the WIS 48 for a 1ST down" }, { "x": 44, "y": 0.4166666666666667, "text": "Ty Simpson run for no gain to the WIS 48" }, { "x": 45, "y": 0.44, "text": "Ty Simpson pass complete to Lotzeir Brooks for 16 yds to the WIS 32 for a 1ST down" }, { "x": 46, "y": 0.46153846153846156, "text": "Ty Simpson pass complete to Kevin Riley for 19 yds to the WIS 13 for a 1ST down" }, { "x": 47, "y": 0.48148148148148145, "text": "Ty Simpson pass complete to Isaiah Horton for 13 yds for a TD (Conor Talty KICK)" }, { "x": 49, "y": 0.5, "text": "Ty Simpson pass complete to Ryan Williams for 75 yds for a TD (Conor Talty KICK)" }, { "x": 50, "y": 0.4827586206896552, "text": "Ty Simpson pass incomplete to Josh Cuevas" }, { "x": 51, "y": 0.5, "text": "Ty Simpson pass complete to Isaiah Horton for 11 yds to the ALA 24 for a 1ST down" }, { "x": 52, "y": 0.5161290322580645, "text": "Ty Simpson run for 8 yds to the ALA 32" }, { "x": 53, "y": 0.53125, "text": "Ty Simpson pass complete to Josh Cuevas for 8 yds to the ALA 40 for a 1ST down" }, { "x": 54, "y": 0.5454545454545454, "text": "Ty Simpson run for 19 yds to the WIS 41 for a 1ST down" }, { "x": 55, "y": 0.5294117647058824, "text": "Richard Young run for no gain to the WIS 41" }, { "x": 56, "y": 0.5428571428571428, "text": "Ty Simpson pass complete to Ryan Williams for 41 yds for a TD (Conor Talty KICK)" }, { "x": 67, "y": 0.5555555555555556, "text": "Dre Washington run for 8 yds to the ALA 21" }, { "x": 68, "y": 0.5675675675675675, "text": "Ty Simpson pass complete to Germie Bernard for 19 yds to the ALA 40 for a 1ST down" }, { "x": 69, "y": 0.5789473684210527, "text": "Ty Simpson pass complete to Dre Washington for 15 yds to the WIS 45 for a 1ST down" }, { "x": 70, "y": 0.5897435897435898, "text": "Dre Washington run for 5 yds to the WIS 40" }, { "x": 71, "y": 0.6, "text": "Ty Simpson pass complete to Isaiah Horton for 6 yds to the WIS 34 for a 1ST down" }, { "x": 72, "y": 0.6097560975609756, "text": "Ty Simpson pass complete to Josh Cuevas for 5 yds to the WIS 29" }, { "x": 73, "y": 0.5952380952380952, "text": "Ty Simpson pass complete to Kevin Riley for 3 yds to the WIS 26" }, { "x": 74, "y": 0.6046511627906976, "text": "Ty Simpson pass complete to Kaleb Edwards for 12 yds to the WIS 9 for a 1ST down" }, { "x": 75, "y": 0.5909090909090909, "text": "Ty Simpson pass incomplete to Josh Cuevas" }, { "x": 76, "y": 0.5777777777777777, "text": "Ty Simpson pass complete to Germie Bernard for a loss of 5 yards to the WIS 14" }, { "x": 77, "y": 0.5652173913043478, "text": "Ty Simpson pass incomplete to Ryan Williams" }, { "x": 85, "y": 0.5531914893617021, "text": "Kevin Riley run for 2 yds to the ALA 25" }, { "x": 86, "y": 0.5416666666666666, "text": "Kevin Riley run for 1 yd to the ALA 26" }, { "x": 87, "y": 0.5306122448979592, "text": "Ty Simpson pass incomplete to Lotzeir Brooks" }, { "x": 95, "y": 0.54, "text": "AK Dear run for 5 yds to the ALA 30" }, { "x": 96, "y": 0.5490196078431373, "text": "AK Dear run for 4 yds to the ALA 34" }, { "x": 97, "y": 0.5384615384615384, "text": "Austin Mack pass incomplete to Rico Scott" } ], "label": "Alabama SR", "borderColor": "rgba(175, 40, 60, 0.8)", "borderWidth": 2.2, "fill": false }, { "data": [ { "x": 1, "y": 0, "text": "Danny O'Neil pass complete to Grant Stec for 9 yds to the WIS 34" }, { "x": 2, "y": 0, "text": "Dilin Jones run for 3 yds to the WIS 37 for a 1ST down" }, { "x": 3, "y": 0, "text": "Danny O'Neil run for 2 yds to the WIS 39" }, { "x": 4, "y": 0, "text": "Trech Kekahuna run for 4 yds to the WIS 43" }, { "x": 5, "y": 0, "text": "Danny O'Neil sacked by LT Overton for a loss of 7 yards to the WIS 21" }, { "x": 10, "y": 0, "text": "Danny O'Neil pass intercepted Bray Hubbard return for 3 yds to the ALA 39" }, { "x": 22, "y": 0, "text": "Danny O'Neil pass complete to Darrion Dupree for no gain to the WIS 25" }, { "x": 23, "y": 0, "text": "Darrion Dupree run for 3 yds to the WIS 28" }, { "x": 24, "y": 0, "text": "Danny O'Neil pass complete to Darrion Dupree for 12 yds to the WIS 40 for a 1ST down" }, { "x": 25, "y": 0, "text": "Danny O'Neil pass complete to Darrion Dupree for 1 yd to the WIS 41" }, { "x": 26, "y": 0, "text": "Danny O'Neil sacked by Qua Russaw for a loss of 5 yards to the WIS 36" }, { "x": 27, "y": 0, "text": "Danny O'Neil sacked by London Simmons for a loss of 9 yards to the WIS 27" }, { "x": 32, "y": 0, "text": "Dilin Jones run for 1 yd to the WIS 26" }, { "x": 33, "y": 0, "text": "Danny O'Neil run for 4 yds to the WIS 30" }, { "x": 34, "y": 0.06666666666666667, "text": "Danny O'Neil pass complete to Lance Mason for 19 yds to the WIS 49 for a 1ST down" }, { "x": 35, "y": 0.0625, "text": "Danny O'Neil pass complete to Dilin Jones for 3 yds to the ALA 43" }, { "x": 36, "y": 0.058823529411764705, "text": "Cade Yacamelli run for 2 yds to the ALA 41 for a 1ST down" }, { "x": 37, "y": 0.05555555555555555, "text": "Danny O'Neil run for 4 yds to the WIS 48" }, { "x": 38, "y": 0.05263157894736842, "text": "Tyrell Henry run for 3 yds to the ALA 49" }, { "x": 39, "y": 0.05, "text": "Dilin Jones run for 6 yds to the ALA 43" }, { "x": 48, "y": 0.047619047619047616, "text": "Darrion Dupree run for 4 yds to the WIS 29" }, { "x": 57, "y": 0.045454545454545456, "text": "Dilin Jones run for 8 yds to the WIS 33" }, { "x": 58, "y": 0.043478260869565216, "text": "Danny O'Neil pass complete to Dilin Jones for 5 yds to the WIS 38 for a 1ST down" }, { "x": 59, "y": 0.041666666666666664, "text": "Danny O'Neil pass incomplete to Vinny Anthony II" }, { "x": 60, "y": 0.04, "text": "Dilin Jones run for 7 yds to the WIS 45" }, { "x": 61, "y": 0.038461538461538464, "text": "Danny O'Neil pass complete to Lance Mason for 11 yds to the ALA 49 for a 1ST down" }, { "x": 62, "y": 0.037037037037037035, "text": "Tyrell Henry run for 5 yds to the ALA 44" }, { "x": 63, "y": 0.03571428571428571, "text": "Danny O'Neil pass complete to Vinny Anthony II for 8 yds to the ALA 36 for a 1ST down" }, { "x": 64, "y": 0.034482758620689655, "text": "Danny O'Neil run for 11 yds to the ALA 25 for a 1ST down" }, { "x": 65, "y": 0.03333333333333333, "text": "Darrion Dupree run for 4 yds to the ALA 21" }, { "x": 66, "y": 0.03225806451612903, "text": "Danny O'Neil pass intercepted Bray Hubbard return for 5 yds to the ALA 13" }, { "x": 78, "y": 0.03125, "text": "Darrion Dupree run for 3 yds to the WIS 28" }, { "x": 79, "y": 0.030303030303030304, "text": "Danny O'Neil run for 6 yds to the WIS 34" }, { "x": 80, "y": 0.029411764705882353, "text": "Danny O'Neil pass incomplete to Chris Brooks Jr." }, { "x": 81, "y": 0.02857142857142857, "text": "Jackson Acker run for 1 yd to the WIS 35 for a 1ST down" }, { "x": 82, "y": 0.027777777777777776, "text": "Danny O'Neil pass incomplete to Darrion Dupree" }, { "x": 83, "y": 0.02702702702702703, "text": "Danny O'Neil pass incomplete to Jayden Ballard" }, { "x": 84, "y": 0.02631578947368421, "text": "Danny O'Neil sacked by Yhonzae Pierre for a loss of 12 yards to the WIS 23" }, { "x": 88, "y": 0.02564102564102564, "text": "Cade Yacamelli run for 6 yds to the WIS 36" }, { "x": 89, "y": 0.025, "text": "Cade Yacamelli run for 1 yd to the WIS 37" }, { "x": 90, "y": 0.024390243902439025, "text": "Danny O'Neil pass complete to Jackson Acker for 8 yds to the WIS 45 for a 1ST down" }, { "x": 91, "y": 0.023809523809523808, "text": "Cade Yacamelli run for 9 yds to the ALA 46" }, { "x": 92, "y": 0.023255813953488372, "text": "Danny O'Neil run for 2 yds to the ALA 44 for a 1ST down" }, { "x": 93, "y": 0.022727272727272728, "text": "Danny O'Neil run for 3 yds to the ALA 41" }, { "x": 94, "y": 0.044444444444444446, "text": "Danny O'Neil pass complete to Jayden Ballard for 41 yds for a TD (Nathanial Vakos KICK)" }, { "x": 98, "y": 0.043478260869565216, "text": "Darrion Dupree run for 4 yds to the WIS 33" }, { "x": 99, "y": 0.0425531914893617, "text": "Darrion Dupree run for 5 yds to the WIS 38" }, { "x": 100, "y": 0.041666666666666664, "text": "Darrion Dupree run for 3 yds to the WIS 41 for a 1ST down" }, { "x": 101, "y": 0.04081632653061224, "text": "Cade Yacamelli run for 3 yds to the WIS 44" }, { "x": 102, "y": 0.04, "text": "Trech Kekahuna run for no gain to the WIS 44" }, { "x": 103, "y": 0.0392156862745098, "text": "Danny O'Neil run for 8 yds to the ALA 48 for a 1ST down" } ], "label": "Wisconsin XR", "borderColor": "rgba(118, 10, 20, 0.8)", "borderWidth": 2.2, "borderDash": [ 4, 4 ], "fill": false }, { "data": [ { "x": 1, "y": 1, "text": "Danny O'Neil pass complete to Grant Stec for 9 yds to the WIS 34" }, { "x": 2, "y": 1, "text": "Dilin Jones run for 3 yds to the WIS 37 for a 1ST down" }, { "x": 3, "y": 0.6666666666666666, "text": "Danny O'Neil run for 2 yds to the WIS 39" }, { "x": 4, "y": 0.5, "text": "Trech Kekahuna run for 4 yds to the WIS 43" }, { "x": 5, "y": 0.4, "text": "Danny O'Neil sacked by LT Overton for a loss of 7 yards to the WIS 21" }, { "x": 10, "y": 0.3333333333333333, "text": "Danny O'Neil pass intercepted Bray Hubbard return for 3 yds to the ALA 39" }, { "x": 22, "y": 0.2857142857142857, "text": "Danny O'Neil pass complete to Darrion Dupree for no gain to the WIS 25" }, { "x": 23, "y": 0.25, "text": "Darrion Dupree run for 3 yds to the WIS 28" }, { "x": 24, "y": 0.3333333333333333, "text": "Danny O'Neil pass complete to Darrion Dupree for 12 yds to the WIS 40 for a 1ST down" }, { "x": 25, "y": 0.3, "text": "Danny O'Neil pass complete to Darrion Dupree for 1 yd to the WIS 41" }, { "x": 26, "y": 0.2727272727272727, "text": "Danny O'Neil sacked by Qua Russaw for a loss of 5 yards to the WIS 36" }, { "x": 27, "y": 0.25, "text": "Danny O'Neil sacked by London Simmons for a loss of 9 yards to the WIS 27" }, { "x": 32, "y": 0.23076923076923078, "text": "Dilin Jones run for 1 yd to the WIS 26" }, { "x": 33, "y": 0.21428571428571427, "text": "Danny O'Neil run for 4 yds to the WIS 30" }, { "x": 34, "y": 0.26666666666666666, "text": "Danny O'Neil pass complete to Lance Mason for 19 yds to the WIS 49 for a 1ST down" }, { "x": 35, "y": 0.3125, "text": "Danny O'Neil pass complete to Dilin Jones for 3 yds to the ALA 43" }, { "x": 36, "y": 0.35294117647058826, "text": "Cade Yacamelli run for 2 yds to the ALA 41 for a 1ST down" }, { "x": 37, "y": 0.3333333333333333, "text": "Danny O'Neil run for 4 yds to the WIS 48" }, { "x": 38, "y": 0.3157894736842105, "text": "Tyrell Henry run for 3 yds to the ALA 49" }, { "x": 39, "y": 0.3, "text": "Dilin Jones run for 6 yds to the ALA 43" }, { "x": 48, "y": 0.2857142857142857, "text": "Darrion Dupree run for 4 yds to the WIS 29" }, { "x": 57, "y": 0.3181818181818182, "text": "Dilin Jones run for 8 yds to the WIS 33" }, { "x": 58, "y": 0.34782608695652173, "text": "Danny O'Neil pass complete to Dilin Jones for 5 yds to the WIS 38 for a 1ST down" }, { "x": 59, "y": 0.3333333333333333, "text": "Danny O'Neil pass incomplete to Vinny Anthony II" }, { "x": 60, "y": 0.36, "text": "Dilin Jones run for 7 yds to the WIS 45" }, { "x": 61, "y": 0.38461538461538464, "text": "Danny O'Neil pass complete to Lance Mason for 11 yds to the ALA 49 for a 1ST down" }, { "x": 62, "y": 0.4074074074074074, "text": "Tyrell Henry run for 5 yds to the ALA 44" }, { "x": 63, "y": 0.42857142857142855, "text": "Danny O'Neil pass complete to Vinny Anthony II for 8 yds to the ALA 36 for a 1ST down" }, { "x": 64, "y": 0.4482758620689655, "text": "Danny O'Neil run for 11 yds to the ALA 25 for a 1ST down" }, { "x": 65, "y": 0.43333333333333335, "text": "Darrion Dupree run for 4 yds to the ALA 21" }, { "x": 66, "y": 0.45161290322580644, "text": "Danny O'Neil pass intercepted Bray Hubbard return for 5 yds to the ALA 13" }, { "x": 78, "y": 0.4375, "text": "Darrion Dupree run for 3 yds to the WIS 28" }, { "x": 79, "y": 0.45454545454545453, "text": "Danny O'Neil run for 6 yds to the WIS 34" }, { "x": 80, "y": 0.4411764705882353, "text": "Danny O'Neil pass incomplete to Chris Brooks Jr." }, { "x": 81, "y": 0.45714285714285713, "text": "Jackson Acker run for 1 yd to the WIS 35 for a 1ST down" }, { "x": 82, "y": 0.4444444444444444, "text": "Danny O'Neil pass incomplete to Darrion Dupree" }, { "x": 83, "y": 0.43243243243243246, "text": "Danny O'Neil pass incomplete to Jayden Ballard" }, { "x": 84, "y": 0.42105263157894735, "text": "Danny O'Neil sacked by Yhonzae Pierre for a loss of 12 yards to the WIS 23" }, { "x": 88, "y": 0.4358974358974359, "text": "Cade Yacamelli run for 6 yds to the WIS 36" }, { "x": 89, "y": 0.425, "text": "Cade Yacamelli run for 1 yd to the WIS 37" }, { "x": 90, "y": 0.43902439024390244, "text": "Danny O'Neil pass complete to Jackson Acker for 8 yds to the WIS 45 for a 1ST down" }, { "x": 91, "y": 0.4523809523809524, "text": "Cade Yacamelli run for 9 yds to the ALA 46" }, { "x": 92, "y": 0.46511627906976744, "text": "Danny O'Neil run for 2 yds to the ALA 44 for a 1ST down" }, { "x": 93, "y": 0.45454545454545453, "text": "Danny O'Neil run for 3 yds to the ALA 41" }, { "x": 94, "y": 0.4666666666666667, "text": "Danny O'Neil pass complete to Jayden Ballard for 41 yds for a TD (Nathanial Vakos KICK)" }, { "x": 98, "y": 0.45652173913043476, "text": "Darrion Dupree run for 4 yds to the WIS 33" }, { "x": 99, "y": 0.46808510638297873, "text": "Darrion Dupree run for 5 yds to the WIS 38" }, { "x": 100, "y": 0.4791666666666667, "text": "Darrion Dupree run for 3 yds to the WIS 41 for a 1ST down" }, { "x": 101, "y": 0.46938775510204084, "text": "Cade Yacamelli run for 3 yds to the WIS 44" }, { "x": 102, "y": 0.46, "text": "Trech Kekahuna run for no gain to the WIS 44" }, { "x": 103, "y": 0.47058823529411764, "text": "Danny O'Neil run for 8 yds to the ALA 48 for a 1ST down" } ], "label": "Wisconsin SR", "borderColor": "rgba(226, 55, 70, 0.8)", "borderWidth": 2.2, "borderDash": [ 4, 4 ], "fill": false }, { "label": "Quarters", "data": [ { "x": 1, "y": 0 }, { "x": 1, "y": 1 }, { "x": 103, "y": 1 }, { "x": 103, "y": 0 }, { "x": 26, "y": 0 }, { "x": 26, "y": 1 }, { "x": 103, "y": 1 }, { "x": 103, "y": 0 }, { "x": 49, "y": 0 }, { "x": 49, "y": 1 }, { "x": 103, "y": 1 }, { "x": 103, "y": 0 }, { "x": 75, "y": 0 }, { "x": 75, "y": 1 }, { "x": 103, "y": 1 }, { "x": 103, "y": 0 } ], "borderColor": "rgba(0,0,0,0.1)", "borderWidth": 1, "tension": 0, "fill": false, "pointRadius": 0, "showLine": true, "datalabels": { "display": false } } ], "currentParams": { "year": 2025, "week": 3, "seasonType": "regular", "team": "Alabama", "gameId": "401752696" } }; // Chart options (WordPress-safe) const chartOptions = { responsive: true, maintainAspectRatio: false, animation: { duration: 0 // Disable animations to prevent conflicts }, elements: 'line' === 'line' ? 'team-lines'.includes('play-map') ? { line: { tension: 0, borderWidth: 0 } } : { line: { tension: 0.25, borderWidth: 2.2 }, point: { pointRadius: 'team-lines'.includes('team-lines') ? 0 : undefined } } : {}, plugins: { datalabels: { display: function(context) { // Suppress data labels on line charts if ('line' === 'line') { return false; } return context.dataset.datalabels && context.dataset.datalabels.display === true; }, formatter: function(value, context) { // Special handling for Overall Team Performance chart if ('team-lines' === 'overall-team-performance' && context.dataset.label === 'Success Rate (SR)') { // Use the stored play count data if (context.dataset.playCountData && context.dataset.playCountData[context.dataIndex]) { return context.dataset.playCountData[context.dataIndex]; } // Fallback to percentage if play count data not available return Math.round(value * 100) + '%'; } // Handle bar charts with count data (play-type, quarter, down, etc.) if (context.dataset.label && context.dataset.label.includes(' SR') && (chartData.teamCounts || chartData.oppCounts)) { // Find the first team SR dataset in the chart to determine team order const allDatasets = context.chart.data.datasets; const teamSRDataset = allDatasets.find(d => d.label && d.label.includes(' SR') && !d.label.includes('NCAA')); // If this is the first team's SR dataset, use teamCounts if (teamSRDataset && context.dataset.label === teamSRDataset.label && chartData.teamCounts) { return chartData.teamCounts[context.dataIndex] || 0; } // Otherwise, use oppCounts for the second team else if (chartData.oppCounts) { return chartData.oppCounts[context.dataIndex] || 0; } } // For player charts, show value only if > 0 (matches non-embedded behavior) if ('team-lines'.includes('top-rushers') || 'team-lines'.includes('top-passers') || 'team-lines'.includes('top-receivers')) { // Hide data labels for zero or negative values, show actual value for positive values return value > 0 ? value : null; } // For other charts, show values based on type if (typeof value === 'number') { // If value is between 0 and 1, treat as percentage if (value >= 0 && value 0 ? '#26262660' : 'transparent'; }, borderColor: function(context) { const value = context.dataset.data[context.dataIndex]; return value > 0 ? 'rgba(255, 255, 255, 0.2)' : 'transparent'; }, borderRadius: 4, align: 'center', anchor: 'center' }, legend: 'line' === 'line' ? { position: 'top', align: 'start', labels: 'team-lines'.includes('play-map') ? { usePointStyle: true, generateLabels: function(chart) { // Call the original generateLabels to get default styling const original = Chart.defaults.plugins.legend.labels.generateLabels; const labels = original.call(this, chart); // Filter and customize each label const filteredLabels = labels.filter(label => { return !label.text.includes(' { const dataset = chart.data.datasets[label.datasetIndex]; if (dataset && dataset.label) { if (dataset.label.includes('Rush')) { label.pointStyle = 'circle'; label.pointStyleWidth = 4; label.fillStyle = 'white'; } else if (dataset.label.includes('Pass')) { label.pointStyle = 'triangle'; label.pointStyleWidth = 4; label.fillStyle = 'white'; } else { label.pointStyle = 'rect'; label.pointStyleWidth = 4; label.fillStyle = 'white'; } } }); return filteredLabels; }, boxWidth: 20, padding: 12 } : { usePointStyle: false, boxWidth: 12, boxHeight: 12, padding: 12, generateLabels: function(chart) { const original = Chart.defaults.plugins.legend.labels.generateLabels; const labels = original.call(this, chart); // Filter out reference areas and ensure white fill const filteredLabels = labels.filter(label => { return !label.text.includes('NCAA Avg SR') && !label.text.includes('50/50') && !label.text.includes('Quarters'); }); // Ensure white fill for all line chart legend boxes filteredLabels.forEach((label) => { label.fillStyle = 'white'; }); return filteredLabels; } } } : { position: 'top', align: 'start', labels: { usePointStyle: false, boxWidth: 12, boxHeight: 12, padding: 12, filter: function(legendItem, chartData) { return !legendItem.text.includes('NCAA Avg SR') && !legendItem.text.includes('Quarters') && !legendItem.text.includes('50/50'); }, generateLabels: function(chart) { const data = chart.data; if (data.datasets.length) { return data.datasets.map((dataset, i) => { // Handle backgroundColor arrays (like in Overall Team Performance chart) let fillColor = dataset.backgroundColor; if (dataset.label === '# Plays') { fillColor = 'white'; } else if (Array.isArray(dataset.backgroundColor)) { // For datasets with backgroundColor arrays, use the first color for legend fillColor = dataset.backgroundColor[0]; } return { text: dataset.label, fillStyle: fillColor, strokeStyle: dataset.label === '# Plays' ? '#666' : dataset.borderColor, lineWidth: dataset.label === '# Plays' ? 1 : dataset.borderWidth, hidden: !chart.isDatasetVisible(i), datasetIndex: i }; }).filter((item, index) => { // Apply the same filter logic as above const dataset = chart.data.datasets[index]; if (!dataset || !dataset.data) return false; if (dataset.label === '# Plays') return true; // Always show # Plays if (dataset.label && (dataset.label.includes('NCAA Avg SR') || dataset.label.includes('Quarters') || dataset.label.includes('50/50'))) return false; return dataset.data.some((value) => value > 0); }); } return []; } } }, tooltip: { filter: function(tooltipItem) { if ('team-lines'.includes('play-map')) { return !tooltipItem.dataset.label.includes('< 0') && !tooltipItem.dataset.label.includes('Quarters') && !tooltipItem.dataset.label.includes('Drive'); } return !tooltipItem.dataset.label.includes('NCAA Avg SR') && !tooltipItem.dataset.label.includes('50/50') && !tooltipItem.dataset.label.includes('< 0') && !tooltipItem.dataset.label.includes('Quarters'); }, callbacks: { label: function(context) { const label = context.dataset.label || ''; let labelText; // Play maps show yards instead of percentages if ('team-lines'.includes('play-map')) { labelText = label + ': ' + context.parsed.y + ' yards'; } else { const value = Math.round(context.parsed.y * 100); labelText = label + ': ' + value + '%'; } // For line charts, include play text if available if ('line' === 'line' && context.raw && context.raw.text) { return [labelText, context.raw.text]; } return labelText; } } } }, scales: 'line' === 'line' ? 'team-lines'.includes('play-map') ? { x: { type: 'linear', position: 'bottom', title: { display: true, text: 'Play Number' }, min: 1, ticks: { stepSize: 1, callback: function(value) { return Math.floor(value); } }, grid: { display: false } }, y: { title: { display: true, text: 'Yards Gained' }, min: chartData.minY, max: chartData.maxY } } : { x: { type: 'linear', position: 'bottom', title: { display: true, text: 'team-lines'.includes('team-lines') ? 'Play Number' : 'Team Play Number' }, min: 1, ticks: { stepSize: 1, callback: function(value) { return Math.floor(value); } }, grid: { display: false } }, y: { max: 1, min: 0, ticks: { callback: function(value) { return Math.round(value * 100) + '%'; } } } } : 'team-lines'.includes('drive-metrics') ? { y: { stacked: false, max: 1, ticks: { callback: function(value) { return Math.round(value * 100) + '%'; } } }, y1: { display: false, type: 'linear', position: 'right' } } : ('team-lines'.includes('top-rushers') || 'team-lines'.includes('top-passers') || 'team-lines'.includes('top-receivers')) ? { x: { stacked: true }, y: { stacked: true } } : { y: { max: 1, min: 0, stacked: false, ticks: { callback: function(value) { return Math.round(value * 100) + '%'; } } } } }; // Add indexAxis for player charts if ('team-lines'.includes('top-rushers') || 'team-lines'.includes('top-passers') || 'team-lines'.includes('top-receivers')) { chartOptions.indexAxis = 'y'; } // Initialize the chart const ctx = canvas.getContext('2d'); const chart = new Chart(ctx, { type: 'line', data: chartData, options: chartOptions }); // Store reference to prevent re-initialization canvas.chartInstance = chart; console.log('CFB Chart initialized successfully'); } catch (error) { console.error('Error initializing CFB chart:', error); // Fallback: show error message in canvas container const container = document.getElementById('cfb-chart-1757875531138-mawpw4ykx').parentNode; if (container) { container.innerHTML = '
Chart failed to load. Please refresh the page.
'; } } } // Initialize when DOM is ready if (document.readyState === 'loading') { document.addEventListener('DOMContentLoaded', initChart); } else { initChart(); } // Also try initialization after a short delay for WordPress compatibility setTimeout(initChart, 500); })();
And those trajectories are why the overall efficiencies look funny in this one: technically, Wisconsin was almost as efficient as Alabama in this one. They just had three problems: it was too little, too late, and their explosiveness was basically dead on arrival (look at that line anchored at 0% XR until partway through the 2nd quarter.
Like I said, Alabama actually started a little inefficiently on offense — and, honestly, I felt like the refs game us plenty of wiggle room to get warmed up — but things were peachy once Ty and co. Go their legs under them. And that Bama XR line just climbed with it, enough to where even after garbage time we settled into a cumulative Explosiveness Rate >20%. That’s big. That’s, like, feels-like-a-Tua-game big. Really nice to see that, especially, translate from the ULM game.
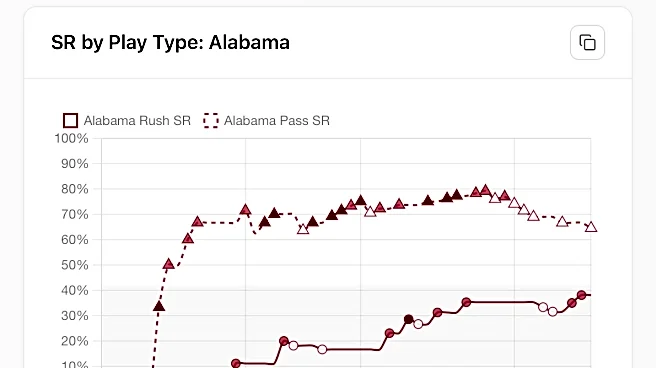
Don’t call it “air raid”
Rush Rate: Alabama body { font-family: -apple-system, BlinkMacSystemFont, 'Segoe UI', 'Roboto', sans-serif; margin: 0; padding: 20px; background: #f8fafc; } .chart-container { background: white; border-radius: 12px; border: 1px solid #e5e5e5; box-shadow: 0 1px 3px rgba(0, 0, 0, 0.1); overflow: hidden; } .chart-header { padding: 18px 24px 16px; border-bottom: 1px solid #e5e5e5; background: white; } .chart-title { font-size: 18px; font-weight: 600; color: #171717; margin: 0; } .chart-content { padding: 20px 24px 24px !important; } @media (max-width: 640px) { .chart-content { padding: 12px 16px 20px !important; } .chart-header { padding: 12px 16px 12px !important; } .embed-footer-top { padding: 8px 12px !important; } .data-definitions { padding: 12px !important; } body { padding: 12px !important; } } .chart-content.top-receivers { height: 624px; } .chart-content.top-passers { height: 280px !important; } .chart-content.top-rushers { height: 372px; } .chart-content:not(.top-receivers):not(.top-passers):not(.top-rushers) { height: 372px; } .embed-footer { border-top: 1px solid #e5e5e5; font-size: 12px; color: #737373; } .embed-footer-top { display: flex; justify-content: space-between; align-items: center; padding: 12px 16px; } .embed-footer-link { color: #737373; text-decoration: none; font-weight: 500; } .embed-footer-link:hover { color: #525252; text-decoration: underline; } .data-definitions-toggle { background: none; border: none; color: #737373; font-size: 12px; font-weight: 500; cursor: pointer; display: flex; align-items: center; gap: 4px; padding: 0; } .data-definitions-toggle:hover { color: #525252; } .caret { transition: transform 0.2s ease; font-size: 10px; } .caret.expanded { transform: rotate(180deg); } .data-definitions { display: none; padding: 16px; background: #fafafa; border-top: 1px solid #e5e5e5; font-size: 12px; line-height: 1.4; } .data-definitions.expanded { display: block; } .data-definitions ul { margin: 0; padding-left: 0; list-style: none; } .data-definitions li { margin-bottom: 4px; }
// Toggle data definitions accordion - unique function per embed function toggleDefinitions_cfb_chart_1757875552079_sponmq6bd() { const definitions = document.getElementById('dataDefinitions_cfb-chart-1757875552079-sponmq6bd'); const caret = document.getElementById('caret_cfb-chart-1757875552079-sponmq6bd'); if (definitions.classList.contains('expanded')) { definitions.classList.remove('expanded'); caret.classList.remove('expanded'); } else { definitions.classList.add('expanded'); caret.classList.add('expanded'); } } // WordPress-safe chart initialization with defensive checks (function() { 'use strict'; function initChart() { // Check if Chart.js is available if (typeof Chart === 'undefined') { console.warn('Chart.js not loaded yet, retrying...'); setTimeout(initChart, 100); return; } // Check if datalabels plugin is available if (typeof ChartDataLabels === 'undefined') { console.warn('ChartDataLabels plugin not loaded yet, retrying...'); setTimeout(initChart, 100); return; } // Check if canvas element exists const canvas = document.getElementById('cfb-chart-1757875552079-sponmq6bd'); if (!canvas) { console.warn('Canvas element not found yet, retrying...'); setTimeout(initChart, 100); return; } // Prevent multiple chart instances if (canvas.chartInstance) { console.log('Chart already initialized'); return; } try { // Register the datalabels plugin Chart.register(ChartDataLabels); // Embed actual chart data directly const chartData = { "datasets": [ { "label": "50/50", "data": [ { "x": 1, "y": 0 }, { "x": 1, "y": 0.5 }, { "x": 52, "y": 0.5 }, { "x": 52, "y": 0 } ], "backgroundColor": "rgba(0,0,0,0.03)", "borderColor": "transparent", "pointRadius": 0, "fill": true, "tension": 0, "showLine": true, "datalabels": { "display": false } }, { "data": [ { "x": 1, "y": 1, "text": "Kevin Riley run for no gain to the ALA 38" }, { "x": 2, "y": 0.5, "text": "Ty Simpson pass complete to Kevin Riley for 6 yds to the ALA 39" }, { "x": 3, "y": 0.6666666666666666, "text": "Ty Simpson run for 7 yds to the ALA 46" }, { "x": 4, "y": 0.5, "text": "Ty Simpson pass incomplete to Germie Bernard" }, { "x": 5, "y": 0.6, "text": "Richard Young run for 1 yd to the ALA 40" }, { "x": 6, "y": 0.6666666666666666, "text": "Richard Young run for no gain to the ALA 40" }, { "x": 7, "y": 0.5714285714285714, "text": "Ty Simpson pass complete to Ryan Williams for 24 yds to the WIS 36 for a 1ST down" }, { "x": 8, "y": 0.5, "text": "Ty Simpson pass complete to Germie Bernard for 5 yds to the WIS 31" }, { "x": 9, "y": 0.5555555555555556, "text": "Kevin Riley run for 3 yds to the WIS 28" }, { "x": 10, "y": 0.5, "text": "Ty Simpson pass complete to Ryan Williams for 3 yds to the WIS 25 for a 1ST down" }, { "x": 11, "y": 0.45454545454545453, "text": "Ty Simpson pass complete to Lotzeir Brooks for 14 yds to the WIS 11 for a 1ST down" }, { "x": 12, "y": 0.5, "text": "Kevin Riley run for 2 yds to the WIS 9" }, { "x": 13, "y": 0.5384615384615384, "text": "Ty Simpson run for 5 yds to the WIS 4" }, { "x": 14, "y": 0.5714285714285714, "text": "Richard Young run for 2 yds to the WIS 2" }, { "x": 15, "y": 0.6, "text": "Germie Bernard run for 2 yds for a TD (Conor Talty KICK)" }, { "x": 16, "y": 0.5625, "text": "Ty Simpson pass complete to Josh Cuevas for 9 yds to the ALA 44" }, { "x": 17, "y": 0.5294117647058824, "text": "Ty Simpson sacked by Christian Alliegro for a loss of 14 yards to the ALA 30" }, { "x": 18, "y": 0.5, "text": "Ty Simpson pass complete to Isaiah Horton for 12 yds to the WIS 42 for a 1ST down Wisconsin Penalty, Roughing Holder (Mason Reiger) to the WIS 43 for a 1ST down" }, { "x": 19, "y": 0.47368421052631576, "text": "Ty Simpson pass complete to Germie Bernard for 43 yds for a TD (Conor Talty KICK)" }, { "x": 20, "y": 0.5, "text": "Kevin Riley run for 11 yds to the ALA 13 for a 1ST down" }, { "x": 21, "y": 0.5238095238095238, "text": "Kevin Riley run for 1 yd to the ALA 14" }, { "x": 22, "y": 0.5, "text": "Ty Simpson pass complete to Isaiah Horton for 6 yds to the ALA 20" }, { "x": 23, "y": 0.4782608695652174, "text": "Ty Simpson pass complete to Ryan Williams for 22 yds to the WIS 48 for a 1ST down" }, { "x": 24, "y": 0.5, "text": "Ty Simpson run for no gain to the WIS 48" }, { "x": 25, "y": 0.48, "text": "Ty Simpson pass complete to Lotzeir Brooks for 16 yds to the WIS 32 for a 1ST down" }, { "x": 26, "y": 0.46153846153846156, "text": "Ty Simpson pass complete to Kevin Riley for 19 yds to the WIS 13 for a 1ST down" }, { "x": 27, "y": 0.4444444444444444, "text": "Ty Simpson pass complete to Isaiah Horton for 13 yds for a TD (Conor Talty KICK)" }, { "x": 28, "y": 0.42857142857142855, "text": "Ty Simpson pass complete to Ryan Williams for 75 yds for a TD (Conor Talty KICK)" }, { "x": 29, "y": 0.41379310344827586, "text": "Ty Simpson pass incomplete to Josh Cuevas" }, { "x": 30, "y": 0.4, "text": "Ty Simpson pass complete to Isaiah Horton for 11 yds to the ALA 24 for a 1ST down" }, { "x": 31, "y": 0.41935483870967744, "text": "Ty Simpson run for 8 yds to the ALA 32" }, { "x": 32, "y": 0.40625, "text": "Ty Simpson pass complete to Josh Cuevas for 8 yds to the ALA 40 for a 1ST down" }, { "x": 33, "y": 0.42424242424242425, "text": "Ty Simpson run for 19 yds to the WIS 41 for a 1ST down" }, { "x": 34, "y": 0.4411764705882353, "text": "Richard Young run for no gain to the WIS 41" }, { "x": 35, "y": 0.42857142857142855, "text": "Ty Simpson pass complete to Ryan Williams for 41 yds for a TD (Conor Talty KICK)" }, { "x": 36, "y": 0.4444444444444444, "text": "Dre Washington run for 8 yds to the ALA 21" }, { "x": 37, "y": 0.43243243243243246, "text": "Ty Simpson pass complete to Germie Bernard for 19 yds to the ALA 40 for a 1ST down" }, { "x": 38, "y": 0.42105263157894735, "text": "Ty Simpson pass complete to Dre Washington for 15 yds to the WIS 45 for a 1ST down" }, { "x": 39, "y": 0.4358974358974359, "text": "Dre Washington run for 5 yds to the WIS 40" }, { "x": 40, "y": 0.425, "text": "Ty Simpson pass complete to Isaiah Horton for 6 yds to the WIS 34 for a 1ST down" }, { "x": 41, "y": 0.4146341463414634, "text": "Ty Simpson pass complete to Josh Cuevas for 5 yds to the WIS 29" }, { "x": 42, "y": 0.40476190476190477, "text": "Ty Simpson pass complete to Kevin Riley for 3 yds to the WIS 26" }, { "x": 43, "y": 0.3953488372093023, "text": "Ty Simpson pass complete to Kaleb Edwards for 12 yds to the WIS 9 for a 1ST down" }, { "x": 44, "y": 0.38636363636363635, "text": "Ty Simpson pass incomplete to Josh Cuevas" }, { "x": 45, "y": 0.37777777777777777, "text": "Ty Simpson pass complete to Germie Bernard for a loss of 5 yards to the WIS 14" }, { "x": 46, "y": 0.3695652173913043, "text": "Ty Simpson pass incomplete to Ryan Williams" }, { "x": 47, "y": 0.3829787234042553, "text": "Kevin Riley run for 2 yds to the ALA 25" }, { "x": 48, "y": 0.3958333333333333, "text": "Kevin Riley run for 1 yd to the ALA 26" }, { "x": 49, "y": 0.3877551020408163, "text": "Ty Simpson pass incomplete to Lotzeir Brooks" }, { "x": 50, "y": 0.4, "text": "AK Dear run for 5 yds to the ALA 30" }, { "x": 51, "y": 0.4117647058823529, "text": "AK Dear run for 4 yds to the ALA 34" }, { "x": 52, "y": 0.40384615384615385, "text": "Austin Mack pass incomplete to Rico Scott" } ], "label": "Alabama Rush Rate", "borderColor": "rgba(101, 0, 20, 0.8)", "backgroundColor": "rgba(245, 229, 233, 0.8)", "borderWidth": 2, "pointBackgroundColor": [ "rgba(255,255,255,0.9)", "rgba(255,255,255,0.9)", "rgba(255,255,255,0.9)", "rgba(255,255,255,0.9)", "rgba(255,255,255,0.9)", "rgba(255,255,255,0.9)", "rgba(101, 0, 20, 0.8)", "rgba(175, 40, 60, 0.8)", "rgba(255,255,255,0.9)", "rgba(175, 40, 60, 0.8)", "rgba(175, 40, 60, 0.8)", "rgba(255,255,255,0.9)", "rgba(255,255,255,0.9)", "rgba(255,255,255,0.9)", "rgba(175, 40, 60, 0.8)", "rgba(175, 40, 60, 0.8)", "rgba(255,255,255,0.9)", "rgba(101, 0, 20, 0.8)", "rgba(101, 0, 20, 0.8)", "rgba(175, 40, 60, 0.8)", "rgba(255,255,255,0.9)", "rgba(255,255,255,0.9)", "rgba(101, 0, 20, 0.8)", "rgba(255,255,255,0.9)", "rgba(101, 0, 20, 0.8)", "rgba(101, 0, 20, 0.8)", "rgba(175, 40, 60, 0.8)", "rgba(101, 0, 20, 0.8)", "rgba(255,255,255,0.9)", "rgba(175, 40, 60, 0.8)", "rgba(175, 40, 60, 0.8)", "rgba(175, 40, 60, 0.8)", "rgba(101, 0, 20, 0.8)", "rgba(255,255,255,0.9)", "rgba(101, 0, 20, 0.8)", "rgba(175, 40, 60, 0.8)", "rgba(101, 0, 20, 0.8)", "rgba(101, 0, 20, 0.8)", "rgba(175, 40, 60, 0.8)", "rgba(175, 40, 60, 0.8)", "rgba(175, 40, 60, 0.8)", "rgba(255,255,255,0.9)", "rgba(175, 40, 60, 0.8)", "rgba(255,255,255,0.9)", "rgba(255,255,255,0.9)", "rgba(255,255,255,0.9)", "rgba(255,255,255,0.9)", "rgba(255,255,255,0.9)", "rgba(255,255,255,0.9)", "rgba(175, 40, 60, 0.8)", "rgba(175, 40, 60, 0.8)", "rgba(255,255,255,0.9)" ], "pointStyle": [ "circle", "triangle", "circle", "triangle", "circle", "circle", "triangle", "triangle", "circle", "triangle", "triangle", "circle", "circle", "circle", "circle", "triangle", "triangle", "triangle", "triangle", "circle", "circle", "triangle", "triangle", "circle", "triangle", "triangle", "triangle", "triangle", "triangle", "triangle", "circle", "triangle", "circle", "circle", "triangle", "circle", "triangle", "triangle", "circle", "triangle", "triangle", "triangle", "triangle", "triangle", "triangle", "triangle", "circle", "circle", "triangle", "circle", "circle", "triangle" ], "pointRadius": [ 4, 5.5, 4, 5.5, 4, 4, 5.5, 5.5, 4, 5.5, 5.5, 4, 4, 4, 4, 5.5, 5.5, 5.5, 5.5, 4, 4, 5.5, 5.5, 4, 5.5, 5.5, 5.5, 5.5, 5.5, 5.5, 4, 5.5, 4, 4, 5.5, 4, 5.5, 5.5, 4, 5.5, 5.5, 5.5, 5.5, 5.5, 5.5, 5.5, 4, 4, 5.5, 4, 4, 5.5 ], "pointBorderWidth": 1, "pointBorderColor": "rgba(101, 0, 20, 0.8)", "fill": true }, { "label": "Quarters", "data": [ { "x": 1, "y": 0 }, { "x": 1, "y": 1 }, { "x": 52, "y": 1 }, { "x": 52, "y": 0 }, { "x": 16, "y": 0 }, { "x": 16, "y": 1 }, { "x": 52, "y": 1 }, { "x": 52, "y": 0 }, { "x": 28, "y": 0 }, { "x": 28, "y": 1 }, { "x": 52, "y": 1 }, { "x": 52, "y": 0 }, { "x": 44, "y": 0 }, { "x": 44, "y": 1 }, { "x": 52, "y": 1 }, { "x": 52, "y": 0 } ], "borderColor": "rgba(0,0,0,0.1)", "borderWidth": 1, "tension": 0, "fill": false, "pointRadius": 0, "showLine": true, "datalabels": { "display": false } } ], "currentParams": { "year": 2025, "week": 3, "seasonType": "regular", "team": "Alabama", "gameId": "401752696" } }; // Chart options (WordPress-safe) const chartOptions = { responsive: true, maintainAspectRatio: false, animation: { duration: 0 // Disable animations to prevent conflicts }, elements: 'line' === 'line' ? 'team-rush-rate'.includes('play-map') ? { line: { tension: 0, borderWidth: 0 } } : { line: { tension: 0.25, borderWidth: 2.2 }, point: { pointRadius: 'team-rush-rate'.includes('team-lines') ? 0 : undefined } } : {}, plugins: { datalabels: { display: function(context) { // Suppress data labels on line charts if ('line' === 'line') { return false; } return context.dataset.datalabels && context.dataset.datalabels.display === true; }, formatter: function(value, context) { // Special handling for Overall Team Performance chart if ('team-rush-rate' === 'overall-team-performance' && context.dataset.label === 'Success Rate (SR)') { // Use the stored play count data if (context.dataset.playCountData && context.dataset.playCountData[context.dataIndex]) { return context.dataset.playCountData[context.dataIndex]; } // Fallback to percentage if play count data not available return Math.round(value * 100) + '%'; } // Handle bar charts with count data (play-type, quarter, down, etc.) if (context.dataset.label && context.dataset.label.includes(' SR') && (chartData.teamCounts || chartData.oppCounts)) { // Find the first team SR dataset in the chart to determine team order const allDatasets = context.chart.data.datasets; const teamSRDataset = allDatasets.find(d => d.label && d.label.includes(' SR') && !d.label.includes('NCAA')); // If this is the first team's SR dataset, use teamCounts if (teamSRDataset && context.dataset.label === teamSRDataset.label && chartData.teamCounts) { return chartData.teamCounts[context.dataIndex] || 0; } // Otherwise, use oppCounts for the second team else if (chartData.oppCounts) { return chartData.oppCounts[context.dataIndex] || 0; } } // For player charts, show value only if > 0 (matches non-embedded behavior) if ('team-rush-rate'.includes('top-rushers') || 'team-rush-rate'.includes('top-passers') || 'team-rush-rate'.includes('top-receivers')) { // Hide data labels for zero or negative values, show actual value for positive values return value > 0 ? value : null; } // For other charts, show values based on type if (typeof value === 'number') { // If value is between 0 and 1, treat as percentage if (value >= 0 && value 0 ? '#26262660' : 'transparent'; }, borderColor: function(context) { const value = context.dataset.data[context.dataIndex]; return value > 0 ? 'rgba(255, 255, 255, 0.2)' : 'transparent'; }, borderRadius: 4, align: 'center', anchor: 'center' }, legend: 'line' === 'line' ? { position: 'top', align: 'start', labels: 'team-rush-rate'.includes('play-map') ? { usePointStyle: true, generateLabels: function(chart) { // Call the original generateLabels to get default styling const original = Chart.defaults.plugins.legend.labels.generateLabels; const labels = original.call(this, chart); // Filter and customize each label const filteredLabels = labels.filter(label => { return !label.text.includes(' { const dataset = chart.data.datasets[label.datasetIndex]; if (dataset && dataset.label) { if (dataset.label.includes('Rush')) { label.pointStyle = 'circle'; label.pointStyleWidth = 4; label.fillStyle = 'white'; } else if (dataset.label.includes('Pass')) { label.pointStyle = 'triangle'; label.pointStyleWidth = 4; label.fillStyle = 'white'; } else { label.pointStyle = 'rect'; label.pointStyleWidth = 4; label.fillStyle = 'white'; } } }); return filteredLabels; }, boxWidth: 20, padding: 12 } : { usePointStyle: false, boxWidth: 12, boxHeight: 12, padding: 12, generateLabels: function(chart) { const original = Chart.defaults.plugins.legend.labels.generateLabels; const labels = original.call(this, chart); // Filter out reference areas and ensure white fill const filteredLabels = labels.filter(label => { return !label.text.includes('NCAA Avg SR') && !label.text.includes('50/50') && !label.text.includes('Quarters'); }); // Ensure white fill for all line chart legend boxes filteredLabels.forEach((label) => { label.fillStyle = 'white'; }); return filteredLabels; } } } : { position: 'top', align: 'start', labels: { usePointStyle: false, boxWidth: 12, boxHeight: 12, padding: 12, filter: function(legendItem, chartData) { return !legendItem.text.includes('NCAA Avg SR') && !legendItem.text.includes('Quarters') && !legendItem.text.includes('50/50'); }, generateLabels: function(chart) { const data = chart.data; if (data.datasets.length) { return data.datasets.map((dataset, i) => { // Handle backgroundColor arrays (like in Overall Team Performance chart) let fillColor = dataset.backgroundColor; if (dataset.label === '# Plays') { fillColor = 'white'; } else if (Array.isArray(dataset.backgroundColor)) { // For datasets with backgroundColor arrays, use the first color for legend fillColor = dataset.backgroundColor[0]; } return { text: dataset.label, fillStyle: fillColor, strokeStyle: dataset.label === '# Plays' ? '#666' : dataset.borderColor, lineWidth: dataset.label === '# Plays' ? 1 : dataset.borderWidth, hidden: !chart.isDatasetVisible(i), datasetIndex: i }; }).filter((item, index) => { // Apply the same filter logic as above const dataset = chart.data.datasets[index]; if (!dataset || !dataset.data) return false; if (dataset.label === '# Plays') return true; // Always show # Plays if (dataset.label && (dataset.label.includes('NCAA Avg SR') || dataset.label.includes('Quarters') || dataset.label.includes('50/50'))) return false; return dataset.data.some((value) => value > 0); }); } return []; } } }, tooltip: { filter: function(tooltipItem) { if ('team-rush-rate'.includes('play-map')) { return !tooltipItem.dataset.label.includes('< 0') && !tooltipItem.dataset.label.includes('Quarters') && !tooltipItem.dataset.label.includes('Drive'); } return !tooltipItem.dataset.label.includes('NCAA Avg SR') && !tooltipItem.dataset.label.includes('50/50') && !tooltipItem.dataset.label.includes('< 0') && !tooltipItem.dataset.label.includes('Quarters'); }, callbacks: { label: function(context) { const label = context.dataset.label || ''; let labelText; // Play maps show yards instead of percentages if ('team-rush-rate'.includes('play-map')) { labelText = label + ': ' + context.parsed.y + ' yards'; } else { const value = Math.round(context.parsed.y * 100); labelText = label + ': ' + value + '%'; } // For line charts, include play text if available if ('line' === 'line' && context.raw && context.raw.text) { return [labelText, context.raw.text]; } return labelText; } } } }, scales: 'line' === 'line' ? 'team-rush-rate'.includes('play-map') ? { x: { type: 'linear', position: 'bottom', title: { display: true, text: 'Play Number' }, min: 1, ticks: { stepSize: 1, callback: function(value) { return Math.floor(value); } }, grid: { display: false } }, y: { title: { display: true, text: 'Yards Gained' }, min: chartData.minY, max: chartData.maxY } } : { x: { type: 'linear', position: 'bottom', title: { display: true, text: 'team-rush-rate'.includes('team-lines') ? 'Play Number' : 'Team Play Number' }, min: 1, ticks: { stepSize: 1, callback: function(value) { return Math.floor(value); } }, grid: { display: false } }, y: { max: 1, min: 0, ticks: { callback: function(value) { return Math.round(value * 100) + '%'; } } } } : 'team-rush-rate'.includes('drive-metrics') ? { y: { stacked: false, max: 1, ticks: { callback: function(value) { return Math.round(value * 100) + '%'; } } }, y1: { display: false, type: 'linear', position: 'right' } } : ('team-rush-rate'.includes('top-rushers') || 'team-rush-rate'.includes('top-passers') || 'team-rush-rate'.includes('top-receivers')) ? { x: { stacked: true }, y: { stacked: true } } : { y: { max: 1, min: 0, stacked: false, ticks: { callback: function(value) { return Math.round(value * 100) + '%'; } } } } }; // Add indexAxis for player charts if ('team-rush-rate'.includes('top-rushers') || 'team-rush-rate'.includes('top-passers') || 'team-rush-rate'.includes('top-receivers')) { chartOptions.indexAxis = 'y'; } // Initialize the chart const ctx = canvas.getContext('2d'); const chart = new Chart(ctx, { type: 'line', data: chartData, options: chartOptions }); // Store reference to prevent re-initialization canvas.chartInstance = chart; console.log('CFB Chart initialized successfully'); } catch (error) { console.error('Error initializing CFB chart:', error); // Fallback: show error message in canvas container const container = document.getElementById('cfb-chart-1757875552079-sponmq6bd').parentNode; if (container) { container.innerHTML = '
Chart failed to load. Please refresh the page.
'; } } } // Initialize when DOM is ready if (document.readyState === 'loading') { document.addEventListener('DOMContentLoaded', initChart); } else { initChart(); } // Also try initialization after a short delay for WordPress compatibility setTimeout(initChart, 500); })();
Look, the Alabama Rush Rate chart looks amenable to the average (average reasonable?) gump: we tried running the ball early and had a >50% rush rate until midway through the 2nd quarter. Surprisingly, garbage time just saw this team passing more, and we had a <40% rush rate right before the final few plays.
SR by Play Type: Alabama body { font-family: -apple-system, BlinkMacSystemFont, 'Segoe UI', 'Roboto', sans-serif; margin: 0; padding: 20px; background: #f8fafc; } .chart-container { background: white; border-radius: 12px; border: 1px solid #e5e5e5; box-shadow: 0 1px 3px rgba(0, 0, 0, 0.1); overflow: hidden; } .chart-header { padding: 18px 24px 16px; border-bottom: 1px solid #e5e5e5; background: white; } .chart-title { font-size: 18px; font-weight: 600; color: #171717; margin: 0; } .chart-content { padding: 20px 24px 24px !important; } @media (max-width: 640px) { .chart-content { padding: 12px 16px 20px !important; } .chart-header { padding: 12px 16px 12px !important; } .embed-footer-top { padding: 8px 12px !important; } .data-definitions { padding: 12px !important; } body { padding: 12px !important; } } .chart-content.top-receivers { height: 624px; } .chart-content.top-passers { height: 280px !important; } .chart-content.top-rushers { height: 372px; } .chart-content:not(.top-receivers):not(.top-passers):not(.top-rushers) { height: 372px; } .embed-footer { border-top: 1px solid #e5e5e5; font-size: 12px; color: #737373; } .embed-footer-top { display: flex; justify-content: space-between; align-items: center; padding: 12px 16px; } .embed-footer-link { color: #737373; text-decoration: none; font-weight: 500; } .embed-footer-link:hover { color: #525252; text-decoration: underline; } .data-definitions-toggle { background: none; border: none; color: #737373; font-size: 12px; font-weight: 500; cursor: pointer; display: flex; align-items: center; gap: 4px; padding: 0; } .data-definitions-toggle:hover { color: #525252; } .caret { transition: transform 0.2s ease; font-size: 10px; } .caret.expanded { transform: rotate(180deg); } .data-definitions { display: none; padding: 16px; background: #fafafa; border-top: 1px solid #e5e5e5; font-size: 12px; line-height: 1.4; } .data-definitions.expanded { display: block; } .data-definitions ul { margin: 0; padding-left: 0; list-style: none; } .data-definitions li { margin-bottom: 4px; }
// Toggle data definitions accordion - unique function per embed function toggleDefinitions_cfb_chart_1757875568328_e52wm60g9() { const definitions = document.getElementById('dataDefinitions_cfb-chart-1757875568328-e52wm60g9'); const caret = document.getElementById('caret_cfb-chart-1757875568328-e52wm60g9'); if (definitions.classList.contains('expanded')) { definitions.classList.remove('expanded'); caret.classList.remove('expanded'); } else { definitions.classList.add('expanded'); caret.classList.add('expanded'); } } // WordPress-safe chart initialization with defensive checks (function() { 'use strict'; function initChart() { // Check if Chart.js is available if (typeof Chart === 'undefined') { console.warn('Chart.js not loaded yet, retrying...'); setTimeout(initChart, 100); return; } // Check if datalabels plugin is available if (typeof ChartDataLabels === 'undefined') { console.warn('ChartDataLabels plugin not loaded yet, retrying...'); setTimeout(initChart, 100); return; } // Check if canvas element exists const canvas = document.getElementById('cfb-chart-1757875568328-e52wm60g9'); if (!canvas) { console.warn('Canvas element not found yet, retrying...'); setTimeout(initChart, 100); return; } // Prevent multiple chart instances if (canvas.chartInstance) { console.log('Chart already initialized'); return; } try { // Register the datalabels plugin Chart.register(ChartDataLabels); // Embed actual chart data directly const chartData = { "datasets": [ { "label": "NCAA Avg SR", "data": [ { "x": 1, "y": 0 }, { "x": 1, "y": 0.42 }, { "x": 52, "y": 0.42 }, { "x": 52, "y": 0 } ], "backgroundColor": "rgba(0,0,0,0.03)", "borderColor": "transparent", "pointRadius": 0, "fill": true, "tension": 0, "showLine": true, "datalabels": { "display": false } }, { "data": [ { "x": 1, "y": 0, "text": "Kevin Riley run for no gain to the ALA 38" }, { "x": 2, "y": 0, "text": "Ty Simpson pass complete to Kevin Riley for 6 yds to the ALA 39" }, { "x": 3, "y": 0, "text": "Ty Simpson run for 7 yds to the ALA 46" }, { "x": 4, "y": 0, "text": "Ty Simpson pass incomplete to Germie Bernard" }, { "x": 5, "y": 0, "text": "Richard Young run for 1 yd to the ALA 40" }, { "x": 6, "y": 0, "text": "Richard Young run for no gain to the ALA 40" }, { "x": 7, "y": 0, "text": "Ty Simpson pass complete to Ryan Williams for 24 yds to the WIS 36 for a 1ST down" }, { "x": 8, "y": 0, "text": "Ty Simpson pass complete to Germie Bernard for 5 yds to the WIS 31" }, { "x": 9, "y": 0, "text": "Kevin Riley run for 3 yds to the WIS 28" }, { "x": 10, "y": 0, "text": "Ty Simpson pass complete to Ryan Williams for 3 yds to the WIS 25 for a 1ST down" }, { "x": 11, "y": 0, "text": "Ty Simpson pass complete to Lotzeir Brooks for 14 yds to the WIS 11 for a 1ST down" }, { "x": 12, "y": 0, "text": "Kevin Riley run for 2 yds to the WIS 9" }, { "x": 13, "y": 0, "text": "Ty Simpson run for 5 yds to the WIS 4" }, { "x": 14, "y": 0, "text": "Richard Young run for 2 yds to the WIS 2" }, { "x": 15, "y": 0.1111111111111111, "text": "Germie Bernard run for 2 yds for a TD (Conor Talty KICK)" }, { "x": 16, "y": 0.1111111111111111, "text": "Ty Simpson pass complete to Josh Cuevas for 9 yds to the ALA 44" }, { "x": 17, "y": 0.1111111111111111, "text": "Ty Simpson sacked by Christian Alliegro for a loss of 14 yards to the ALA 30" }, { "x": 18, "y": 0.1111111111111111, "text": "Ty Simpson pass complete to Isaiah Horton for 12 yds to the WIS 42 for a 1ST down Wisconsin Penalty, Roughing Holder (Mason Reiger) to the WIS 43 for a 1ST down" }, { "x": 19, "y": 0.1111111111111111, "text": "Ty Simpson pass complete to Germie Bernard for 43 yds for a TD (Conor Talty KICK)" }, { "x": 20, "y": 0.2, "text": "Kevin Riley run for 11 yds to the ALA 13 for a 1ST down" }, { "x": 21, "y": 0.18181818181818182, "text": "Kevin Riley run for 1 yd to the ALA 14" }, { "x": 22, "y": 0.18181818181818182, "text": "Ty Simpson pass complete to Isaiah Horton for 6 yds to the ALA 20" }, { "x": 23, "y": 0.18181818181818182, "text": "Ty Simpson pass complete to Ryan Williams for 22 yds to the WIS 48 for a 1ST down" }, { "x": 24, "y": 0.16666666666666666, "text": "Ty Simpson run for no gain to the WIS 48" }, { "x": 25, "y": 0.16666666666666666, "text": "Ty Simpson pass complete to Lotzeir Brooks for 16 yds to the WIS 32 for a 1ST down" }, { "x": 26, "y": 0.16666666666666666, "text": "Ty Simpson pass complete to Kevin Riley for 19 yds to the WIS 13 for a 1ST down" }, { "x": 27, "y": 0.16666666666666666, "text": "Ty Simpson pass complete to Isaiah Horton for 13 yds for a TD (Conor Talty KICK)" }, { "x": 28, "y": 0.16666666666666666, "text": "Ty Simpson pass complete to Ryan Williams for 75 yds for a TD (Conor Talty KICK)" }, { "x": 29, "y": 0.16666666666666666, "text": "Ty Simpson pass incomplete to Josh Cuevas" }, { "x": 30, "y": 0.16666666666666666, "text": "Ty Simpson pass complete to Isaiah Horton for 11 yds to the ALA 24 for a 1ST down" }, { "x": 31, "y": 0.23076923076923078, "text": "Ty Simpson run for 8 yds to the ALA 32" }, { "x": 32, "y": 0.23076923076923078, "text": "Ty Simpson pass complete to Josh Cuevas for 8 yds to the ALA 40 for a 1ST down" }, { "x": 33, "y": 0.2857142857142857, "text": "Ty Simpson run for 19 yds to the WIS 41 for a 1ST down" }, { "x": 34, "y": 0.26666666666666666, "text": "Richard Young run for no gain to the WIS 41" }, { "x": 35, "y": 0.26666666666666666, "text": "Ty Simpson pass complete to Ryan Williams for 41 yds for a TD (Conor Talty KICK)" }, { "x": 36, "y": 0.3125, "text": "Dre Washington run for 8 yds to the ALA 21" }, { "x": 37, "y": 0.3125, "text": "Ty Simpson pass complete to Germie Bernard for 19 yds to the ALA 40 for a 1ST down" }, { "x": 38, "y": 0.3125, "text": "Ty Simpson pass complete to Dre Washington for 15 yds to the WIS 45 for a 1ST down" }, { "x": 39, "y": 0.35294117647058826, "text": "Dre Washington run for 5 yds to the WIS 40" }, { "x": 40, "y": 0.35294117647058826, "text": "Ty Simpson pass complete to Isaiah Horton for 6 yds to the WIS 34 for a 1ST down" }, { "x": 41, "y": 0.35294117647058826, "text": "Ty Simpson pass complete to Josh Cuevas for 5 yds to the WIS 29" }, { "x": 42, "y": 0.35294117647058826, "text": "Ty Simpson pass complete to Kevin Riley for 3 yds to the WIS 26" }, { "x": 43, "y": 0.35294117647058826, "text": "Ty Simpson pass complete to Kaleb Edwards for 12 yds to the WIS 9 for a 1ST down" }, { "x": 44, "y": 0.35294117647058826, "text": "Ty Simpson pass incomplete to Josh Cuevas" }, { "x": 45, "y": 0.35294117647058826, "text": "Ty Simpson pass complete to Germie Bernard for a loss of 5 yards to the WIS 14" }, { "x": 46, "y": 0.35294117647058826, "text": "Ty Simpson pass incomplete to Ryan Williams" }, { "x": 47, "y": 0.3333333333333333, "text": "Kevin Riley run for 2 yds to the ALA 25" }, { "x": 48, "y": 0.3157894736842105, "text": "Kevin Riley run for 1 yd to the ALA 26" }, { "x": 49, "y": 0.3157894736842105, "text": "Ty Simpson pass incomplete to Lotzeir Brooks" }, { "x": 50, "y": 0.35, "text": "AK Dear run for 5 yds to the ALA 30" }, { "x": 51, "y": 0.38095238095238093, "text": "AK Dear run for 4 yds to the ALA 34" }, { "x": 52, "y": 0.38095238095238093, "text": "Austin Mack pass incomplete to Rico Scott" } ], "label": "Alabama Rush SR", "borderColor": "rgba(101, 0, 20, 0.8)", "backgroundColor": [ "rgba(255,255,255,0.9)", "rgba(255,255,255,0.9)", "rgba(255,255,255,0.9)", "rgba(255,255,255,0.9)", "rgba(255,255,255,0.9)", "rgba(255,255,255,0.9)", "rgba(255,255,255,0.9)", "rgba(255,255,255,0.9)", "rgba(255,255,255,0.9)", "rgba(255,255,255,0.9)", "rgba(255,255,255,0.9)", "rgba(255,255,255,0.9)", "rgba(255,255,255,0.9)", "rgba(255,255,255,0.9)", "rgba(175, 40, 60, 0.8)", "rgba(255,255,255,0.9)", "rgba(255,255,255,0.9)", "rgba(255,255,255,0.9)", "rgba(255,255,255,0.9)", "rgba(175, 40, 60, 0.8)", "rgba(255,255,255,0.9)", "rgba(255,255,255,0.9)", "rgba(255,255,255,0.9)", "rgba(255,255,255,0.9)", "rgba(255,255,255,0.9)", "rgba(255,255,255,0.9)", "rgba(255,255,255,0.9)", "rgba(255,255,255,0.9)", "rgba(255,255,255,0.9)", "rgba(255,255,255,0.9)", "rgba(175, 40, 60, 0.8)", "rgba(255,255,255,0.9)", "rgba(101, 0, 20, 0.8)", "rgba(255,255,255,0.9)", "rgba(255,255,255,0.9)", "rgba(175, 40, 60, 0.8)", "rgba(255,255,255,0.9)", "rgba(255,255,255,0.9)", "rgba(175, 40, 60, 0.8)", "rgba(255,255,255,0.9)", "rgba(255,255,255,0.9)", "rgba(255,255,255,0.9)", "rgba(255,255,255,0.9)", "rgba(255,255,255,0.9)", "rgba(255,255,255,0.9)", "rgba(255,255,255,0.9)", "rgba(255,255,255,0.9)", "rgba(255,255,255,0.9)", "rgba(255,255,255,0.9)", "rgba(175, 40, 60, 0.8)", "rgba(175, 40, 60, 0.8)", "rgba(255,255,255,0.9)" ], "borderWidth": 2, "pointStyle": "circle", "pointRadius": [ 4, 0, 4, 0, 4, 4, 0, 0, 4, 0, 0, 4, 4, 4, 4, 0, 0, 0, 0, 4, 4, 0, 0, 4, 0, 0, 0, 0, 0, 0, 4, 0, 4, 4, 0, 4, 0, 0, 4, 0, 0, 0, 0, 0, 0, 0, 4, 4, 0, 4, 4, 0 ], "pointBorderWidth": 1, "pointBorderColor": "rgba(101, 0, 20, 0.8)", "showLine": true }, { "data": [ { "x": 1, "y": 0, "text": "Kevin Riley run for no gain to the ALA 38" }, { "x": 2, "y": 0, "text": "Ty Simpson pass complete to Kevin Riley for 6 yds to the ALA 39" }, { "x": 3, "y": 0, "text": "Ty Simpson run for 7 yds to the ALA 46" }, { "x": 4, "y": 0, "text": "Ty Simpson pass incomplete to Germie Bernard" }, { "x": 5, "y": 0, "text": "Richard Young run for 1 yd to the ALA 40" }, { "x": 6, "y": 0, "text": "Richard Young run for no gain to the ALA 40" }, { "x": 7, "y": 0.3333333333333333, "text": "Ty Simpson pass complete to Ryan Williams for 24 yds to the WIS 36 for a 1ST down" }, { "x": 8, "y": 0.5, "text": "Ty Simpson pass complete to Germie Bernard for 5 yds to the WIS 31" }, { "x": 9, "y": 0.5, "text": "Kevin Riley run for 3 yds to the WIS 28" }, { "x": 10, "y": 0.6, "text": "Ty Simpson pass complete to Ryan Williams for 3 yds to the WIS 25 for a 1ST down" }, { "x": 11, "y": 0.6666666666666666, "text": "Ty Simpson pass complete to Lotzeir Brooks for 14 yds to the WIS 11 for a 1ST down" }, { "x": 12, "y": 0.6666666666666666, "text": "Kevin Riley run for 2 yds to the WIS 9" }, { "x": 13, "y": 0.6666666666666666, "text": "Ty Simpson run for 5 yds to the WIS 4" }, { "x": 14, "y": 0.6666666666666666, "text": "Richard Young run for 2 yds to the WIS 2" }, { "x": 15, "y": 0.6666666666666666, "text": "Germie Bernard run for 2 yds for a TD (Conor Talty KICK)" }, { "x": 16, "y": 0.7142857142857143, "text": "Ty Simpson pass complete to Josh Cuevas for 9 yds to the ALA 44" }, { "x": 17, "y": 0.625, "text": "Ty Simpson sacked by Christian Alliegro for a loss of 14 yards to the ALA 30" }, { "x": 18, "y": 0.6666666666666666, "text": "Ty Simpson pass complete to Isaiah Horton for 12 yds to the WIS 42 for a 1ST down Wisconsin Penalty, Roughing Holder (Mason Reiger) to the WIS 43 for a 1ST down" }, { "x": 19, "y": 0.7, "text": "Ty Simpson pass complete to Germie Bernard for 43 yds for a TD (Conor Talty KICK)" }, { "x": 20, "y": 0.7, "text": "Kevin Riley run for 11 yds to the ALA 13 for a 1ST down" }, { "x": 21, "y": 0.7, "text": "Kevin Riley run for 1 yd to the ALA 14" }, { "x": 22, "y": 0.6363636363636364, "text": "Ty Simpson pass complete to Isaiah Horton for 6 yds to the ALA 20" }, { "x": 23, "y": 0.6666666666666666, "text": "Ty Simpson pass complete to Ryan Williams for 22 yds to the WIS 48 for a 1ST down" }, { "x": 24, "y": 0.6666666666666666, "text": "Ty Simpson run for no gain to the WIS 48" }, { "x": 25, "y": 0.6923076923076923, "text": "Ty Simpson pass complete to Lotzeir Brooks for 16 yds to the WIS 32 for a 1ST down" }, { "x": 26, "y": 0.7142857142857143, "text": "Ty Simpson pass complete to Kevin Riley for 19 yds to the WIS 13 for a 1ST down" }, { "x": 27, "y": 0.7333333333333333, "text": "Ty Simpson pass complete to Isaiah Horton for 13 yds for a TD (Conor Talty KICK)" }, { "x": 28, "y": 0.75, "text": "Ty Simpson pass complete to Ryan Williams for 75 yds for a TD (Conor Talty KICK)" }, { "x": 29, "y": 0.7058823529411765, "text": "Ty Simpson pass incomplete to Josh Cuevas" }, { "x": 30, "y": 0.7222222222222222, "text": "Ty Simpson pass complete to Isaiah Horton for 11 yds to the ALA 24 for a 1ST down" }, { "x": 31, "y": 0.7222222222222222, "text": "Ty Simpson run for 8 yds to the ALA 32" }, { "x": 32, "y": 0.7368421052631579, "text": "Ty Simpson pass complete to Josh Cuevas for 8 yds to the ALA 40 for a 1ST down" }, { "x": 33, "y": 0.7368421052631579, "text": "Ty Simpson run for 19 yds to the WIS 41 for a 1ST down" }, { "x": 34, "y": 0.7368421052631579, "text": "Richard Young run for no gain to the WIS 41" }, { "x": 35, "y": 0.75, "text": "Ty Simpson pass complete to Ryan Williams for 41 yds for a TD (Conor Talty KICK)" }, { "x": 36, "y": 0.75, "text": "Dre Washington run for 8 yds to the ALA 21" }, { "x": 37, "y": 0.7619047619047619, "text": "Ty Simpson pass complete to Germie Bernard for 19 yds to the ALA 40 for a 1ST down" }, { "x": 38, "y": 0.7727272727272727, "text": "Ty Simpson pass complete to Dre Washington for 15 yds to the WIS 45 for a 1ST down" }, { "x": 39, "y": 0.7727272727272727, "text": "Dre Washington run for 5 yds to the WIS 40" }, { "x": 40, "y": 0.782608695652174, "text": "Ty Simpson pass complete to Isaiah Horton for 6 yds to the WIS 34 for a 1ST down" }, { "x": 41, "y": 0.7916666666666666, "text": "Ty Simpson pass complete to Josh Cuevas for 5 yds to the WIS 29" }, { "x": 42, "y": 0.76, "text": "Ty Simpson pass complete to Kevin Riley for 3 yds to the WIS 26" }, { "x": 43, "y": 0.7692307692307693, "text": "Ty Simpson pass complete to Kaleb Edwards for 12 yds to the WIS 9 for a 1ST down" }, { "x": 44, "y": 0.7407407407407407, "text": "Ty Simpson pass incomplete to Josh Cuevas" }, { "x": 45, "y": 0.7142857142857143, "text": "Ty Simpson pass complete to Germie Bernard for a loss of 5 yards to the WIS 14" }, { "x": 46, "y": 0.6896551724137931, "text": "Ty Simpson pass incomplete to Ryan Williams" }, { "x": 47, "y": 0.6896551724137931, "text": "Kevin Riley run for 2 yds to the ALA 25" }, { "x": 48, "y": 0.6896551724137931, "text": "Kevin Riley run for 1 yd to the ALA 26" }, { "x": 49, "y": 0.6666666666666666, "text": "Ty Simpson pass incomplete to Lotzeir Brooks" }, { "x": 50, "y": 0.6666666666666666, "text": "AK Dear run for 5 yds to the ALA 30" }, { "x": 51, "y": 0.6666666666666666, "text": "AK Dear run for 4 yds to the ALA 34" }, { "x": 52, "y": 0.6451612903225806, "text": "Austin Mack pass incomplete to Rico Scott" } ], "label": "Alabama Pass SR", "borderColor": "rgba(101, 0, 20, 0.8)", "backgroundColor": [ "rgba(255,255,255,0.9)", "rgba(255,255,255,0.9)", "rgba(255,255,255,0.9)", "rgba(255,255,255,0.9)", "rgba(255,255,255,0.9)", "rgba(255,255,255,0.9)", "rgba(101, 0, 20, 0.8)", "rgba(175, 40, 60, 0.8)", "rgba(255,255,255,0.9)", "rgba(175, 40, 60, 0.8)", "rgba(175, 40, 60, 0.8)", "rgba(255,255,255,0.9)", "rgba(255,255,255,0.9)", "rgba(255,255,255,0.9)", "rgba(255,255,255,0.9)", "rgba(175, 40, 60, 0.8)", "rgba(255,255,255,0.9)", "rgba(101, 0, 20, 0.8)", "rgba(101, 0, 20, 0.8)", "rgba(255,255,255,0.9)", "rgba(255,255,255,0.9)", "rgba(255,255,255,0.9)", "rgba(101, 0, 20, 0.8)", "rgba(255,255,255,0.9)", "rgba(101, 0, 20, 0.8)", "rgba(101, 0, 20, 0.8)", "rgba(175, 40, 60, 0.8)", "rgba(101, 0, 20, 0.8)", "rgba(255,255,255,0.9)", "rgba(175, 40, 60, 0.8)", "rgba(255,255,255,0.9)", "rgba(175, 40, 60, 0.8)", "rgba(255,255,255,0.9)", "rgba(255,255,255,0.9)", "rgba(101, 0, 20, 0.8)", "rgba(255,255,255,0.9)", "rgba(101, 0, 20, 0.8)", "rgba(101, 0, 20, 0.8)", "rgba(255,255,255,0.9)", "rgba(175, 40, 60, 0.8)", "rgba(175, 40, 60, 0.8)", "rgba(255,255,255,0.9)", "rgba(175, 40, 60, 0.8)", "rgba(255,255,255,0.9)", "rgba(255,255,255,0.9)", "rgba(255,255,255,0.9)", "rgba(255,255,255,0.9)", "rgba(255,255,255,0.9)", "rgba(255,255,255,0.9)", "rgba(255,255,255,0.9)", "rgba(255,255,255,0.9)", "rgba(255,255,255,0.9)" ], "borderWidth": 2, "pointStyle": "triangle", "pointRadius": [ 0, 6, 0, 6, 0, 0, 6, 6, 0, 6, 6, 0, 0, 0, 0, 6, 0, 6, 6, 0, 0, 6, 6, 0, 6, 6, 6, 6, 6, 6, 0, 6, 0, 0, 6, 0, 6, 6, 0, 6, 6, 6, 6, 6, 6, 6, 0, 0, 6, 0, 0, 6 ], "pointBorderWidth": 1, "pointBorderColor": "rgba(101, 0, 20, 0.8)", "borderDash": [ 4, 4 ], "showLine": true }, { "label": "Quarters", "data": [ { "x": 1, "y": 0 }, { "x": 1, "y": 1 }, { "x": 52, "y": 1 }, { "x": 52, "y": 0 }, { "x": 16, "y": 0 }, { "x": 16, "y": 1 }, { "x": 52, "y": 1 }, { "x": 52, "y": 0 }, { "x": 28, "y": 0 }, { "x": 28, "y": 1 }, { "x": 52, "y": 1 }, { "x": 52, "y": 0 }, { "x": 44, "y": 0 }, { "x": 44, "y": 1 }, { "x": 52, "y": 1 }, { "x": 52, "y": 0 } ], "borderColor": "rgba(0,0,0,0.1)", "borderWidth": 1, "tension": 0, "fill": false, "pointRadius": 0, "showLine": true, "datalabels": { "display": false } } ], "currentParams": { "year": 2025, "week": 3, "seasonType": "regular", "team": "Alabama", "gameId": "401752696" } }; // Chart options (WordPress-safe) const chartOptions = { responsive: true, maintainAspectRatio: false, animation: { duration: 0 // Disable animations to prevent conflicts }, elements: 'line' === 'line' ? 'team-play-type-lines'.includes('play-map') ? { line: { tension: 0, borderWidth: 0 } } : { line: { tension: 0.25, borderWidth: 2.2 }, point: { pointRadius: 'team-play-type-lines'.includes('team-lines') ? 0 : undefined } } : {}, plugins: { datalabels: { display: function(context) { // Suppress data labels on line charts if ('line' === 'line') { return false; } return context.dataset.datalabels && context.dataset.datalabels.display === true; }, formatter: function(value, context) { // Special handling for Overall Team Performance chart if ('team-play-type-lines' === 'overall-team-performance' && context.dataset.label === 'Success Rate (SR)') { // Use the stored play count data if (context.dataset.playCountData && context.dataset.playCountData[context.dataIndex]) { return context.dataset.playCountData[context.dataIndex]; } // Fallback to percentage if play count data not available return Math.round(value * 100) + '%'; } // Handle bar charts with count data (play-type, quarter, down, etc.) if (context.dataset.label && context.dataset.label.includes(' SR') && (chartData.teamCounts || chartData.oppCounts)) { // Find the first team SR dataset in the chart to determine team order const allDatasets = context.chart.data.datasets; const teamSRDataset = allDatasets.find(d => d.label && d.label.includes(' SR') && !d.label.includes('NCAA')); // If this is the first team's SR dataset, use teamCounts if (teamSRDataset && context.dataset.label === teamSRDataset.label && chartData.teamCounts) { return chartData.teamCounts[context.dataIndex] || 0; } // Otherwise, use oppCounts for the second team else if (chartData.oppCounts) { return chartData.oppCounts[context.dataIndex] || 0; } } // For player charts, show value only if > 0 (matches non-embedded behavior) if ('team-play-type-lines'.includes('top-rushers') || 'team-play-type-lines'.includes('top-passers') || 'team-play-type-lines'.includes('top-receivers')) { // Hide data labels for zero or negative values, show actual value for positive values return value > 0 ? value : null; } // For other charts, show values based on type if (typeof value === 'number') { // If value is between 0 and 1, treat as percentage if (value >= 0 && value 0 ? '#26262660' : 'transparent'; }, borderColor: function(context) { const value = context.dataset.data[context.dataIndex]; return value > 0 ? 'rgba(255, 255, 255, 0.2)' : 'transparent'; }, borderRadius: 4, align: 'center', anchor: 'center' }, legend: 'line' === 'line' ? { position: 'top', align: 'start', labels: 'team-play-type-lines'.includes('play-map') ? { usePointStyle: true, generateLabels: function(chart) { // Call the original generateLabels to get default styling const original = Chart.defaults.plugins.legend.labels.generateLabels; const labels = original.call(this, chart); // Filter and customize each label const filteredLabels = labels.filter(label => { return !label.text.includes(' { const dataset = chart.data.datasets[label.datasetIndex]; if (dataset && dataset.label) { if (dataset.label.includes('Rush')) { label.pointStyle = 'circle'; label.pointStyleWidth = 4; label.fillStyle = 'white'; } else if (dataset.label.includes('Pass')) { label.pointStyle = 'triangle'; label.pointStyleWidth = 4; label.fillStyle = 'white'; } else { label.pointStyle = 'rect'; label.pointStyleWidth = 4; label.fillStyle = 'white'; } } }); return filteredLabels; }, boxWidth: 20, padding: 12 } : { usePointStyle: false, boxWidth: 12, boxHeight: 12, padding: 12, generateLabels: function(chart) { const original = Chart.defaults.plugins.legend.labels.generateLabels; const labels = original.call(this, chart); // Filter out reference areas and ensure white fill const filteredLabels = labels.filter(label => { return !label.text.includes('NCAA Avg SR') && !label.text.includes('50/50') && !label.text.includes('Quarters'); }); // Ensure white fill for all line chart legend boxes filteredLabels.forEach((label) => { label.fillStyle = 'white'; }); return filteredLabels; } } } : { position: 'top', align: 'start', labels: { usePointStyle: false, boxWidth: 12, boxHeight: 12, padding: 12, filter: function(legendItem, chartData) { return !legendItem.text.includes('NCAA Avg SR') && !legendItem.text.includes('Quarters') && !legendItem.text.includes('50/50'); }, generateLabels: function(chart) { const data = chart.data; if (data.datasets.length) { return data.datasets.map((dataset, i) => { // Handle backgroundColor arrays (like in Overall Team Performance chart) let fillColor = dataset.backgroundColor; if (dataset.label === '# Plays') { fillColor = 'white'; } else if (Array.isArray(dataset.backgroundColor)) { // For datasets with backgroundColor arrays, use the first color for legend fillColor = dataset.backgroundColor[0]; } return { text: dataset.label, fillStyle: fillColor, strokeStyle: dataset.label === '# Plays' ? '#666' : dataset.borderColor, lineWidth: dataset.label === '# Plays' ? 1 : dataset.borderWidth, hidden: !chart.isDatasetVisible(i), datasetIndex: i }; }).filter((item, index) => { // Apply the same filter logic as above const dataset = chart.data.datasets[index]; if (!dataset || !dataset.data) return false; if (dataset.label === '# Plays') return true; // Always show # Plays if (dataset.label && (dataset.label.includes('NCAA Avg SR') || dataset.label.includes('Quarters') || dataset.label.includes('50/50'))) return false; return dataset.data.some((value) => value > 0); }); } return []; } } }, tooltip: { filter: function(tooltipItem) { if ('team-play-type-lines'.includes('play-map')) { return !tooltipItem.dataset.label.includes('< 0') && !tooltipItem.dataset.label.includes('Quarters') && !tooltipItem.dataset.label.includes('Drive'); } return !tooltipItem.dataset.label.includes('NCAA Avg SR') && !tooltipItem.dataset.label.includes('50/50') && !tooltipItem.dataset.label.includes('< 0') && !tooltipItem.dataset.label.includes('Quarters'); }, callbacks: { label: function(context) { const label = context.dataset.label || ''; let labelText; // Play maps show yards instead of percentages if ('team-play-type-lines'.includes('play-map')) { labelText = label + ': ' + context.parsed.y + ' yards'; } else { const value = Math.round(context.parsed.y * 100); labelText = label + ': ' + value + '%'; } // For line charts, include play text if available if ('line' === 'line' && context.raw && context.raw.text) { return [labelText, context.raw.text]; } return labelText; } } } }, scales: 'line' === 'line' ? 'team-play-type-lines'.includes('play-map') ? { x: { type: 'linear', position: 'bottom', title: { display: true, text: 'Play Number' }, min: 1, ticks: { stepSize: 1, callback: function(value) { return Math.floor(value); } }, grid: { display: false } }, y: { title: { display: true, text: 'Yards Gained' }, min: chartData.minY, max: chartData.maxY } } : { x: { type: 'linear', position: 'bottom', title: { display: true, text: 'team-play-type-lines'.includes('team-lines') ? 'Play Number' : 'Team Play Number' }, min: 1, ticks: { stepSize: 1, callback: function(value) { return Math.floor(value); } }, grid: { display: false } }, y: { max: 1, min: 0, ticks: { callback: function(value) { return Math.round(value * 100) + '%'; } } } } : 'team-play-type-lines'.includes('drive-metrics') ? { y: { stacked: false, max: 1, ticks: { callback: function(value) { return Math.round(value * 100) + '%'; } } }, y1: { display: false, type: 'linear', position: 'right' } } : ('team-play-type-lines'.includes('top-rushers') || 'team-play-type-lines'.includes('top-passers') || 'team-play-type-lines'.includes('top-receivers')) ? { x: { stacked: true }, y: { stacked: true } } : { y: { max: 1, min: 0, stacked: false, ticks: { callback: function(value) { return Math.round(value * 100) + '%'; } } } } }; // Add indexAxis for player charts if ('team-play-type-lines'.includes('top-rushers') || 'team-play-type-lines'.includes('top-passers') || 'team-play-type-lines'.includes('top-receivers')) { chartOptions.indexAxis = 'y'; } // Initialize the chart const ctx = canvas.getContext('2d'); const chart = new Chart(ctx, { type: 'line', data: chartData, options: chartOptions }); // Store reference to prevent re-initialization canvas.chartInstance = chart; console.log('CFB Chart initialized successfully'); } catch (error) { console.error('Error initializing CFB chart:', error); // Fallback: show error message in canvas container const container = document.getElementById('cfb-chart-1757875568328-e52wm60g9').parentNode; if (container) { container.innerHTML = '
Chart failed to load. Please refresh the page.
'; } } } // Initialize when DOM is ready if (document.readyState === 'loading') { document.addEventListener('DOMContentLoaded', initChart); } else { initChart(); } // Also try initialization after a short delay for WordPress compatibility setTimeout(initChart, 500); })();
But what else are you supposed to do when you get these results? The running game struggled to get off the mat until the end of the first quarter — funny enough, that first successful rush was that Germie Bernard carry for 2 yards into the end zone, not even a conventional RB play — and never reached a cumulative average SR even after some success later in the game.
But that passing offense was an absolute rocket! Like I said, Ty and the offensive staff found something working after a few plays and just spammed that “pass” button, to great success. Heck, even during garbage time Bama’s Passing SR was climbing, peaking at nearly 80% passing Success Rate (!!) before a little slide at the end.
Is that what the idealized Grubb offense looks like? And are Gumps ready for it? (Let’s revisit this question in a few weeks after Athens).
SR, XR, and Play Count by Drive: Alabama body { font-family: -apple-system, BlinkMacSystemFont, 'Segoe UI', 'Roboto', sans-serif; margin: 0; padding: 20px; background: #f8fafc; } .chart-container { background: white; border-radius: 12px; border: 1px solid #e5e5e5; box-shadow: 0 1px 3px rgba(0, 0, 0, 0.1); overflow: hidden; } .chart-header { padding: 18px 24px 16px; border-bottom: 1px solid #e5e5e5; background: white; } .chart-title { font-size: 18px; font-weight: 600; color: #171717; margin: 0; } .chart-content { padding: 20px 24px 24px !important; } @media (max-width: 640px) { .chart-content { padding: 12px 16px 20px !important; } .chart-header { padding: 12px 16px 12px !important; } .embed-footer-top { padding: 8px 12px !important; } .data-definitions { padding: 12px !important; } body { padding: 12px !important; } } .chart-content.top-receivers { height: 624px; } .chart-content.top-passers { height: 280px !important; } .chart-content.top-rushers { height: 372px; } .chart-content:not(.top-receivers):not(.top-passers):not(.top-rushers) { height: 372px; } .embed-footer { border-top: 1px solid #e5e5e5; font-size: 12px; color: #737373; } .embed-footer-top { display: flex; justify-content: space-between; align-items: center; padding: 12px 16px; } .embed-footer-link { color: #737373; text-decoration: none; font-weight: 500; } .embed-footer-link:hover { color: #525252; text-decoration: underline; } .data-definitions-toggle { background: none; border: none; color: #737373; font-size: 12px; font-weight: 500; cursor: pointer; display: flex; align-items: center; gap: 4px; padding: 0; } .data-definitions-toggle:hover { color: #525252; } .caret { transition: transform 0.2s ease; font-size: 10px; } .caret.expanded { transform: rotate(180deg); } .data-definitions { display: none; padding: 16px; background: #fafafa; border-top: 1px solid #e5e5e5; font-size: 12px; line-height: 1.4; } .data-definitions.expanded { display: block; } .data-definitions ul { margin: 0; padding-left: 0; list-style: none; } .data-definitions li { margin-bottom: 4px; }
// Toggle data definitions accordion - unique function per embed function toggleDefinitions_cfb_chart_1757875585353_pp2t5v30j() { const definitions = document.getElementById('dataDefinitions_cfb-chart-1757875585353-pp2t5v30j'); const caret = document.getElementById('caret_cfb-chart-1757875585353-pp2t5v30j'); if (definitions.classList.contains('expanded')) { definitions.classList.remove('expanded'); caret.classList.remove('expanded'); } else { definitions.classList.add('expanded'); caret.classList.add('expanded'); } } // WordPress-safe chart initialization with defensive checks (function() { 'use strict'; function initChart() { // Check if Chart.js is available if (typeof Chart === 'undefined') { console.warn('Chart.js not loaded yet, retrying...'); setTimeout(initChart, 100); return; } // Check if datalabels plugin is available if (typeof ChartDataLabels === 'undefined') { console.warn('ChartDataLabels plugin not loaded yet, retrying...'); setTimeout(initChart, 100); return; } // Check if canvas element exists const canvas = document.getElementById('cfb-chart-1757875585353-pp2t5v30j'); if (!canvas) { console.warn('Canvas element not found yet, retrying...'); setTimeout(initChart, 100); return; } // Prevent multiple chart instances if (canvas.chartInstance) { console.log('Chart already initialized'); return; } try { // Register the datalabels plugin Chart.register(ChartDataLabels); // Embed actual chart data directly const chartData = { "labels": [ "Drive 2", "Drive 4", "Drive 6", "Drive 8", "Drive 10", "Drive 12", "Drive 14", "Drive 16", "Drive 18" ], "datasets": [ { "label": "Alabama XR", "data": [ 0, 0.09090909090909091, 0.5, 0.375, 1, 0.2857142857142857, 0.18181818181818182, 0, 0 ], "backgroundColor": "rgba(101, 0, 20, 0.8)", "stack": "SRXR", "yAxisID": "y", "datalabels": { "display": false } }, { "label": "Alabama SR", "data": [ 0, 0.45454545454545453, 0.75, 0.625, 1, 0.7142857142857143, 0.6363636363636364, 0, 0.6666666666666666 ], "backgroundColor": "rgba(175, 40, 60, 0.8)", "stack": "SRXR", "yAxisID": "y", "datalabels": { "display": false } }, { "label": "Plays in drive", "data": [ 4, 11, 4, 8, 1, 7, 11, 3, 3 ], "backgroundColor": "rgba(148, 148, 148, 0.8)", "stack": "Plays", "yAxisID": "y1", "datalabels": { "display": true } } ], "currentParams": { "year": 2025, "week": 3, "seasonType": "regular", "team": "Alabama", "gameId": "401752696" } }; // Chart options (WordPress-safe) const chartOptions = { responsive: true, maintainAspectRatio: false, animation: { duration: 0 // Disable animations to prevent conflicts }, elements: 'bar' === 'line' ? 'team-drive-metrics'.includes('play-map') ? { line: { tension: 0, borderWidth: 0 } } : { line: { tension: 0.25, borderWidth: 2.2 }, point: { pointRadius: 'team-drive-metrics'.includes('team-lines') ? 0 : undefined } } : {}, plugins: { datalabels: { display: function(context) { // Suppress data labels on line charts if ('bar' === 'line') { return false; } return context.dataset.datalabels && context.dataset.datalabels.display === true; }, formatter: function(value, context) { // Special handling for Overall Team Performance chart if ('team-drive-metrics' === 'overall-team-performance' && context.dataset.label === 'Success Rate (SR)') { // Use the stored play count data if (context.dataset.playCountData && context.dataset.playCountData[context.dataIndex]) { return context.dataset.playCountData[context.dataIndex]; } // Fallback to percentage if play count data not available return Math.round(value * 100) + '%'; } // Handle bar charts with count data (play-type, quarter, down, etc.) if (context.dataset.label && context.dataset.label.includes(' SR') && (chartData.teamCounts || chartData.oppCounts)) { // Find the first team SR dataset in the chart to determine team order const allDatasets = context.chart.data.datasets; const teamSRDataset = allDatasets.find(d => d.label && d.label.includes(' SR') && !d.label.includes('NCAA')); // If this is the first team's SR dataset, use teamCounts if (teamSRDataset && context.dataset.label === teamSRDataset.label && chartData.teamCounts) { return chartData.teamCounts[context.dataIndex] || 0; } // Otherwise, use oppCounts for the second team else if (chartData.oppCounts) { return chartData.oppCounts[context.dataIndex] || 0; } } // For player charts, show value only if > 0 (matches non-embedded behavior) if ('team-drive-metrics'.includes('top-rushers') || 'team-drive-metrics'.includes('top-passers') || 'team-drive-metrics'.includes('top-receivers')) { // Hide data labels for zero or negative values, show actual value for positive values return value > 0 ? value : null; } // For other charts, show values based on type if (typeof value === 'number') { // If value is between 0 and 1, treat as percentage if (value >= 0 && value 0 ? '#26262660' : 'transparent'; }, borderColor: function(context) { const value = context.dataset.data[context.dataIndex]; return value > 0 ? 'rgba(255, 255, 255, 0.2)' : 'transparent'; }, borderRadius: 4, align: 'center', anchor: 'center' }, legend: 'bar' === 'line' ? { position: 'top', align: 'start', labels: 'team-drive-metrics'.includes('play-map') ? { usePointStyle: true, generateLabels: function(chart) { // Call the original generateLabels to get default styling const original = Chart.defaults.plugins.legend.labels.generateLabels; const labels = original.call(this, chart); // Filter and customize each label const filteredLabels = labels.filter(label => { return !label.text.includes(' { const dataset = chart.data.datasets[label.datasetIndex]; if (dataset && dataset.label) { if (dataset.label.includes('Rush')) { label.pointStyle = 'circle'; label.pointStyleWidth = 4; label.fillStyle = 'white'; } else if (dataset.label.includes('Pass')) { label.pointStyle = 'triangle'; label.pointStyleWidth = 4; label.fillStyle = 'white'; } else { label.pointStyle = 'rect'; label.pointStyleWidth = 4; label.fillStyle = 'white'; } } }); return filteredLabels; }, boxWidth: 20, padding: 12 } : { usePointStyle: false, boxWidth: 12, boxHeight: 12, padding: 12, generateLabels: function(chart) { const original = Chart.defaults.plugins.legend.labels.generateLabels; const labels = original.call(this, chart); // Filter out reference areas and ensure white fill const filteredLabels = labels.filter(label => { return !label.text.includes('NCAA Avg SR') && !label.text.includes('50/50') && !label.text.includes('Quarters'); }); // Ensure white fill for all line chart legend boxes filteredLabels.forEach((label) => { label.fillStyle = 'white'; }); return filteredLabels; } } } : { position: 'top', align: 'start', labels: { usePointStyle: false, boxWidth: 12, boxHeight: 12, padding: 12, filter: function(legendItem, chartData) { return !legendItem.text.includes('NCAA Avg SR') && !legendItem.text.includes('Quarters') && !legendItem.text.includes('50/50'); }, generateLabels: function(chart) { const data = chart.data; if (data.datasets.length) { return data.datasets.map((dataset, i) => { // Handle backgroundColor arrays (like in Overall Team Performance chart) let fillColor = dataset.backgroundColor; if (dataset.label === '# Plays') { fillColor = 'white'; } else if (Array.isArray(dataset.backgroundColor)) { // For datasets with backgroundColor arrays, use the first color for legend fillColor = dataset.backgroundColor[0]; } return { text: dataset.label, fillStyle: fillColor, strokeStyle: dataset.label === '# Plays' ? '#666' : dataset.borderColor, lineWidth: dataset.label === '# Plays' ? 1 : dataset.borderWidth, hidden: !chart.isDatasetVisible(i), datasetIndex: i }; }).filter((item, index) => { // Apply the same filter logic as above const dataset = chart.data.datasets[index]; if (!dataset || !dataset.data) return false; if (dataset.label === '# Plays') return true; // Always show # Plays if (dataset.label && (dataset.label.includes('NCAA Avg SR') || dataset.label.includes('Quarters') || dataset.label.includes('50/50'))) return false; return dataset.data.some((value) => value > 0); }); } return []; } } }, tooltip: { filter: function(tooltipItem) { if ('team-drive-metrics'.includes('play-map')) { return !tooltipItem.dataset.label.includes('< 0') && !tooltipItem.dataset.label.includes('Quarters') && !tooltipItem.dataset.label.includes('Drive'); } return !tooltipItem.dataset.label.includes('NCAA Avg SR') && !tooltipItem.dataset.label.includes('50/50') && !tooltipItem.dataset.label.includes('< 0') && !tooltipItem.dataset.label.includes('Quarters'); }, callbacks: { label: function(context) { const label = context.dataset.label || ''; let labelText; // Play maps show yards instead of percentages if ('team-drive-metrics'.includes('play-map')) { labelText = label + ': ' + context.parsed.y + ' yards'; } else { const value = Math.round(context.parsed.y * 100); labelText = label + ': ' + value + '%'; } // For line charts, include play text if available if ('bar' === 'line' && context.raw && context.raw.text) { return [labelText, context.raw.text]; } return labelText; } } } }, scales: 'bar' === 'line' ? 'team-drive-metrics'.includes('play-map') ? { x: { type: 'linear', position: 'bottom', title: { display: true, text: 'Play Number' }, min: 1, ticks: { stepSize: 1, callback: function(value) { return Math.floor(value); } }, grid: { display: false } }, y: { title: { display: true, text: 'Yards Gained' }, min: chartData.minY, max: chartData.maxY } } : { x: { type: 'linear', position: 'bottom', title: { display: true, text: 'team-drive-metrics'.includes('team-lines') ? 'Play Number' : 'Team Play Number' }, min: 1, ticks: { stepSize: 1, callback: function(value) { return Math.floor(value); } }, grid: { display: false } }, y: { max: 1, min: 0, ticks: { callback: function(value) { return Math.round(value * 100) + '%'; } } } } : 'team-drive-metrics'.includes('drive-metrics') ? { y: { stacked: false, max: 1, ticks: { callback: function(value) { return Math.round(value * 100) + '%'; } } }, y1: { display: false, type: 'linear', position: 'right' } } : ('team-drive-metrics'.includes('top-rushers') || 'team-drive-metrics'.includes('top-passers') || 'team-drive-metrics'.includes('top-receivers')) ? { x: { stacked: true }, y: { stacked: true } } : { y: { max: 1, min: 0, stacked: false, ticks: { callback: function(value) { return Math.round(value * 100) + '%'; } } } } }; // Add indexAxis for player charts if ('team-drive-metrics'.includes('top-rushers') || 'team-drive-metrics'.includes('top-passers') || 'team-drive-metrics'.includes('top-receivers')) { chartOptions.indexAxis = 'y'; } // Initialize the chart const ctx = canvas.getContext('2d'); const chart = new Chart(ctx, { type: 'bar', data: chartData, options: chartOptions }); // Store reference to prevent re-initialization canvas.chartInstance = chart; console.log('CFB Chart initialized successfully'); } catch (error) { console.error('Error initializing CFB chart:', error); // Fallback: show error message in canvas container const container = document.getElementById('cfb-chart-1757875585353-pp2t5v30j').parentNode; if (container) { container.innerHTML = '
Chart failed to load. Please refresh the page.
'; } } } // Initialize when DOM is ready if (document.readyState === 'loading') { document.addEventListener('DOMContentLoaded', initChart); } else { initChart(); } // Also try initialization after a short delay for WordPress compatibility setTimeout(initChart, 500); })();
I just threw this one in to call out (a) how handsome this hear drives chart is, with six Alabama drives in a row delivering above-average (and often very high) efficiencies; and (b) to call out that we have another week with a few double-digit-play count drives from this team, which is remarkable.
I’m starting to wonder if the longer drives thing is a Ty Simpson thing. He distributes the ball better, is more careful and uses his options, and is fairly practical (though not perfect) when choosing when and how to scramble. And honestly, there were a few Ty scrambles yesterday where I found myself saying … yeah, the passes would’ve been worse, but Jalen Milroe would’ve taken that to the house.
For now I’ll take this tradeoff year over year — if for my heart health alone — but I wonder if starting a QB like Milroe just means you’re gonna have shorter drives (boom or bust) whether you like it or not.
Are we missing Jam? (Hopefully so)
Top rushers body { font-family: -apple-system, BlinkMacSystemFont, 'Segoe UI', 'Roboto', sans-serif; margin: 0; padding: 20px; background: #f8fafc; } .chart-container { background: white; border-radius: 12px; border: 1px solid #e5e5e5; box-shadow: 0 1px 3px rgba(0, 0, 0, 0.1); overflow: hidden; } .chart-header { padding: 18px 24px 16px; border-bottom: 1px solid #e5e5e5; background: white; } .chart-title { font-size: 18px; font-weight: 600; color: #171717; margin: 0; } .chart-content { padding: 20px 24px 24px !important; } @media (max-width: 640px) { .chart-content { padding: 12px 16px 20px !important; } .chart-header { padding: 12px 16px 12px !important; } .embed-footer-top { padding: 8px 12px !important; } .data-definitions { padding: 12px !important; } body { padding: 12px !important; } } .chart-content.top-receivers { height: 624px; } .chart-content.top-passers { height: 280px !important; } .chart-content.top-rushers { height: 460px; } .chart-content:not(.top-receivers):not(.top-passers):not(.top-rushers) { height: 372px; } .embed-footer { border-top: 1px solid #e5e5e5; font-size: 12px; color: #737373; } .embed-footer-top { display: flex; justify-content: space-between; align-items: center; padding: 12px 16px; } .embed-footer-link { color: #737373; text-decoration: none; font-weight: 500; } .embed-footer-link:hover { color: #525252; text-decoration: underline; } .data-definitions-toggle { background: none; border: none; color: #737373; font-size: 12px; font-weight: 500; cursor: pointer; display: flex; align-items: center; gap: 4px; padding: 0; } .data-definitions-toggle:hover { color: #525252; } .caret { transition: transform 0.2s ease; font-size: 10px; } .caret.expanded { transform: rotate(180deg); } .data-definitions { display: none; padding: 16px; background: #fafafa; border-top: 1px solid #e5e5e5; font-size: 12px; line-height: 1.4; } .data-definitions.expanded { display: block; } .data-definitions ul { margin: 0; padding-left: 0; list-style: none; } .data-definitions li { margin-bottom: 4px; }
// Toggle data definitions accordion - unique function per embed function toggleDefinitions_cfb_chart_1757875607096_n4wvlid50() { const definitions = document.getElementById('dataDefinitions_cfb-chart-1757875607096-n4wvlid50'); const caret = document.getElementById('caret_cfb-chart-1757875607096-n4wvlid50'); if (definitions.classList.contains('expanded')) { definitions.classList.remove('expanded'); caret.classList.remove('expanded'); } else { definitions.classList.add('expanded'); caret.classList.add('expanded'); } } // WordPress-safe chart initialization with defensive checks (function() { 'use strict'; function initChart() { // Check if Chart.js is available if (typeof Chart === 'undefined') { console.warn('Chart.js not loaded yet, retrying...'); setTimeout(initChart, 100); return; } // Check if datalabels plugin is available if (typeof ChartDataLabels === 'undefined') { console.warn('ChartDataLabels plugin not loaded yet, retrying...'); setTimeout(initChart, 100); return; } // Check if canvas element exists const canvas = document.getElementById('cfb-chart-1757875607096-n4wvlid50'); if (!canvas) { console.warn('Canvas element not found yet, retrying...'); setTimeout(initChart, 100); return; } // Prevent multiple chart instances if (canvas.chartInstance) { console.log('Chart already initialized'); return; } try { // Register the datalabels plugin Chart.register(ChartDataLabels); // Embed actual chart data directly const chartData = { "labels": [ "Kevin Riley", "Ty Simpson", "Richard Young", "Dre Washington", "AK Dear", "Germie Bernard", "Danny O'Neil", "Darrion Dupree", "Dilin Jones", "Cade Yacamelli", "Trech Kekahuna", "Tyrell Henry", "Jackson Acker" ], "datasets": [ { "label": "Explosive rushes", "data": [ 0, 1, 0, 0, 0, 0, 0, 0, 0, 0, 0, 0, 0 ], "backgroundColor": [ "rgba(101, 0, 20, 0.8)", "rgba(101, 0, 20, 0.8)", "rgba(101, 0, 20, 0.8)", "rgba(101, 0, 20, 0.8)", "rgba(101, 0, 20, 0.8)", "rgba(101, 0, 20, 0.8)", "rgba(118, 10, 20, 0.8)", "rgba(118, 10, 20, 0.8)", "rgba(118, 10, 20, 0.8)", "rgba(118, 10, 20, 0.8)", "rgba(118, 10, 20, 0.8)", "rgba(118, 10, 20, 0.8)", "rgba(118, 10, 20, 0.8)" ], "borderColor": "#374151", "borderWidth": 1 }, { "label": "Successful rushes", "data": [ 1, 1, 0, 2, 2, 1, 4, 2, 3, 3, 0, 1, 1 ], "backgroundColor": [ "rgba(175, 40, 60, 0.8)", "rgba(175, 40, 60, 0.8)", "rgba(175, 40, 60, 0.8)", "rgba(175, 40, 60, 0.8)", "rgba(175, 40, 60, 0.8)", "rgba(175, 40, 60, 0.8)", "rgba(226, 55, 70, 0.8)", "rgba(226, 55, 70, 0.8)", "rgba(226, 55, 70, 0.8)", "rgba(226, 55, 70, 0.8)", "rgba(226, 55, 70, 0.8)", "rgba(226, 55, 70, 0.8)", "rgba(226, 55, 70, 0.8)" ], "borderColor": "#374151", "borderWidth": 1 }, { "label": "Unsuccessful rushes", "data": [ 6, 3, 4, 0, 0, 0, 4, 5, 2, 2, 2, 1, 0 ], "backgroundColor": "#FFFFFF", "borderColor": "#374151", "borderWidth": 1 } ], "currentParams": { "year": 2025, "week": 3, "seasonType": "regular", "team": "Alabama", "gameId": "401752696" } }; // Chart options (WordPress-safe) const chartOptions = { responsive: true, maintainAspectRatio: false, animation: { duration: 0 // Disable animations to prevent conflicts }, elements: 'bar' === 'line' ? 'top-rushers'.includes('play-map') ? { line: { tension: 0, borderWidth: 0 } } : { line: { tension: 0.25, borderWidth: 2.2 }, point: { pointRadius: 'top-rushers'.includes('team-lines') ? 0 : undefined } } : {}, plugins: { datalabels: { display: function(context) { // Suppress data labels on line charts if ('bar' === 'line') { return false; } return context.dataset.datalabels && context.dataset.datalabels.display === true; }, formatter: function(value, context) { // Special handling for Overall Team Performance chart if ('top-rushers' === 'overall-team-performance' && context.dataset.label === 'Success Rate (SR)') { // Use the stored play count data if (context.dataset.playCountData && context.dataset.playCountData[context.dataIndex]) { return context.dataset.playCountData[context.dataIndex]; } // Fallback to percentage if play count data not available return Math.round(value * 100) + '%'; } // Handle bar charts with count data (play-type, quarter, down, etc.) if (context.dataset.label && context.dataset.label.includes(' SR') && (chartData.teamCounts || chartData.oppCounts)) { // Find the first team SR dataset in the chart to determine team order const allDatasets = context.chart.data.datasets; const teamSRDataset = allDatasets.find(d => d.label && d.label.includes(' SR') && !d.label.includes('NCAA')); // If this is the first team's SR dataset, use teamCounts if (teamSRDataset && context.dataset.label === teamSRDataset.label && chartData.teamCounts) { return chartData.teamCounts[context.dataIndex] || 0; } // Otherwise, use oppCounts for the second team else if (chartData.oppCounts) { return chartData.oppCounts[context.dataIndex] || 0; } } // For player charts, show value only if > 0 (matches non-embedded behavior) if ('top-rushers'.includes('top-rushers') || 'top-rushers'.includes('top-passers') || 'top-rushers'.includes('top-receivers')) { // Hide data labels for zero or negative values, show actual value for positive values return value > 0 ? value : null; } // For other charts, show values based on type if (typeof value === 'number') { // If value is between 0 and 1, treat as percentage if (value >= 0 && value 0 ? '#26262660' : 'transparent'; }, borderColor: function(context) { const value = context.dataset.data[context.dataIndex]; return value > 0 ? 'rgba(255, 255, 255, 0.2)' : 'transparent'; }, borderRadius: 4, align: 'center', anchor: 'center' }, legend: 'bar' === 'line' ? { position: 'top', align: 'start', labels: 'top-rushers'.includes('play-map') ? { usePointStyle: true, generateLabels: function(chart) { // Call the original generateLabels to get default styling const original = Chart.defaults.plugins.legend.labels.generateLabels; const labels = original.call(this, chart); // Filter and customize each label const filteredLabels = labels.filter(label => { return !label.text.includes(' { const dataset = chart.data.datasets[label.datasetIndex]; if (dataset && dataset.label) { if (dataset.label.includes('Rush')) { label.pointStyle = 'circle'; label.pointStyleWidth = 4; label.fillStyle = 'white'; } else if (dataset.label.includes('Pass')) { label.pointStyle = 'triangle'; label.pointStyleWidth = 4; label.fillStyle = 'white'; } else { label.pointStyle = 'rect'; label.pointStyleWidth = 4; label.fillStyle = 'white'; } } }); return filteredLabels; }, boxWidth: 20, padding: 12 } : { usePointStyle: false, boxWidth: 12, boxHeight: 12, padding: 12, generateLabels: function(chart) { const original = Chart.defaults.plugins.legend.labels.generateLabels; const labels = original.call(this, chart); // Filter out reference areas and ensure white fill const filteredLabels = labels.filter(label => { return !label.text.includes('NCAA Avg SR') && !label.text.includes('50/50') && !label.text.includes('Quarters'); }); // Ensure white fill for all line chart legend boxes filteredLabels.forEach((label) => { label.fillStyle = 'white'; }); return filteredLabels; } } } : { position: 'top', align: 'start', labels: { usePointStyle: false, boxWidth: 12, boxHeight: 12, padding: 12, filter: function(legendItem, chartData) { return !legendItem.text.includes('NCAA Avg SR') && !legendItem.text.includes('Quarters') && !legendItem.text.includes('50/50'); }, generateLabels: function(chart) { const data = chart.data; if (data.datasets.length) { return data.datasets.map((dataset, i) => { // Handle backgroundColor arrays (like in Overall Team Performance chart) let fillColor = dataset.backgroundColor; if (dataset.label === '# Plays') { fillColor = 'white'; } else if (Array.isArray(dataset.backgroundColor)) { // For datasets with backgroundColor arrays, use the first color for legend fillColor = dataset.backgroundColor[0]; } return { text: dataset.label, fillStyle: fillColor, strokeStyle: dataset.label === '# Plays' ? '#666' : dataset.borderColor, lineWidth: dataset.label === '# Plays' ? 1 : dataset.borderWidth, hidden: !chart.isDatasetVisible(i), datasetIndex: i }; }).filter((item, index) => { // Apply the same filter logic as above const dataset = chart.data.datasets[index]; if (!dataset || !dataset.data) return false; if (dataset.label === '# Plays') return true; // Always show # Plays if (dataset.label && (dataset.label.includes('NCAA Avg SR') || dataset.label.includes('Quarters') || dataset.label.includes('50/50'))) return false; return dataset.data.some((value) => value > 0); }); } return []; } } }, tooltip: { filter: function(tooltipItem) { if ('top-rushers'.includes('play-map')) { return !tooltipItem.dataset.label.includes('< 0') && !tooltipItem.dataset.label.includes('Quarters') && !tooltipItem.dataset.label.includes('Drive'); } return !tooltipItem.dataset.label.includes('NCAA Avg SR') && !tooltipItem.dataset.label.includes('50/50') && !tooltipItem.dataset.label.includes('< 0') && !tooltipItem.dataset.label.includes('Quarters'); }, callbacks: { label: function(context) { const label = context.dataset.label || ''; let labelText; // Play maps show yards instead of percentages if ('top-rushers'.includes('play-map')) { labelText = label + ': ' + context.parsed.y + ' yards'; } else { const value = Math.round(context.parsed.y * 100); labelText = label + ': ' + value + '%'; } // For line charts, include play text if available if ('bar' === 'line' && context.raw && context.raw.text) { return [labelText, context.raw.text]; } return labelText; } } } }, scales: 'bar' === 'line' ? 'top-rushers'.includes('play-map') ? { x: { type: 'linear', position: 'bottom', title: { display: true, text: 'Play Number' }, min: 1, ticks: { stepSize: 1, callback: function(value) { return Math.floor(value); } }, grid: { display: false } }, y: { title: { display: true, text: 'Yards Gained' }, min: chartData.minY, max: chartData.maxY } } : { x: { type: 'linear', position: 'bottom', title: { display: true, text: 'top-rushers'.includes('team-lines') ? 'Play Number' : 'Team Play Number' }, min: 1, ticks: { stepSize: 1, callback: function(value) { return Math.floor(value); } }, grid: { display: false } }, y: { max: 1, min: 0, ticks: { callback: function(value) { return Math.round(value * 100) + '%'; } } } } : 'top-rushers'.includes('drive-metrics') ? { y: { stacked: false, max: 1, ticks: { callback: function(value) { return Math.round(value * 100) + '%'; } } }, y1: { display: false, type: 'linear', position: 'right' } } : ('top-rushers'.includes('top-rushers') || 'top-rushers'.includes('top-passers') || 'top-rushers'.includes('top-receivers')) ? { x: { stacked: true }, y: { stacked: true } } : { y: { max: 1, min: 0, stacked: false, ticks: { callback: function(value) { return Math.round(value * 100) + '%'; } } } } }; // Add indexAxis for player charts if ('top-rushers'.includes('top-rushers') || 'top-rushers'.includes('top-passers') || 'top-rushers'.includes('top-receivers')) { chartOptions.indexAxis = 'y'; } // Initialize the chart const ctx = canvas.getContext('2d'); const chart = new Chart(ctx, { type: 'bar', data: chartData, options: chartOptions }); // Store reference to prevent re-initialization canvas.chartInstance = chart; console.log('CFB Chart initialized successfully'); } catch (error) { console.error('Error initializing CFB chart:', error); // Fallback: show error message in canvas container const container = document.getElementById('cfb-chart-1757875607096-n4wvlid50').parentNode; if (container) { container.innerHTML = '
Chart failed to load. Please refresh the page.
'; } } } // Initialize when DOM is ready if (document.readyState === 'loading') { document.addEventListener('DOMContentLoaded', initChart); } else { initChart(); } // Also try initialization after a short delay for WordPress compatibility setTimeout(initChart, 500); })();
Funny enough, Richard Young was kinda supposed to be our starting back with Jam Miller out. But here he is with a 1-for-4 efficiency, another tepid line this season. Even our emergent darling Kevin Riley had an inefficient 1-for-7 outing as our leading rusher on the day (albeit with a few catches, including an explosive, too).
Ty Simpson wasn’t efficient on the ground but broke through once or twice, including delivering Bama’s only explosive rush on the day.
I’ll take a silver lining of seeing Dre Washington and A.K. Dear doing well in mop-up time. We also saw some creativity in getting Germie the ball close to the end zone. But otherwise, it feels like we’ve got a bunch of capable backs, but not a particularly capable run game. I wonder if Jam Miller will fix it (or if Jaeden Roberts and Michael Carroll already have, per Josh’s note on Initial Impressions).
Grubb’s favored sons
Top receivers body { font-family: -apple-system, BlinkMacSystemFont, 'Segoe UI', 'Roboto', sans-serif; margin: 0; padding: 20px; background: #f8fafc; } .chart-container { background: white; border-radius: 12px; border: 1px solid #e5e5e5; box-shadow: 0 1px 3px rgba(0, 0, 0, 0.1); overflow: hidden; } .chart-header { padding: 18px 24px 16px; border-bottom: 1px solid #e5e5e5; background: white; } .chart-title { font-size: 18px; font-weight: 600; color: #171717; margin: 0; } .chart-content { padding: 20px 24px 24px !important; } @media (max-width: 640px) { .chart-content { padding: 12px 16px 20px !important; } .chart-header { padding: 12px 16px 12px !important; } .embed-footer-top { padding: 8px 12px !important; } .data-definitions { padding: 12px !important; } body { padding: 12px !important; } } .chart-content.top-receivers { height: 624px; } .chart-content.top-passers { height: 280px !important; } .chart-content.top-rushers { height: 372px; } .chart-content:not(.top-receivers):not(.top-passers):not(.top-rushers) { height: 372px; } .embed-footer { border-top: 1px solid #e5e5e5; font-size: 12px; color: #737373; } .embed-footer-top { display: flex; justify-content: space-between; align-items: center; padding: 12px 16px; } .embed-footer-link { color: #737373; text-decoration: none; font-weight: 500; } .embed-footer-link:hover { color: #525252; text-decoration: underline; } .data-definitions-toggle { background: none; border: none; color: #737373; font-size: 12px; font-weight: 500; cursor: pointer; display: flex; align-items: center; gap: 4px; padding: 0; } .data-definitions-toggle:hover { color: #525252; } .caret { transition: transform 0.2s ease; font-size: 10px; } .caret.expanded { transform: rotate(180deg); } .data-definitions { display: none; padding: 16px; background: #fafafa; border-top: 1px solid #e5e5e5; font-size: 12px; line-height: 1.4; } .data-definitions.expanded { display: block; } .data-definitions ul { margin: 0; padding-left: 0; list-style: none; } .data-definitions li { margin-bottom: 4px; }
// Toggle data definitions accordion - unique function per embed function toggleDefinitions_cfb_chart_1757875679613_6iid6b5a7() { const definitions = document.getElementById('dataDefinitions_cfb-chart-1757875679613-6iid6b5a7'); const caret = document.getElementById('caret_cfb-chart-1757875679613-6iid6b5a7'); if (definitions.classList.contains('expanded')) { definitions.classList.remove('expanded'); caret.classList.remove('expanded'); } else { definitions.classList.add('expanded'); caret.classList.add('expanded'); } } // WordPress-safe chart initialization with defensive checks (function() { 'use strict'; function initChart() { // Check if Chart.js is available if (typeof Chart === 'undefined') { console.warn('Chart.js not loaded yet, retrying...'); setTimeout(initChart, 100); return; } // Check if datalabels plugin is available if (typeof ChartDataLabels === 'undefined') { console.warn('ChartDataLabels plugin not loaded yet, retrying...'); setTimeout(initChart, 100); return; } // Check if canvas element exists const canvas = document.getElementById('cfb-chart-1757875679613-6iid6b5a7'); if (!canvas) { console.warn('Canvas element not found yet, retrying...'); setTimeout(initChart, 100); return; } // Prevent multiple chart instances if (canvas.chartInstance) { console.log('Chart already initialized'); return; } try { // Register the datalabels plugin Chart.register(ChartDataLabels); // Embed actual chart data directly const chartData = { "labels": [ "Ryan Williams", "Isaiah Horton", "Germie Bernard", "Kevin Riley", "Josh Cuevas", "Lotzeir Brooks", "Dre Washington", "Kaleb Edwards", "Darrion Dupree", "Lance Mason", "Dilin Jones", "Grant Stec", "Vinny Anthony II", "Jackson Acker", "Jaen Ballard" ], "datasets": [ { "label": "Explosive catches", "data": [ 4, 1, 2, 1, 0, 1, 1, 0, 0, 1, 0, 0, 0, 0, 1 ], "backgroundColor": [ "rgba(101, 0, 20, 0.8)", "rgba(101, 0, 20, 0.8)", "rgba(101, 0, 20, 0.8)", "rgba(101, 0, 20, 0.8)", "rgba(101, 0, 20, 0.8)", "rgba(101, 0, 20, 0.8)", "rgba(101, 0, 20, 0.8)", "rgba(101, 0, 20, 0.8)", "rgba(118, 10, 20, 0.8)", "rgba(118, 10, 20, 0.8)", "rgba(118, 10, 20, 0.8)", "rgba(118, 10, 20, 0.8)", "rgba(118, 10, 20, 0.8)", "rgba(118, 10, 20, 0.8)", "rgba(118, 10, 20, 0.8)" ], "borderColor": "#374151", "borderWidth": 1 }, { "label": "Successful catches", "data": [ 1, 3, 1, 0, 3, 1, 0, 1, 1, 1, 2, 1, 1, 1, 0 ], "backgroundColor": [ "rgba(175, 40, 60, 0.8)", "rgba(175, 40, 60, 0.8)", "rgba(175, 40, 60, 0.8)", "rgba(175, 40, 60, 0.8)", "rgba(175, 40, 60, 0.8)", "rgba(175, 40, 60, 0.8)", "rgba(175, 40, 60, 0.8)", "rgba(175, 40, 60, 0.8)", "rgba(226, 55, 70, 0.8)", "rgba(226, 55, 70, 0.8)", "rgba(226, 55, 70, 0.8)", "rgba(226, 55, 70, 0.8)", "rgba(226, 55, 70, 0.8)", "rgba(226, 55, 70, 0.8)", "rgba(226, 55, 70, 0.8)" ], "borderColor": "#374151", "borderWidth": 1 }, { "label": "Other catches", "data": [ 0, 1, 1, 2, 0, 0, 0, 0, 2, 0, 0, 0, 0, 0, 0 ], "backgroundColor": [ "rgba(245, 229, 233, 0.8)", "rgba(245, 229, 233, 0.8)", "rgba(245, 229, 233, 0.8)", "rgba(245, 229, 233, 0.8)", "rgba(245, 229, 233, 0.8)", "rgba(245, 229, 233, 0.8)", "rgba(245, 229, 233, 0.8)", "rgba(245, 229, 233, 0.8)", "rgba(253, 231, 233, 0.8)", "rgba(253, 231, 233, 0.8)", "rgba(253, 231, 233, 0.8)", "rgba(253, 231, 233, 0.8)", "rgba(253, 231, 233, 0.8)", "rgba(253, 231, 233, 0.8)", "rgba(253, 231, 233, 0.8)" ], "borderColor": "#374151", "borderWidth": 1 } ], "currentParams": { "year": 2025, "week": 3, "seasonType": "regular", "team": "Alabama", "gameId": "401752696" } }; // Chart options (WordPress-safe) const chartOptions = { responsive: true, maintainAspectRatio: false, animation: { duration: 0 // Disable animations to prevent conflicts }, elements: 'bar' === 'line' ? 'top-receivers'.includes('play-map') ? { line: { tension: 0, borderWidth: 0 } } : { line: { tension: 0.25, borderWidth: 2.2 }, point: { pointRadius: 'top-receivers'.includes('team-lines') ? 0 : undefined } } : {}, plugins: { datalabels: { display: function(context) { // Suppress data labels on line charts if ('bar' === 'line') { return false; } return context.dataset.datalabels && context.dataset.datalabels.display === true; }, formatter: function(value, context) { // Special handling for Overall Team Performance chart if ('top-receivers' === 'overall-team-performance' && context.dataset.label === 'Success Rate (SR)') { // Use the stored play count data if (context.dataset.playCountData && context.dataset.playCountData[context.dataIndex]) { return context.dataset.playCountData[context.dataIndex]; } // Fallback to percentage if play count data not available return Math.round(value * 100) + '%'; } // Handle bar charts with count data (play-type, quarter, down, etc.) if (context.dataset.label && context.dataset.label.includes(' SR') && (chartData.teamCounts || chartData.oppCounts)) { // Find the first team SR dataset in the chart to determine team order const allDatasets = context.chart.data.datasets; const teamSRDataset = allDatasets.find(d => d.label && d.label.includes(' SR') && !d.label.includes('NCAA')); // If this is the first team's SR dataset, use teamCounts if (teamSRDataset && context.dataset.label === teamSRDataset.label && chartData.teamCounts) { return chartData.teamCounts[context.dataIndex] || 0; } // Otherwise, use oppCounts for the second team else if (chartData.oppCounts) { return chartData.oppCounts[context.dataIndex] || 0; } } // For player charts, show value only if > 0 (matches non-embedded behavior) if ('top-receivers'.includes('top-rushers') || 'top-receivers'.includes('top-passers') || 'top-receivers'.includes('top-receivers')) { // Hide data labels for zero or negative values, show actual value for positive values return value > 0 ? value : null; } // For other charts, show values based on type if (typeof value === 'number') { // If value is between 0 and 1, treat as percentage if (value >= 0 && value 0 ? '#26262660' : 'transparent'; }, borderColor: function(context) { const value = context.dataset.data[context.dataIndex]; return value > 0 ? 'rgba(255, 255, 255, 0.2)' : 'transparent'; }, borderRadius: 4, align: 'center', anchor: 'center' }, legend: 'bar' === 'line' ? { position: 'top', align: 'start', labels: 'top-receivers'.includes('play-map') ? { usePointStyle: true, generateLabels: function(chart) { // Call the original generateLabels to get default styling const original = Chart.defaults.plugins.legend.labels.generateLabels; const labels = original.call(this, chart); // Filter and customize each label const filteredLabels = labels.filter(label => { return !label.text.includes(' { const dataset = chart.data.datasets[label.datasetIndex]; if (dataset && dataset.label) { if (dataset.label.includes('Rush')) { label.pointStyle = 'circle'; label.pointStyleWidth = 4; label.fillStyle = 'white'; } else if (dataset.label.includes('Pass')) { label.pointStyle = 'triangle'; label.pointStyleWidth = 4; label.fillStyle = 'white'; } else { label.pointStyle = 'rect'; label.pointStyleWidth = 4; label.fillStyle = 'white'; } } }); return filteredLabels; }, boxWidth: 20, padding: 12 } : { usePointStyle: false, boxWidth: 12, boxHeight: 12, padding: 12, generateLabels: function(chart) { const original = Chart.defaults.plugins.legend.labels.generateLabels; const labels = original.call(this, chart); // Filter out reference areas and ensure white fill const filteredLabels = labels.filter(label => { return !label.text.includes('NCAA Avg SR') && !label.text.includes('50/50') && !label.text.includes('Quarters'); }); // Ensure white fill for all line chart legend boxes filteredLabels.forEach((label) => { label.fillStyle = 'white'; }); return filteredLabels; } } } : { position: 'top', align: 'start', labels: { usePointStyle: false, boxWidth: 12, boxHeight: 12, padding: 12, filter: function(legendItem, chartData) { return !legendItem.text.includes('NCAA Avg SR') && !legendItem.text.includes('Quarters') && !legendItem.text.includes('50/50'); }, generateLabels: function(chart) { const data = chart.data; if (data.datasets.length) { return data.datasets.map((dataset, i) => { // Handle backgroundColor arrays (like in Overall Team Performance chart) let fillColor = dataset.backgroundColor; if (dataset.label === '# Plays') { fillColor = 'white'; } else if (Array.isArray(dataset.backgroundColor)) { // For datasets with backgroundColor arrays, use the first color for legend fillColor = dataset.backgroundColor[0]; } return { text: dataset.label, fillStyle: fillColor, strokeStyle: dataset.label === '# Plays' ? '#666' : dataset.borderColor, lineWidth: dataset.label === '# Plays' ? 1 : dataset.borderWidth, hidden: !chart.isDatasetVisible(i), datasetIndex: i }; }).filter((item, index) => { // Apply the same filter logic as above const dataset = chart.data.datasets[index]; if (!dataset || !dataset.data) return false; if (dataset.label === '# Plays') return true; // Always show # Plays if (dataset.label && (dataset.label.includes('NCAA Avg SR') || dataset.label.includes('Quarters') || dataset.label.includes('50/50'))) return false; return dataset.data.some((value) => value > 0); }); } return []; } } }, tooltip: { filter: function(tooltipItem) { if ('top-receivers'.includes('play-map')) { return !tooltipItem.dataset.label.includes('< 0') && !tooltipItem.dataset.label.includes('Quarters') && !tooltipItem.dataset.label.includes('Drive'); } return !tooltipItem.dataset.label.includes('NCAA Avg SR') && !tooltipItem.dataset.label.includes('50/50') && !tooltipItem.dataset.label.includes('< 0') && !tooltipItem.dataset.label.includes('Quarters'); }, callbacks: { label: function(context) { const label = context.dataset.label || ''; let labelText; // Play maps show yards instead of percentages if ('top-receivers'.includes('play-map')) { labelText = label + ': ' + context.parsed.y + ' yards'; } else { const value = Math.round(context.parsed.y * 100); labelText = label + ': ' + value + '%'; } // For line charts, include play text if available if ('bar' === 'line' && context.raw && context.raw.text) { return [labelText, context.raw.text]; } return labelText; } } } }, scales: 'bar' === 'line' ? 'top-receivers'.includes('play-map') ? { x: { type: 'linear', position: 'bottom', title: { display: true, text: 'Play Number' }, min: 1, ticks: { stepSize: 1, callback: function(value) { return Math.floor(value); } }, grid: { display: false } }, y: { title: { display: true, text: 'Yards Gained' }, min: chartData.minY, max: chartData.maxY } } : { x: { type: 'linear', position: 'bottom', title: { display: true, text: 'top-receivers'.includes('team-lines') ? 'Play Number' : 'Team Play Number' }, min: 1, ticks: { stepSize: 1, callback: function(value) { return Math.floor(value); } }, grid: { display: false } }, y: { max: 1, min: 0, ticks: { callback: function(value) { return Math.round(value * 100) + '%'; } } } } : 'top-receivers'.includes('drive-metrics') ? { y: { stacked: false, max: 1, ticks: { callback: function(value) { return Math.round(value * 100) + '%'; } } }, y1: { display: false, type: 'linear', position: 'right' } } : ('top-receivers'.includes('top-rushers') || 'top-receivers'.includes('top-passers') || 'top-receivers'.includes('top-receivers')) ? { x: { stacked: true }, y: { stacked: true } } : { y: { max: 1, min: 0, stacked: false, ticks: { callback: function(value) { return Math.round(value * 100) + '%'; } } } } }; // Add indexAxis for player charts if ('top-receivers'.includes('top-rushers') || 'top-receivers'.includes('top-passers') || 'top-receivers'.includes('top-receivers')) { chartOptions.indexAxis = 'y'; } // Initialize the chart const ctx = canvas.getContext('2d'); const chart = new Chart(ctx, { type: 'bar', data: chartData, options: chartOptions }); // Store reference to prevent re-initialization canvas.chartInstance = chart; console.log('CFB Chart initialized successfully'); } catch (error) { console.error('Error initializing CFB chart:', error); // Fallback: show error message in canvas container const container = document.getElementById('cfb-chart-1757875679613-6iid6b5a7').parentNode; if (container) { container.innerHTML = '
Chart failed to load. Please refresh the page.
'; } } } // Initialize when DOM is ready if (document.readyState === 'loading') { document.addEventListener('DOMContentLoaded', initChart); } else { initChart(); } // Also try initialization after a short delay for WordPress compatibility setTimeout(initChart, 500); })();
But let’s end on a happier chart: Ty Simpson distributed the heck outta that thing and gave the receivers plenty of chances to make highlights. The familiar patterns emerged:
- Germie is rock solid, I bet he scores at least once in every game this season
- Ryan Williams is still overcoming some drops, but can still unexpectedly turn a catch anywhere near the sidelines into a touchdown
- Josh Cuevas is there when you need him. A tight end!
Plus, some newer names have started showing up in the table: Isaiah Horton is apparently healed up and showed some solid hands and decision making. Lotzy Brooks is really, really making a case for playing time with his consistent efforts. Plus: Dre Washington caught and explosive out of the backfield, and freshman TE Kaleb Edwards brought some of that fall camp energy we’d heard all about.
All of the charts from Bama vs. Wisconsin are here. And, listen, overall the charts are a little kinder to the Badgers than the traditional box score was, but outside of a few foibles — plus some potential warning signs on the running game — this was a satisfying beating of a P4 foe.
Plus, this happened …
Box Score – Clemson vs Georgia Tech body { font-family: -apple-system, BlinkMacSystemFont, 'Segoe UI', 'Roboto', sans-serif; margin: 0; padding: 0; background: #f8fafc; } .embed-container { background: white; border-radius: 12px; border: 1px solid #e5e5e5; box-shadow: 0 1px 3px rgba(0, 0, 0, 0.1); overflow: hidden; max-width: 800px; margin: 0 auto; padding: 0; } .header { padding: 18px 24px 16px; border-bottom: 1px solid #e5e5e5; background: white; } .title { font-size: 18px; font-weight: 600; color: #171717; margin: 0; } .table-wrapper { padding: 0; } table { min-width: 100%; table-layout: fixed; border-collapse: collapse; } .col-stat { width: auto; } .col-team { width: 140px; } thead tr { background-color: #525252; color: white; } th { padding: 12px 16px; text-align: left; font-size: 14px; font-weight: 600; border-bottom: 4px solid #475569; text-align: center; } th.stat-header { text-align: left; } tbody tr { border-bottom: 1px solid #e5e5e5; } .bg-white { background-color: #ffffff; } .bg-neutral-50 { background-color: #fafafa; } .px-4 { padding-left: 1rem; padding-right: 1rem; } .py-3 { padding-top: 0.75rem; padding-bottom: 0.75rem; } .text-sm { font-size: 0.875rem; } .font-medium { font-weight: 500; } .font-semibold { font-weight: 600; } .text-neutral-900 { color: #171717; } .text-center { text-align: center; } .embed-footer { border-top: 1px solid #e5e5e5; font-size: 12px; color: #737373; } .embed-footer-top { display: flex; justify-content: center; align-items: center; padding: 12px 16px; } .embed-footer-link { color: #737373; text-decoration: none; font-weight: 500; } .embed-footer-link:hover { color: #525252; text-decoration: underline; } @media (max-width: 640px) { .header { padding: 12px 16px; } th, td { padding: 8px 12px; } .title { font-size: 16px; } .embed-footer-top { padding: 8px 12px; } .col-team { width: 80px; } th, td { font-size: 13px; } }
| Clemson |
Georgia Tech |
| Points |
21 |
24 |
| Game Excitement |
5.8 |
5.8 |
| Total yards |
381 |
358 |
| Rush yards |
174 |
147 |
| Rush attempts |
35 |
42 |
| Yards per rush |
5.0 |
3.5 |
| Pass yards |
207 |
211 |
| Pass attempts |
15-26 |
20-28 |
| Yards per pass |
8.0 |
7.5 |
| 1st downs |
17 |
18 |
| 3rd down eff |
7-12 |
8-15 |
| 4th down eff |
1-1 |
0-2 |
| Explosiveness |
1.08 |
1.11 |
| Turnovers |
2 |
0 |
| Tackles |
47 |
31 |
| Sacks |
1 |
0 |
| Penalties-Yds |
2-25 |
3-16 |
| Possession |
27:55 |
32:05 |
Roll Tide and enjoy the bye week. I’ll see you here on the other side of UGA.