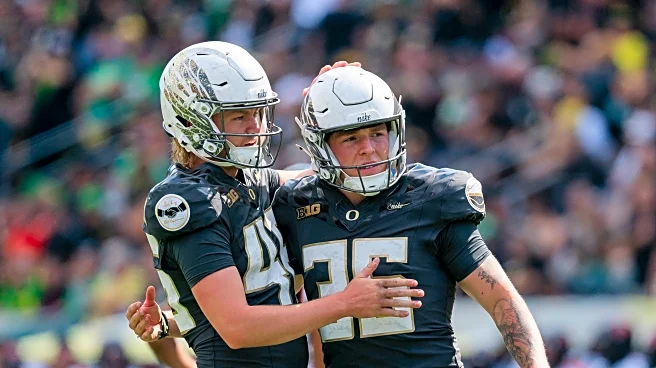
Inspired by a James Ferguson-Reynolds punt being downed at the 1-yard line, I wrote about the importance of starting field position last week. I covered the expected outcomes over the last decade and compared
this 2025 Oregon team to last year’s squad. I had intended to dive further into the details of field position resulting from special teams, but ran into play-by-play data quality issues.
Thankfully, I was able to clean the data sufficiently to do so in this article. Unless specified, the data does not include Oregon’s recent win over Minnesota. That said, let’s kick this off with kickoffs.
If you read my Week 8 analysis of field goal kicking, you’d be well aware that Oregon kickers have either struggled or performed on average with the power conference teams at long range. Oregon’s opposing kickers are still perfect on the year, most recently hitting from 58 (Iowa), 46, and 26 (Minnesota). On a positive note, and as predicted, Atticus Sappington has regressed to his career average after hitting all three attempts against Iowa (39, 40, 46) to win the game in Kinnick. Thank you, Atticus!
As it relates to kickoffs, Oregon is middle of the pack among power conference teams in terms of yielded field position. There isn’t much separation between teams. The vast majority of kickoffs end with the ball being placed on the 25-yard line. Oregon’s kickoff unit has done a good job of not giving up explosive returns most of the season.

Oregon ranks among the top-25 FBS schools in touchback rate off kickoffs (81.4%). The unit is low-risk, low-reward. They won’t hand the defense a short field. With Oregon’s elite defense, that’s all they need to do. Could the unit improve its standing? Sure. Would it change the outcome of games? Probably not. That said, Oregon’s remaining opponents, Washington and USC, are less effective in this area of the game. For the Huskies, that’s a trend in all manner of field position as it relates to special teams.

Last week, I made the case that James Ferguson-Reynolds should be a finalist for the Ray Guy Award. I noted how effective he has been both at flipping field position and pinning opponents deep in their own territory. However, I wasn’t able to provide a comparison to other teams. Having worked through the data cleaning process, I can rectify that. Oregon is #1 in opponent starting field position following a punt.

I noted last week that Oregon’s starting defense had given up just 14 points following punts, and this is a big reason why. Oregon’s defense held up their end of the bargain this week following two garbage-time punts, a 42-yarder, pinning Minnesota at their 10-yard line, and a 58-yard touchback. Touchbacks have been a rarity for Ferguson-Reynolds. He now has just two on the season.

Another way of looking at this is by measuring punt efficiency. I designed a simple calculation for it that could likely be improved by weighting net punt yards versus available punt yards differently when punting deep in your own end. As a first pass, I’m quantifying punt efficiency as the net punt yards (the difference between where the ball is spotted before and after the play/punt concludes) divided by the yards to the goal line (available punt yards). Oregon ranks second among power-conference schools, while Washington ranks third-to-last.
Given the wider range of outcomes, punt yielded field position and punt efficiency offer much more interesting box plots than we saw with kickoff results. Washington yields nearly 12 additional yards after punting than Oregon does. Comparing the worst cases of punt yield field position, Oregon ranks 2nd among power-conference teams (tied with USC).
If given the opportunity, I expect James Ferguson-Reynolds will be a difference maker, helping to win the third phase of the game this week against USC. We should see utter dominance in this area the following week against Washington if they manage to force a punt.
Unfortunately, the voting body of the Ray Guy Award chose not to recognize James Ferguson-Reynolds’ achievements this year. They announced their ten semifinalists, with his name notably missing from the list.
- Brett Thorson, Georgia
- Daniel Hughes, New Mexico
- Dante Atton, Temple
- Evan Crenshaw, Troy
- Jackson Ross, Tennessee
- James Rendell, Notre Dame
- Luke Freer, Air Force
- Nick Haberer, Vanderbilt
- Palmer Williams, Baylor
- Tyler Perkins, Iowa State
Among the statistics used to identify the winner are net punting average, percentage of punts inside the 20-yard line, and percentage of punts not returned, with particular emphasis placed on net punting average.
According to the awards’ web page, they use three statistics and heavily weight net punting average. Too much so if you ask me. It punishes punters for being attached to efficient offenses. It’s much harder to have a high net punt average when you’re frequently punting near or across midfield. That doesn’t make the punter’s performance any less critical. James’ average available punt yards ranks dead last in the FBS (59.95). The 10 semifinalists have an average available punt yards stat ranging from 62.11 to 68.47 yards.
James Ferguson-Reynolds hasn’t allowed a single return all year. By that metric, no punter is better. If we refer back to the touchback percentage versus average starting field position chart (an alternate measure to punts inside the 20-yard line), you can draw a circle around six teams. With James Ferguson-Reynolds’ measurement being better than the other five teams’ punters, he is the only punter not selected as a semi-finalist.
The next time you see James Ferguson-Reynolds punt, give him the ovation he deserves. It’s the least we as fans can do.


