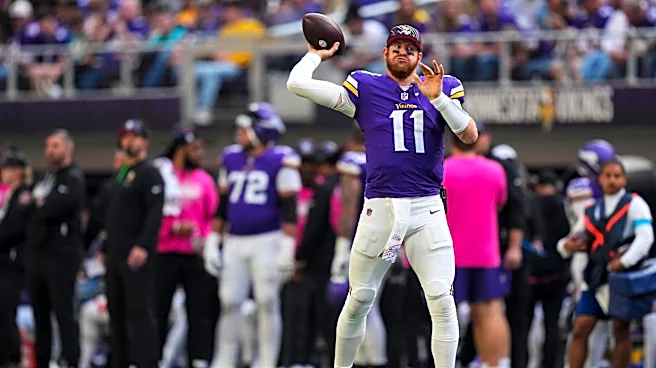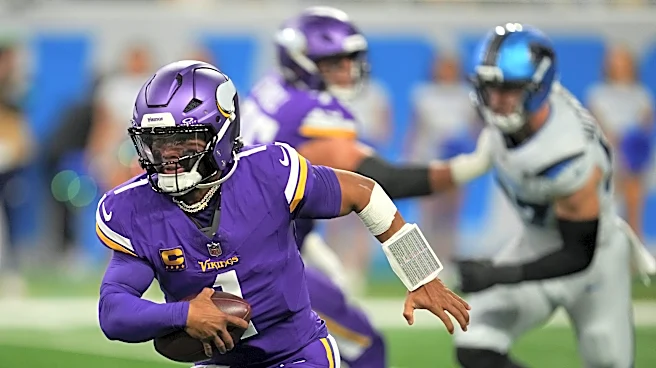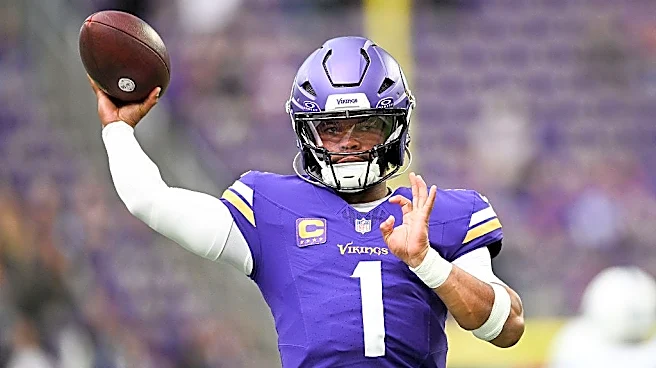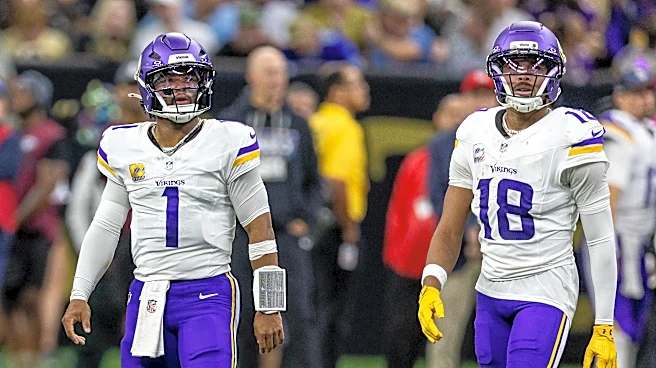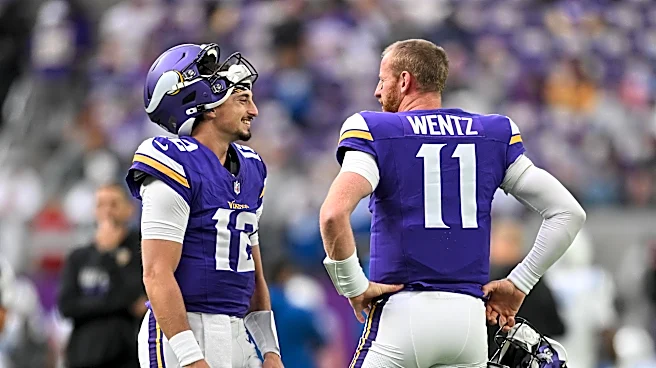


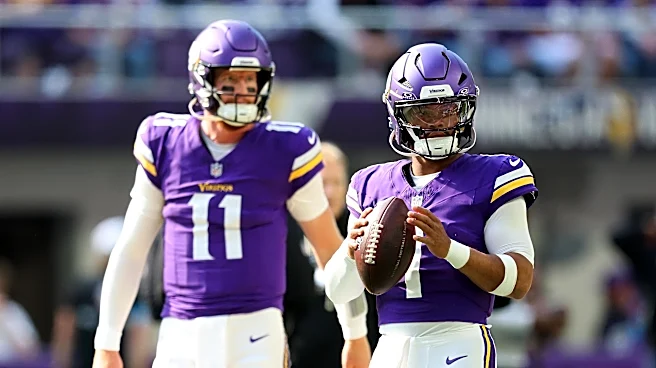

I want to start with an apology this week as my full time and life convened to sap most of my time and energy. I wasn’t going to do nothing for this week’s opponent preview though and luckily the Minnesota Vikings handed me a softball with the decision to start Carson Wentz at quarterback over Kyler Murray. Even better, Wentz has played a couple game this season meaning we don’t have an empty data set on what to expect. So then…
Was Wentz actually better than Kyler Murray?
Splits and Charts
Data Splits
I can’t believe I’ve gotten
this far into the season without a shoutout to pro-football-reference.com
The chart below is courtesy of PFR with some columns removed that I don’t personally love for analysis purposes (and I needed to cut out some clutter as this is already a wiiiiiiiide image).

Now, when it comes to the split, Murray started Week 1 against the Green Bay Packers for 11 snaps before Carson Wentz took over after a late hit led to an early exit for Murray. Wentz started the following week against the Chicago Bears. Wentz threw 19 times against Green Bay and 20 times against Chicago. Basically what I’m saying is treat this more like Murray has played five games and Wentz has played two.
Yes that’s still a smaller sample size than I’d love to work from but it does give us a little window into things with both playing for the current team we’re looking to analyze. So let’s get to it; what might we expect to be different?
First off, we see that Kyler Murray actually has the higher completion rate and it’s not an insignificant one. Making that even more wild is that of the two games Wentz played, the one he came in expecting to be the backup was the one where he had the higher rate. That suggests that the completion rate may not improve for Wentz despite getting starter’s reps this week.
Now scan to the right and see that Wentz has the higher yards per attempt and completion. If you’re into math, you might know why I jumped to this stat next. For completion rate, a lower number means more incomplete passes. The yards per attempt on an incomplete pass are always 0. A low completion percentage then tends to drag down your yards per attempt metric. Wentz has not thrown enough passes for me to confirm this on next gen stats, but this should be a lock to mean that Wenz has a higher average intended air yards. That’s a fancy way of saying that he’s pushing the ball down the field more than Murray.
There’s also a drastic difference in touchdown percentage with Wentz throwing touchdowns 7.7% of the time to Murray’s 3.2%. That’s a massive difference. It’s also a mirage. Wentz threw for three touchdowns in the season opener and zero in the next week. That Week 1 fluke was also the only time the Vikings scored more than 23 points. That Week 2 game was also their worst output of the season with Wentz under center, scoring only nine.
For interceptions, Wentz has the edge there as well but with the small sample size and Murray also having a decent rate I would wager there’s not a huge gulf between the two. As a reference point, if Wentz had one interception this season he’d have a 2.6% interception rate.
Last but not least is sack rate where the data (again, small sample size) suggests that Murray has the distinct advantage. For a defense looking to find its groove, that could be a very good sign indeed.
If we take a look historically, there’s some validation for the above. Wentz’s 4.6% touchdown rate is a bit ahead of Murray at 4.1%. They both have an identical 2.0% interception rate for their careers. Interestingly, Murray has a slight edge on yards per attempt (opposite of above) but retains a significantly better completion rate. So it still means Wentz is more likely to throw it deep than Murray, but also more likely to let the ball hit the turf. And finally, Wentz is more likely to take a sack but it’s not a massive difference there over their careers.
A couple of charts
The NFL’s Next Gen Stats site has cool scatterplots of thrown passes if you’re not aware. For Kyler Murray, I think this one is pretty representative of his season in Minnesota so far.

There’s a lot here near the line of scrimmage but a few shots down the field, mostly to the left side. Notice too all the white dots on the left hand side. They keep trying to hit there, but they’re struggling.
Here’s the one chart so far this season for Carson Wentz.

Yeah, in this game he looked a lot like that Kyler Murray chart, didn’t he? That leads me to…
The Final Straw
I’ll keep this short and sweet. There are some differences between the two quarterbacks for sure. It’s just that none of them are drastic differences. This comes across as a shakeup for the sake of a shakeup or to try to disrupt game planning for their opponent (which is us). I don’t see why the Bills would need to put a whole lot of extra effort in though to handle Wentz rather than Murray.
If anything, the one big difference between the two means Wentz could be easier to plan for. Wentz has ran the ball eight times this year and is average 0.8 yards per carry. Murray isn’t known for running, but is averaging 5.8 yards per carry. The two quarterbacks have similar output, but Wentz is one-dimensional. On the surface, it sounds like the Vikings may have purposefully downgraded.