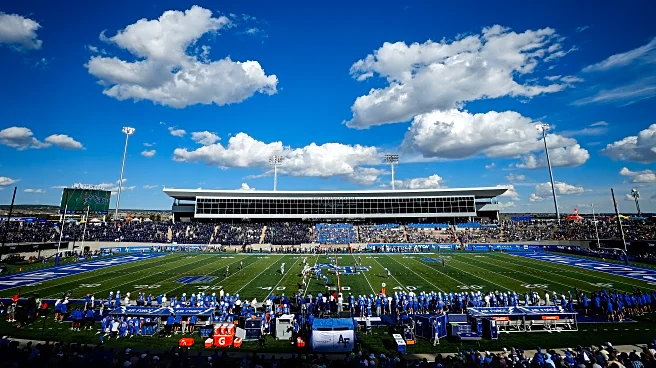
A couple weeks ago, Hawaii left the tropical, humid, sea level islands and went to Falcon Stadium which is dry and 6,621 feet above sea level and won. That brought to mind the question of how big is home field advantage? What was going to be a simple question turned into a three-part series about home field advantage in the Mountain West and due to the amount of data (and I only used 2024 conference data), I had to skip Stats Corner last week because the article started getting longer and longer.
This week on Stats Corner, we are going to look at the statistics between home and away teams to see if there is an advantage. The next two weeks cover which teams travel the best and then which stadiums have the biggest advantage. After I started writing, UNLV left Las Vegas and 80-degree weather to go play Wyoming in the snow, and the Rebels won adding more intrigue to the question. Overall data can be found at the end of the article. Record The first question about home field advantage is “what is the record?” In 2024, the MWC played 7 conference games (due to a scheduling agreement with the PAC 2 before everything got messy and the lawsuits arrived), with some teams having 4 home games and other just 3 home games. The overall record for the 42 conference games was 22 wins for the home team and 20 wins for the road team. Looking at the win-loss column of the 42 conference games, the picture appears surprisingly balanced. This initially suggests a negligible advantage, perhaps debunking the myth. However, diving deeper into the metrics reveals a much more compelling story. Points, Yards, and Time Despite the nearly even win-loss records, the scoring differential paints a clearer picture of dominance. Home teams amassed 1271 points (averaging 30.26 per game), significantly outscoring road teams who managed 1066 points (25.38 per game). That nearly five-point advantage per game is a substantial difference often overlooked by mere win-loss totals This offensive supremacy extends to yardage, with home squads gaining an average of 413.1 yards and 6.0 yards per play, comfortably surpassing visiting teams’ 390.6 yards and 5.8 yards per play. Interestingly, time of possession remained almost identical, with visiting teams holding the ball for a mere 12 seconds longer on average—a minor consolation that clearly didn’t translate into more points or yards. The home team scores more, has more yards, and more yards per play than the visiting team and the visiting team got to possess the ball 12 more seconds (not exactly a fair trade). Turnovers and Penalties The Away team had more turnovers and penalties compared to the home team. There were 52 turnovers by the visitors compared to 47 for the home team. The visiting team was penalized for a total of 2614 yards at an average of 62.2 yards per game versus the home team 2306 yards and an average of 54.9 yards per game for the home team. Is it the pressure, the travel, or perhaps, as some speculate, the subtle influence of a roaring home crowd on officiating that leads to fewer flags for the hosts? First downs The home crowd got to celebrate getting a first down 911 times or 21.7 times a game. While the visiting crowd had 863 first downs or 20.6 times a game. Conversion Rates Even though all football fields are the same dimensions, quarterbacks seem to prefer playing at home where they completed 62.0% of their passes, compared to traveling where they completed 60.2% of their passes. While the number of 3rd downs was as even as you could get 582 for the home team and 581 for the away team, the conversions were different. The home team converted 255 or 43.8% and the away team converted 227 for 39.1% rate. This nearly 5% drop in third-down conversion success on the road is a critical factor, often deciding tight contests and stalling crucial drives. Desperation often leads to more aggressive play. Away teams attempted fourth-down conversions more frequently (99 vs. 76), yet their success rate of 59.6% lagged slightly behind the home team’s 60.5%, further diminishing their offensive opportunities. Red Zone and Special Teams Efficiency in the scoring zone dramatically favors the hosts. Home teams converted 89.3% of their 168 red zone trips into scores, a superior rate to the visiting team’s 84.4% success on 141 attempts. While field goal percentages were remarkably close, 45 out of 58 (77.6%) for the home team and 43 out of 56 (76.8%) for the visitors, the edge in red zone scoring efficiency is undeniable. Even punting tells a curious tale. While road teams punted more often (177 vs. 163), their punters surprisingly averaged slightly more yards (42.7 vs. 41.9)—perhaps a small silver lining in an otherwise challenging road environment. Overall When we peel back the layers of simple win-loss records, a clear narrative emerges: home-field advantage in the Mountain West is far from a myth. From significantly higher scoring and yardage to fewer turnovers, penalties, and superior conversion rates, nearly every key statistic points to a tangible edge for playing on your own turf. This statistical cushion can indeed be the difference maker, allowing ‘lesser’ teams to clinch victories they might otherwise surrender on the road. Join us next week, as we delve into the flip side of the coin: uncovering which teams defy these odds and truly ‘travel the best’ across the conference.


