


I did not like this game! I suppose there are two silver linings: First (I say this knocking on wood), it would appear that Victor Wembanyama’s injury (a bone bruise in his ribs) is unlikely to be a serious problem in the sense that he should be fine for the playoffs. Second, it gave me the opportunity to find out that the League’s absurdly complex 65-game rule is actually a 63+2 rule in which players are allowed to receive credit for up to two games in which they play 15-19 minutes (all other games require
20+ minutes to count towards the total). As such, Wemby gets credit for this game, and is now just one game away from satisfying the requirement. I normally don’t care too much about regular season awards, but in this particular case I actually think that it would cause the NBA serious reputational harm if the individual universally regarded as the best defensive player did not win DPoY because he fell one game short of an arbitrary threshold.
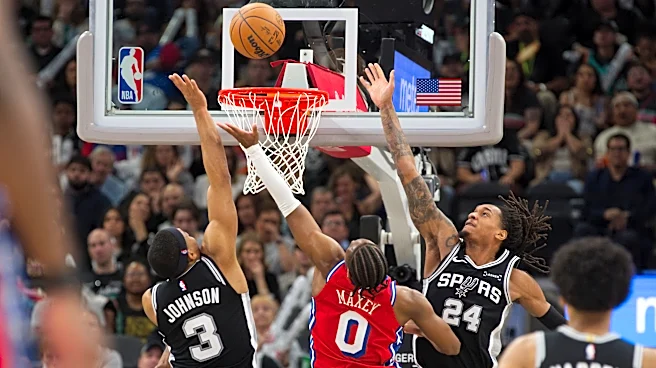
As impossible as it is to set the injury issue aside when discussing how I feel about this game, I can be more calm and objective when it comes to discussing the box score. Fortunately, the Sliver and Black put together a really solid performance overall, and it shows up in some of the box score highlights:

- Fun fact: Philly and San Antonio had the exact same number of field goal attempts (89) and three-point attempts (32) in this game. In the 16,845 regular season games since the start of 2012-2013, this is just the 34th time that two teams have tied in both these areas.
- Fortunately, the Spurs were far more effective in shooting from the field overall, logging a FG% margin of +11.24 percentage points enroute to making 10 more baskets. San Antonio’s edge in 3P% (+3.13 percentage points) was literally as small as it could be while still being positive, but still translated to a +1 advantage in made threes. As a result of all this, the Spurs outscored Philadelphia by 21 points from the field.
- Despite this huge disparity, the 76ers kept the game interesting for much of the time. One way they managed this was by earning a +8 advantage on the offensive glass, which helped give them an upper hand in overall offensive opportunity. Because the Spurs fouled more (+2) and at worse times, this mostly showed up as an edge in free throw attempts (+7).
- In addition to greater volume from the charity stripe, Philly also had a notably better FT% (+10.03 percentage points). As a result, the 76ers made eight more free throws.
- It’s slightly atypical for the losing team to earn such a big margin at the free throw line while making far fewer shots from the field, though not as much as you might think. In fact, this contest marked the 812th occasion in the last 13 regular seasons where the winning team had a FGM of +10 or better and a FTM margin of -8 or worse (that’s about 4.82% of all games). The worst FTM differential achieved by a regular season winner with a FGM of at least +10 since the start of 2012-2013 was -26. That actually happened twice, and both games were home wins by the Phoenix Suns (Dallas @ Phoenix on 2/10/26 and Lakers @ Phoenix on 11/22/22).
What are Team Graded Box Scores?
Very briefly, these box scores grade winner-loser differentials for basic box score statistics, with the grade being based on the winning team’s differential relative to other NBA winners during a defined reference period. Think of it like a report card for understanding how a given winner performed relative to other winners. The reference period used runs from the start of the 2012-2013 season to the latest date of play, including only games in the same season category (i.e., regular season and playoff games are not compared to each other).
Data Source: The underlying data used to create these box scores was collected from Basketball Reference. In all cases, the data are collected the morning after the game is played. Although rare, postgame statistical revisions after data collection do occur and may affect the results after the fact.